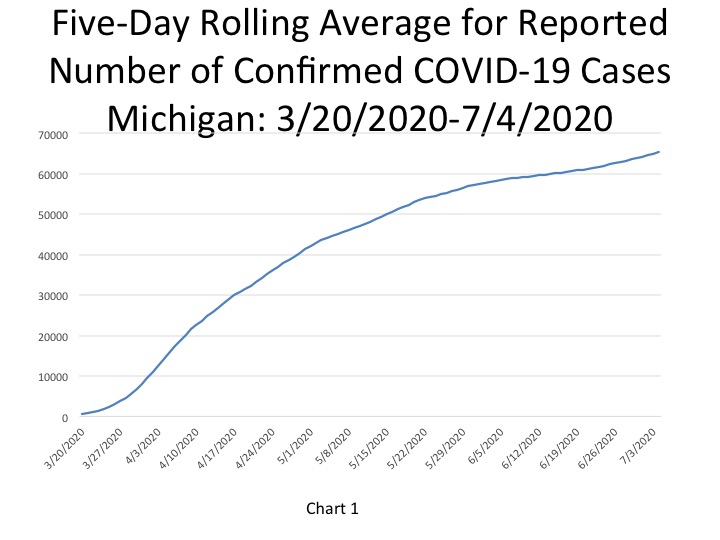
On July 6, the State of Michigan reported a total of 66,173 cases, an increase of 297 cases from the day prior. In terms of the number of new daily cases, the 297 new COVID cases reported on July 6 is a decrease from the 543 new cases reported on July 5. Of the new 297 new COVID cases, 97 were documented in Southeastern Michigan. In total, 33 percent of the new COVID cases were in Southeastern Michigan, meaning case numbers are increasing at a higher rate outside of the region than locally. In Chart 1 we show that the State total for the number of COVID cases on July 4 was 65,346–a five-day rolling average. The five-day rolling average for the total number of COVID cases (Chart 1) reflects a smoother curve and adjusts for fluctuations in testing and/or the quality of reporting or failure to report. A closer look at Chart 1 shows how the once flattened curve has been increasing at a higher rate since late June.
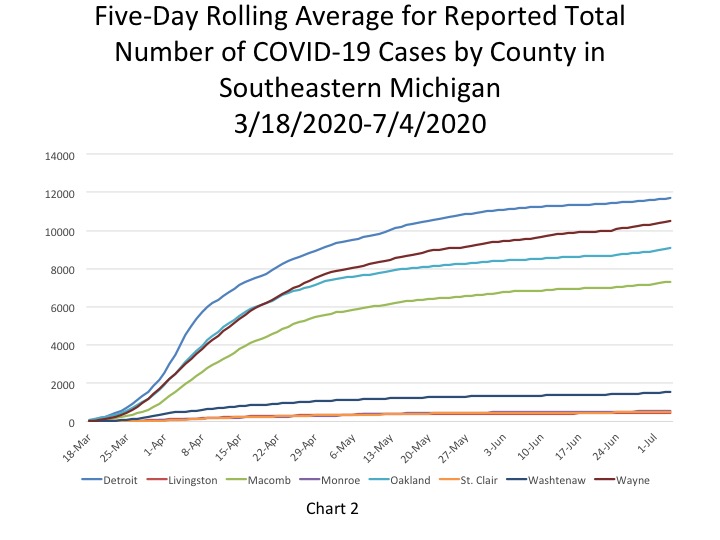
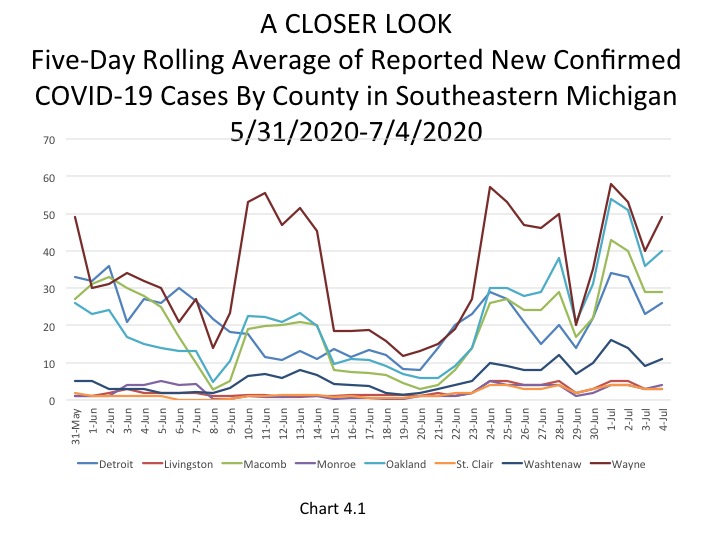
Chart 2 shows that, based on the five-day rolling averages, the growth of new COVID cases in Southeastern Michigan continues to increase, with a noticeable uptick particularly in Wayne County. On July 4, Wayne County’s numbers reached 10,514, an increase of 199 new cases since July 1. Detroit, which continues to have the highest overall number of cases, reported 11,697 COVID cases on July 4. Oakland County reported 9,081 cases and Macomb County reported 7,315.
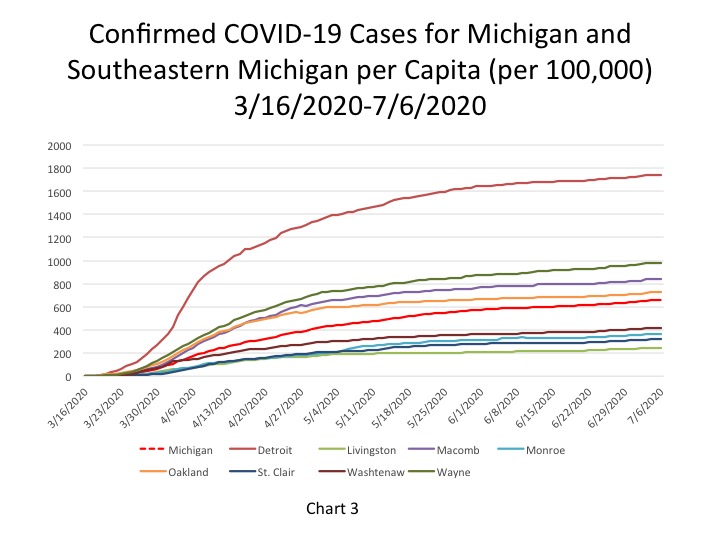
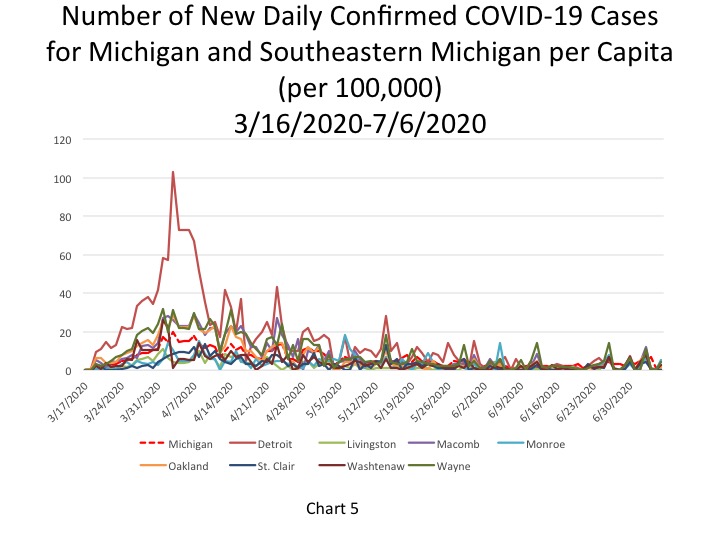
The City of Detroit had 1,744 COVID cases per 100,000 people as of July 6, an increase from 1,741 on July 5(Chart 3). This is based upon a reported increase of 19 new COVID cases between July 5 and July 6, bringing the total number of COVID cases in Detroit to 11,728. Wayne County reported 982 cases per 100,000 people, and Oakland County had 725 cases per 100,000 people. These per capita rates were based upon 10,578 total cases for Wayne and for 9,123 Oakland. Macomb County reported 840 cases per 100,000 people, which is based upon 7,339 cases.
The daily data highlighted in these posts is from Michigan.gov/coronavirus, where data is updated daily at 3 p.m. Historical data were supplied from covidtracking.com, which republishes COVID data from the State. Additionally, the case totals do not reflect the number of people who have recovered, just those who have been infected. In early June the State changed how it reports its data on the website, making data more accurate in the long-term but more complicated to track as well. The State regularly updates older data and as we continue to publish regular updates on COVID the State’s changes to past data many not always be reflected in our posts. The data published in new posts is accurate for the day we received it on though.
On July 6, the State of Michigan reported a total of 66,173 cases, an increase of 297 cases from the day prior. In terms of the number of new daily cases, the 297 new COVID cases reported on July 6 is a decrease from the 543 new cases reported on July 5. Of the new 297 new COVID cases, 97 were documented in Southeastern Michigan. In total, 33 percent of the new COVID cases were in Southeastern Michigan, meaning case numbers are increasing at a higher rate outside of the region than locally. In Chart 1 we show that the State total for the number of COVID cases on July 4 was 65,346–a five-day rolling average. The five-day rolling average for the total number of COVID cases (Chart 1) reflects a smoother curve and adjusts for fluctuations in testing and/or the quality of reporting or failure to report. A closer look at Chart 1 shows how the once flattened curve has been increasing at a higher rate since late June.
Chart 2 shows that, based on the five-day rolling averages, the growth of new COVID cases in Southeastern Michigan continues to increase, with a noticeable uptick particularly in Wayne County. On July 4, Wayne County’s numbers reached 10,514, an increase of 199 new cases since July 1. Detroit, which continues to have the highest overall number of cases, reported 11,697 COVID cases on July 4. Oakland County reported 9,081 cases and Macomb County reported 7,315.
The City of Detroit had 1,744 COVID cases per 100,000 people as of July 6, an increase from 1,741 on July 5(Chart 3). This is based upon a reported increase of 19 new COVID cases between July 5 and July 6, bringing the total number of COVID cases in Detroit to 11,728. Wayne County reported 982 cases per 100,000 people, and Oakland County had 725 cases per 100,000 people. These per capita rates were based upon 10,578 total cases for Wayne and for 9,123 Oakland. Macomb County reported 840 cases per 100,000 people, which is based upon 7,339 cases.
The daily data highlighted in these posts is from Michigan.gov/coronavirus, where data is updated daily at 3 p.m. Historical data were supplied from covidtracking.com, which republishes COVID data from the State. Additionally, the case totals do not reflect the number of people who have recovered, just those who have been infected. In early June the State changed how it reports its data on the website, making data more accurate in the long-term but more complicated to track as well. The State regularly updates older data and as we continue to publish regular updates on COVID the State’s changes to past data many not always be reflected in our posts. The data published in new posts is accurate for the day we received it on though.
In Chart 6, the five-day rolling average for the number of deaths in Michigan, shows the number of deaths in the State of Michigan continued to slowly inch toward 6,000. On July 4, the cumulative deaths were 5,970 deaths (an increase of 6 deaths from the day prior). The actual cumulative COVID-19 deaths on July 6 was 5,975, an increase of 3 deaths from the prior day. Of the 3 deaths that were reported on July 6, all of them occurred in Southeastern Michigan.
Chart 7 (a 5-day rolling average) further hones in on how majority of the COVID deaths in Michigan have occurred, and continue to occur, in Southeastern Michigan. On July 4, the City of Detroit reported 1,445 deaths, the same number it reported the day prior. Wayne County had the second highest total at 1,164 deaths on July 4.
The per capita rates for the number of total COVID deaths in Southeastern Michigan continues to remain stagnant across the region as counties, and the City of Detroit, experience zero to minimal increases in COVID death numbers. Detroit reported 215 total COVID deaths per 100,000 people on July 6, which was equivalent to 1,445 deaths. Wayne County reported a per capita rate of 108 (1,166 deaths), Macomb County reported a per capita rate of 101 (882 deaths) and Oakland County reported a per capita rate of 83 (1,049 deaths). The State of Michigan reported a per capita rate for the number of total COVID deaths at 60 per 100,000 people, which was equivalent to 5,975 total deaths.
Chart 9, the five day rolling average of deaths, shows the number of new statewide deaths was reported at 6 on July 4. Furthermore, Chart 10 and Chart 10.1 shows how the number of deaths in Southeastern Michigan continues to remain low but also how the region is the largest contributor to the number of Statewide deaths. Chart 10.1 shows a more in-depth look at the number of new daily COVID deaths in the last month so viewers can better discern where in the Southeastern Michigan the numbers are increasing, decreasing or remaining the same. Macomb, Washtenaw and Wayne counties each reported 1 new death on July 4; these were the only new deaths reported in the region. As Chart 10.1 highlights, no more than 7 new daily deaths have been reported since June 1, and those numbers have dropped even lower in recent weeks.
In Map 3, Wayne County had the highest average number of daily COVID deaths between June 25 and July 2 at 2.5 and Macomb County averaged 2.4. Detroit and Oakland County were the only other two regional entities that averaged more than 1 death during that time frame. Detroit averaged 1.8 COVID deaths between June 25 and July 2 and Oakland County averaged 1.1.
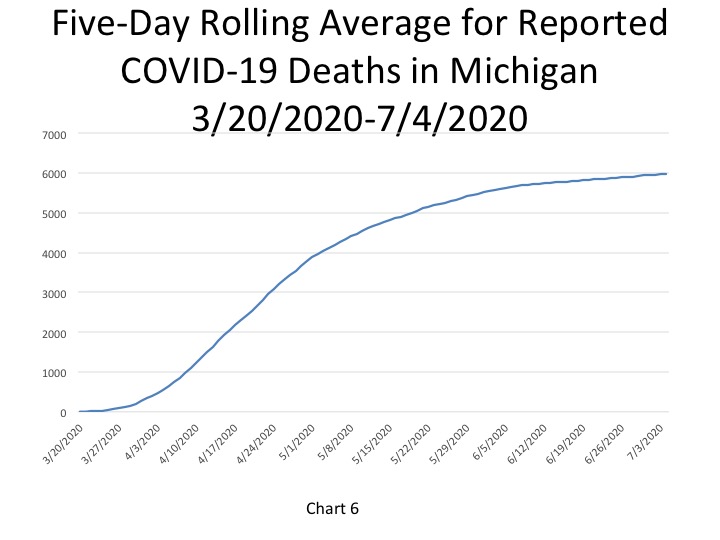
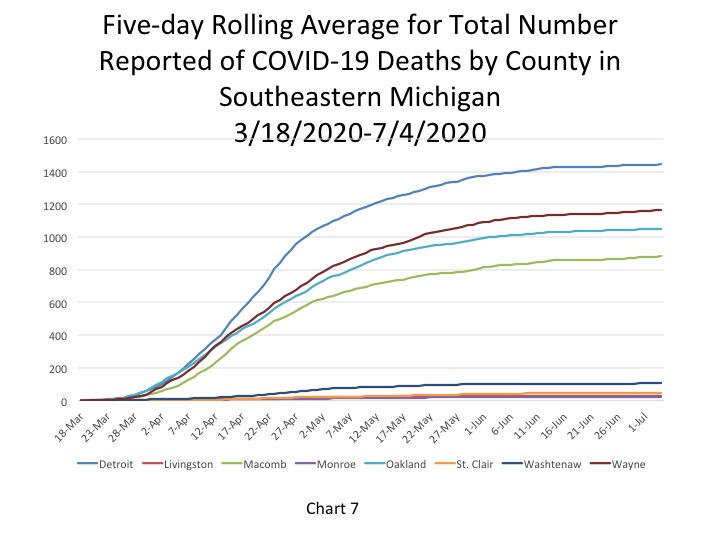
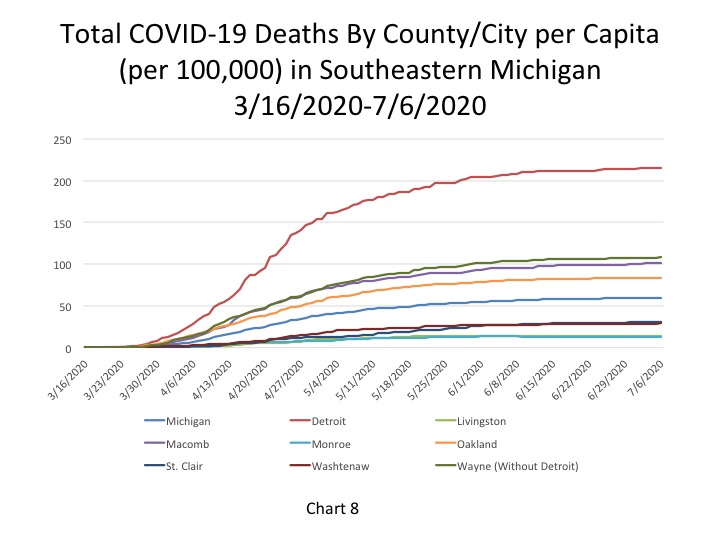
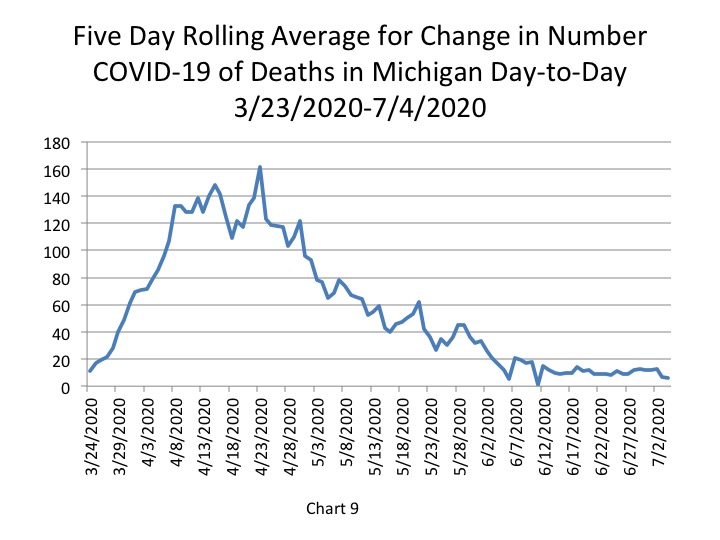
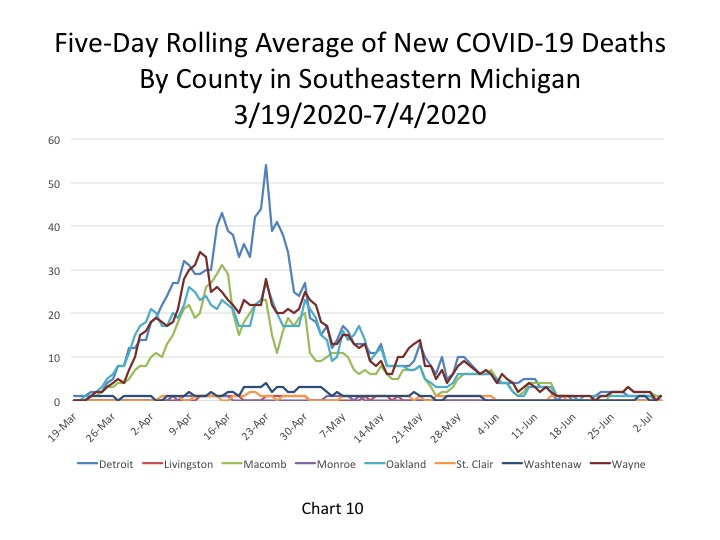
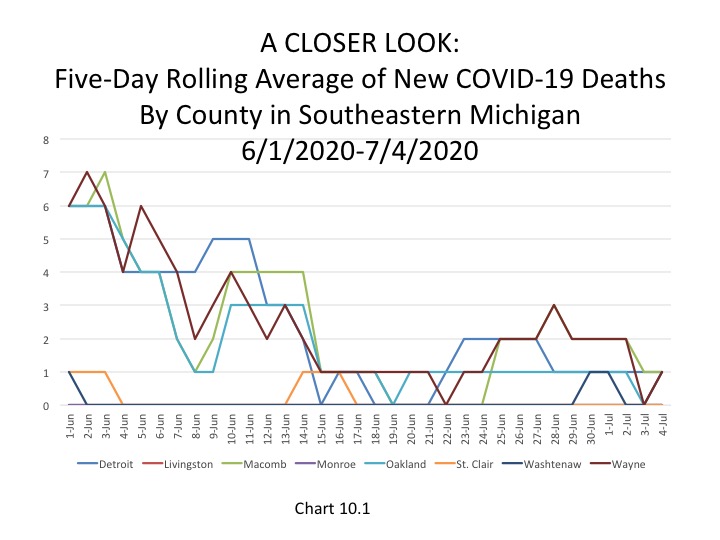
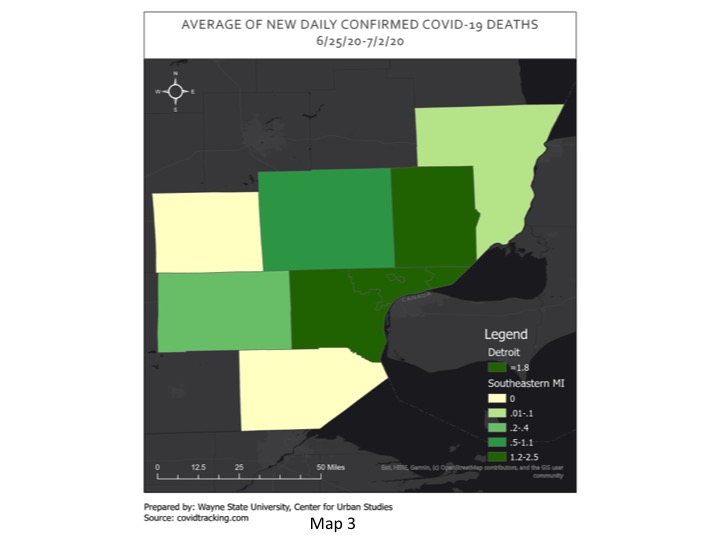
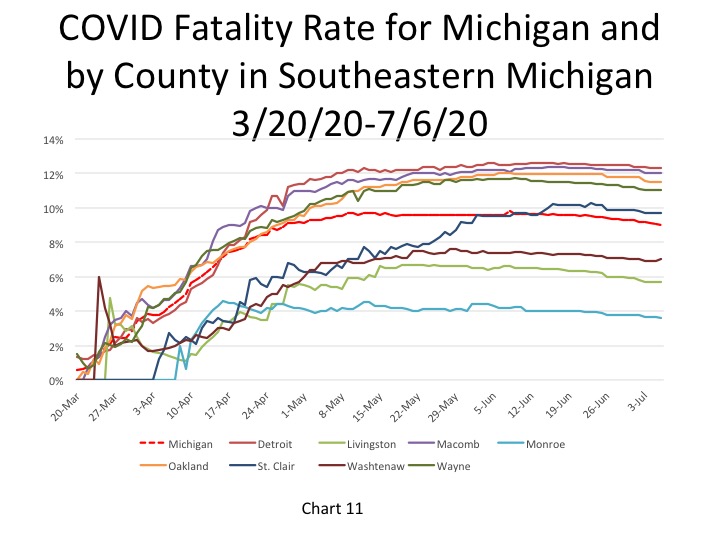
Chart 11 shows the overall fatality rates for Detroit, the counties that make up Southeastern Michigan and the State of Michigan. This large scale look shows that fatality rates continued to rise until about May and have remained fairly stagnant—generally within a percentage point—since then. On July 6 the State’s fatality rate was 9.3 percent and Detroit’s, which continues to be the highest, was 12.3 percent. While these fatality rates haven’t shown large signs of change, they are slowly decreasing throughout the region, except in St. Clair County.
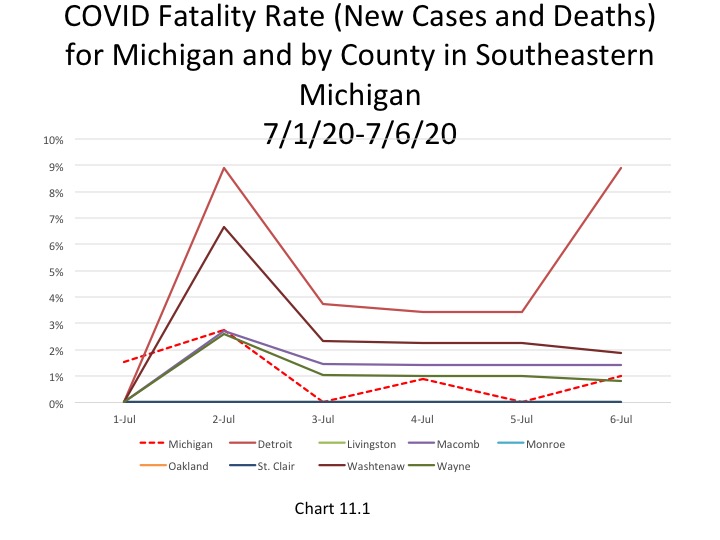
Chart 11.1 shows the fatality rate for just the month of July with the cumulative number of new cases and deaths for only this month. This chart was created in recognition that case and death numbers are lower than they were even a month ago and to highlight how even if case numbers spike death numbers continue to remain low. Using only July cumulative data for the new number of cases and deaths, Detroit continues to have the highest fatality rate at 9 percent and Washtenaw County has the second highest at 1.8 percent. The fatality rate for the State was 1 percent on July 6.
Michigan COVID numbers continue to increase by more than 200 cases a day over the last week, with a spike even higher likely to come after parties such as the one at Diamond Lake in Cass County took place. But, while the public continues ease up on following regulations meant to slow the spread of COVID, daily death numbers show that officials are gaining a better understanding on how to fight the disease once it is contracted. However, just because we are understanding the disease more does not mean it is any less of a threat. As has been noted since the beginning, COVID spreads quickly and if safety regulations are not followed we are at risk of seeing daily COVID case and death numbers rise.