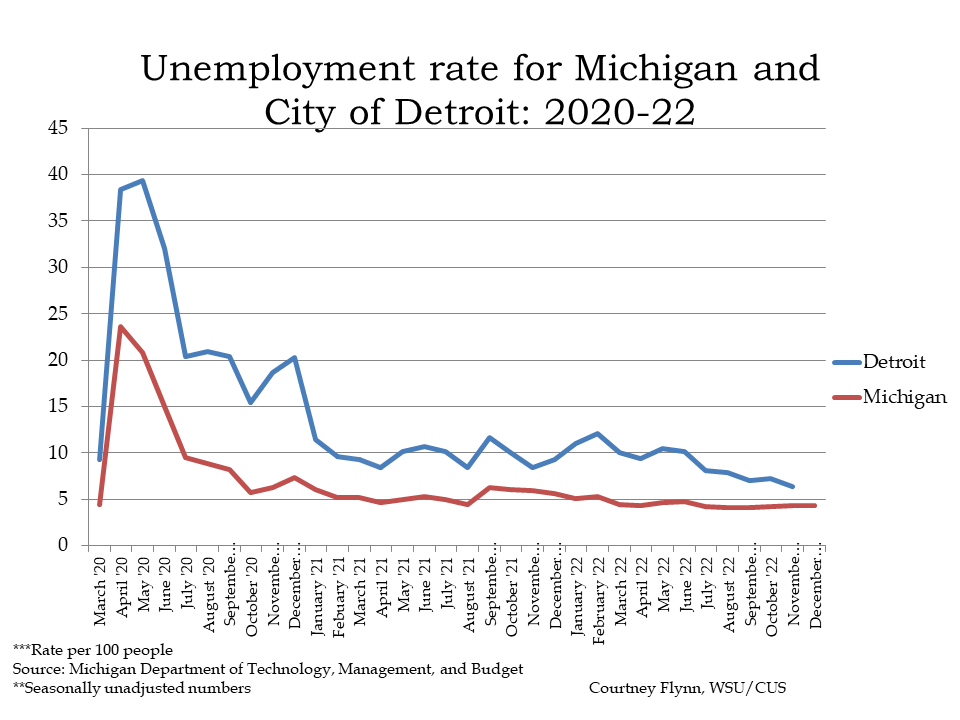
Unemployment rates for both the State of Michigan and the City of Detroit hit record lows in the second quarter of 2022.
In December of 2022 the unemployment rate for the State of Michigan was 4.3, which is inline with the State’s unemployment rate since March of 2022. In that time frame the unemployment rate for the state has only slightly fluctuated between 4.4 and 4.1 percent. For the City of Detroit, the unemployment rate for November of 2022 (December data was not yet available) was 6.4 percent.
The unemployment rate for Detroit has been regularly declining since May of 2022 when the rate was reported at 10.5 percent. In November of 2021, the unemployment rate for Detroit spike to 8.4 percent, down from the 10 percent the previous month.
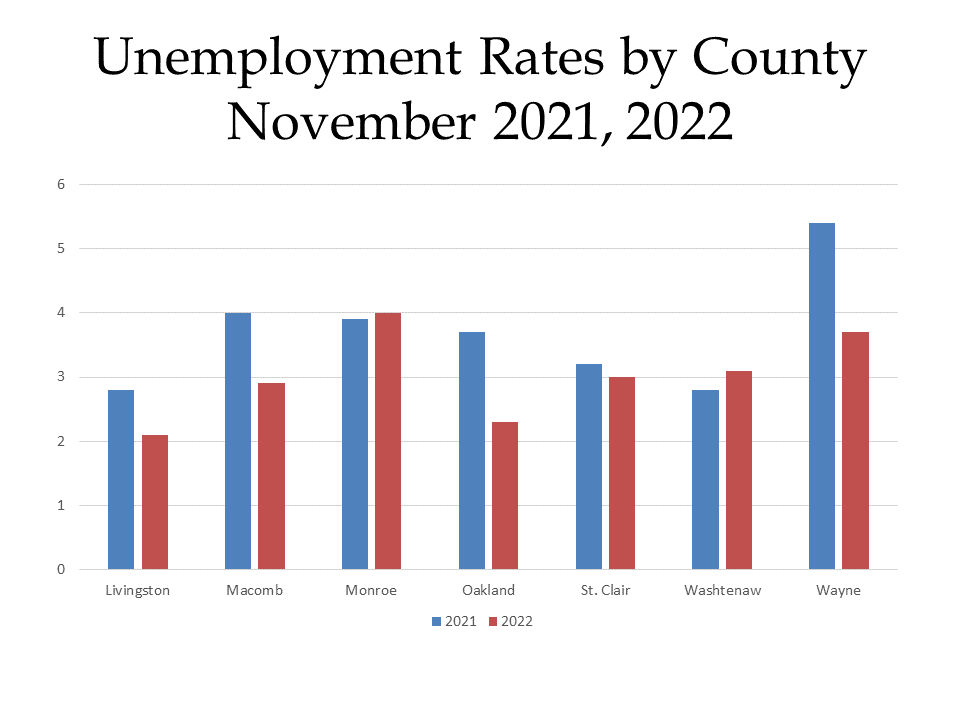
The chart below provides a more detailed look at unemployment rates throughout Southeast Michigan, both currently and a year ago. According to the data, Monroe and Washtenaw counties both had higher unemployment rates in November of 2022 than in November of 2021. For Monroe County there was only a 0.1 percent increase in the unemployment rate, with it being reported at 3.9 percent in 2021 and 4 percent in 2022. For Washtenaw County there was a 0.3 percent increase between November of 2021 and 2022. In 2022 Washtenaw County had the third highest unemployment rate in the region, falling only behind Monroe and Wayne counties. The unemployment rate for Wayne County in November of 2022 was 3.7 percent, which was the below the 5.7 percent unemployment rate the county reported in
Livingston County continued to have the lowest unemployment rate in the region at 2.1 percent in November of 2022, followed by Oakland County with an unemployment rate of 2.3 percent.
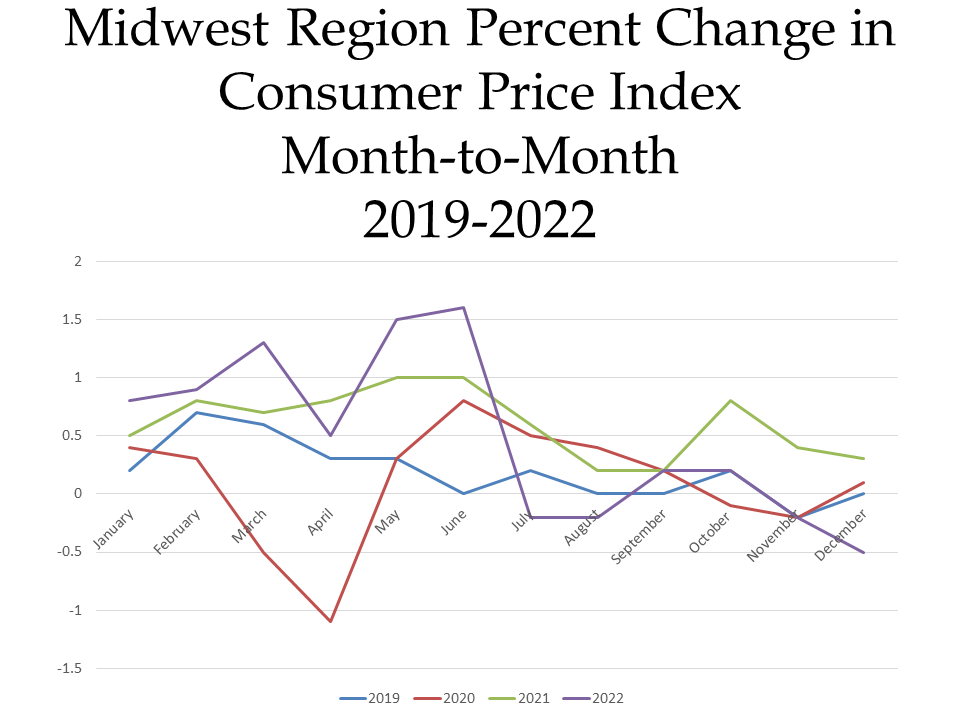
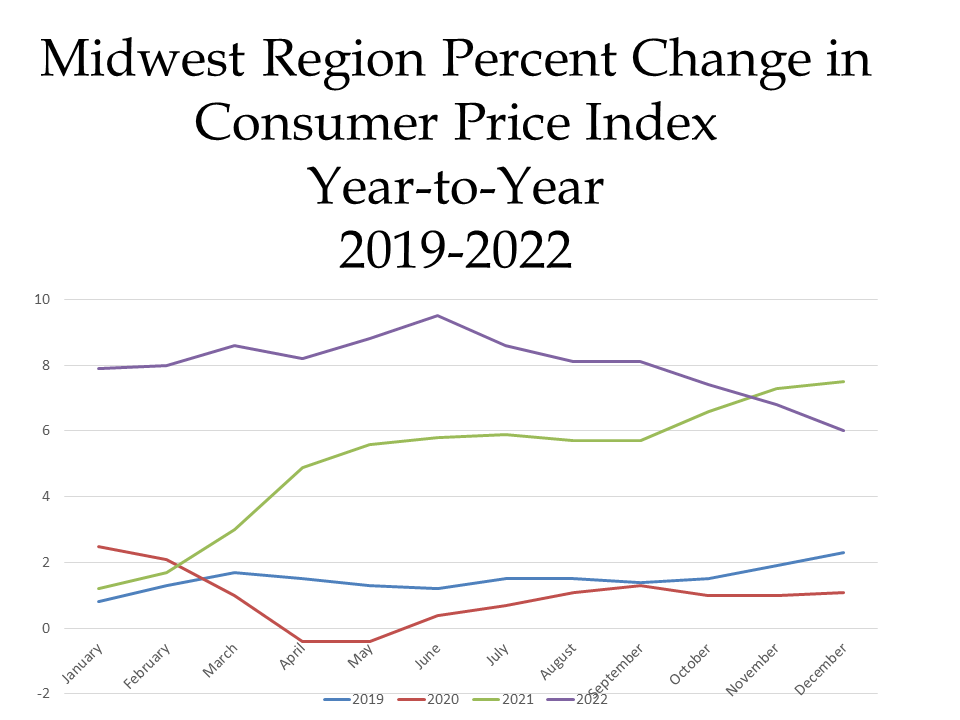
The first chart below highlights how the CPI changed on a month-to-month basis between 2019 and 2022. Currently in 2022, the region’s prices were down 0.5 percent in the month of December. The highlights for the change include:
•Food prices increased 0.3 percent for the month of December. Prices for food at home (groceries) and away from home (restaurants) both increased 0.3 percent.
•The energy index decreased 7.2 percent in December largely due to a 15.9 percent decrease in gasoline; prices for natural gas service increased 2.8 percent though and electricity increase 1.5 percent
•There were decreases in the cost for used cars and trucks (-2.4 percent), apparel (-1.8 percent), public transportation, and medical care (-0.3 percent).
When examining the second chart, which shows how prices changed on a year-to-year basis, we see how prices remain higher than 2019 and 2020 but that there was a decline in the CPI for the month of December between 2021 and 2022.
In December of 2022 the CPI was reported to be 6 percent above what it was the year prior. Contributing factors to the continued increase in the CPI include
•Food prices increasing 11.4 percent over the last year, with at home food prices increasing 13 percent
•Energy prices increasing 5.3 percent over the last year, with the largest contributor being natural gas (16 percent price increase)
•Rent prices increasing 7 percent
•Recreation prices increasing 6.8 percent
•The cost of used cars and trucks decreasing 9.1 percent.
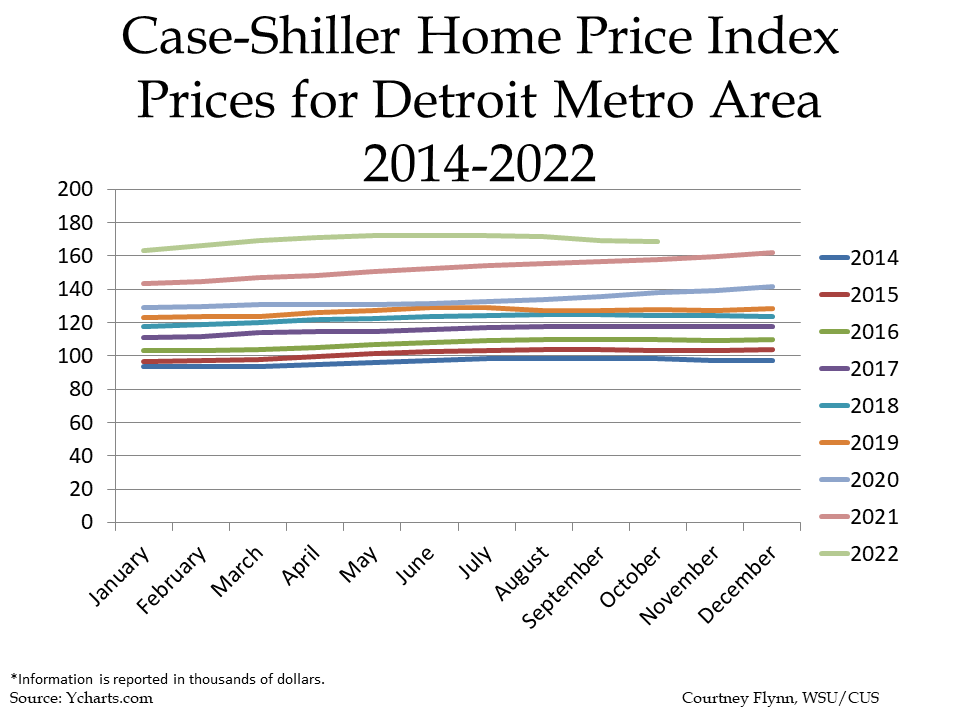
While home prices in Metro-Detroit continue to increase from one month to the next, the rate at which they are increasing is beginning to taper off. According to the Case-Shiller Home Price Index, the average price of single-family dwellings sold was $168,790 in October of 2022, a decrease of $450 for the average price of a home in September of 2022. This is the first there has been a decrease in the average home price in Metro Detroit since August of 2019. At that time home prices decreased $129,220 to $127,290. Since then though, the average price of a home continued to increase until October of 2022.
While the month-to-month trend of prices increasing broke, a look at data from year’s prior is a reminder just how much the average price of a home has increased. Between October of 2022 and 2021 the average price increased $9,200 and between October of 2022 and 2014 the price increased $70,570.
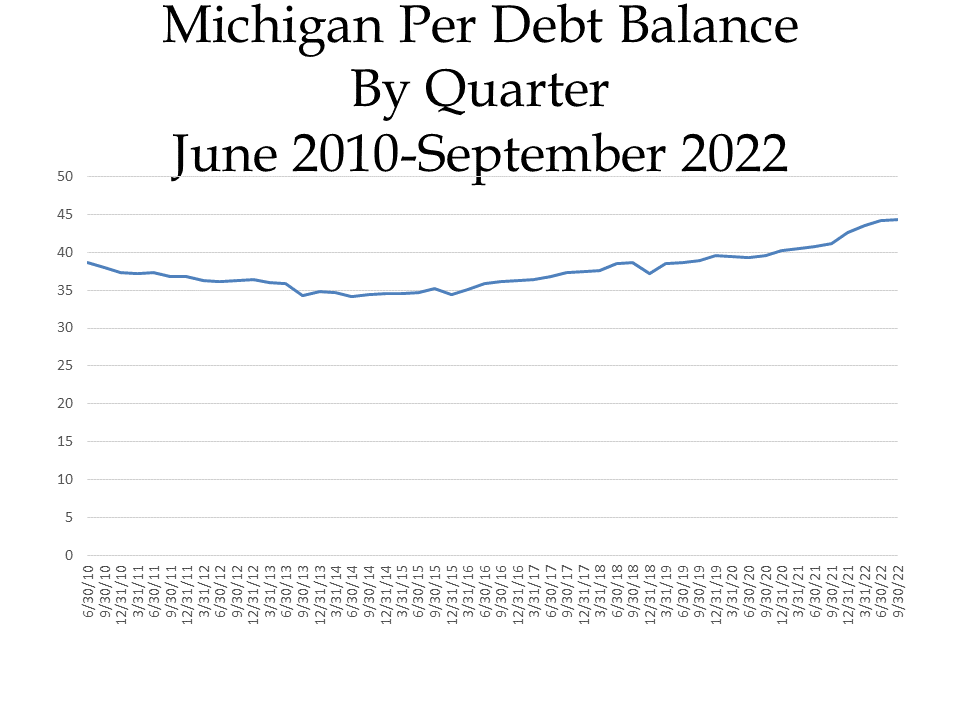
Debt for Michigan residents continues to grow, according to recent reports from the Federal Reserve Bank of New York. According to the data, the Michigan Per Capita Debt Balance came in at $44,370 at the end of the third quarter of 2022; this is an increase from the $44,130 Michigan Per Capita Debt Balance at the end of the second quarter in 2022 and from the $41,200 debt a year prior. Overall, the Michigan Per Capita Debt Balance increase 7.69 percent between September of 2022 and September of 2021.
According to WalletHub, $86 billion in new credit card debt was incurred in 2021 in the US. A recent CNBC article noted how household debt has increased at its fastest pace in 15 years, a trend that is further demonstrated in the chart below. Reasons for the fast-paced increase in debt include inflation and rising interest rates.