In a previous report, Drawing Detroit discussed mortality rates in the Southeast Michigan area. In this post, we would like to visualize some of that data through maps, specifically the average infant mortality rates, adult mortality rates, and adult mortality rates related to homicide, unintentional injury, and suicide.
According to the Michigan Department of Community Health, Detroit had above average mortality rates for all the categories presented below, with the exception unintentional injury death for those 75 and older and those who committed suicide.
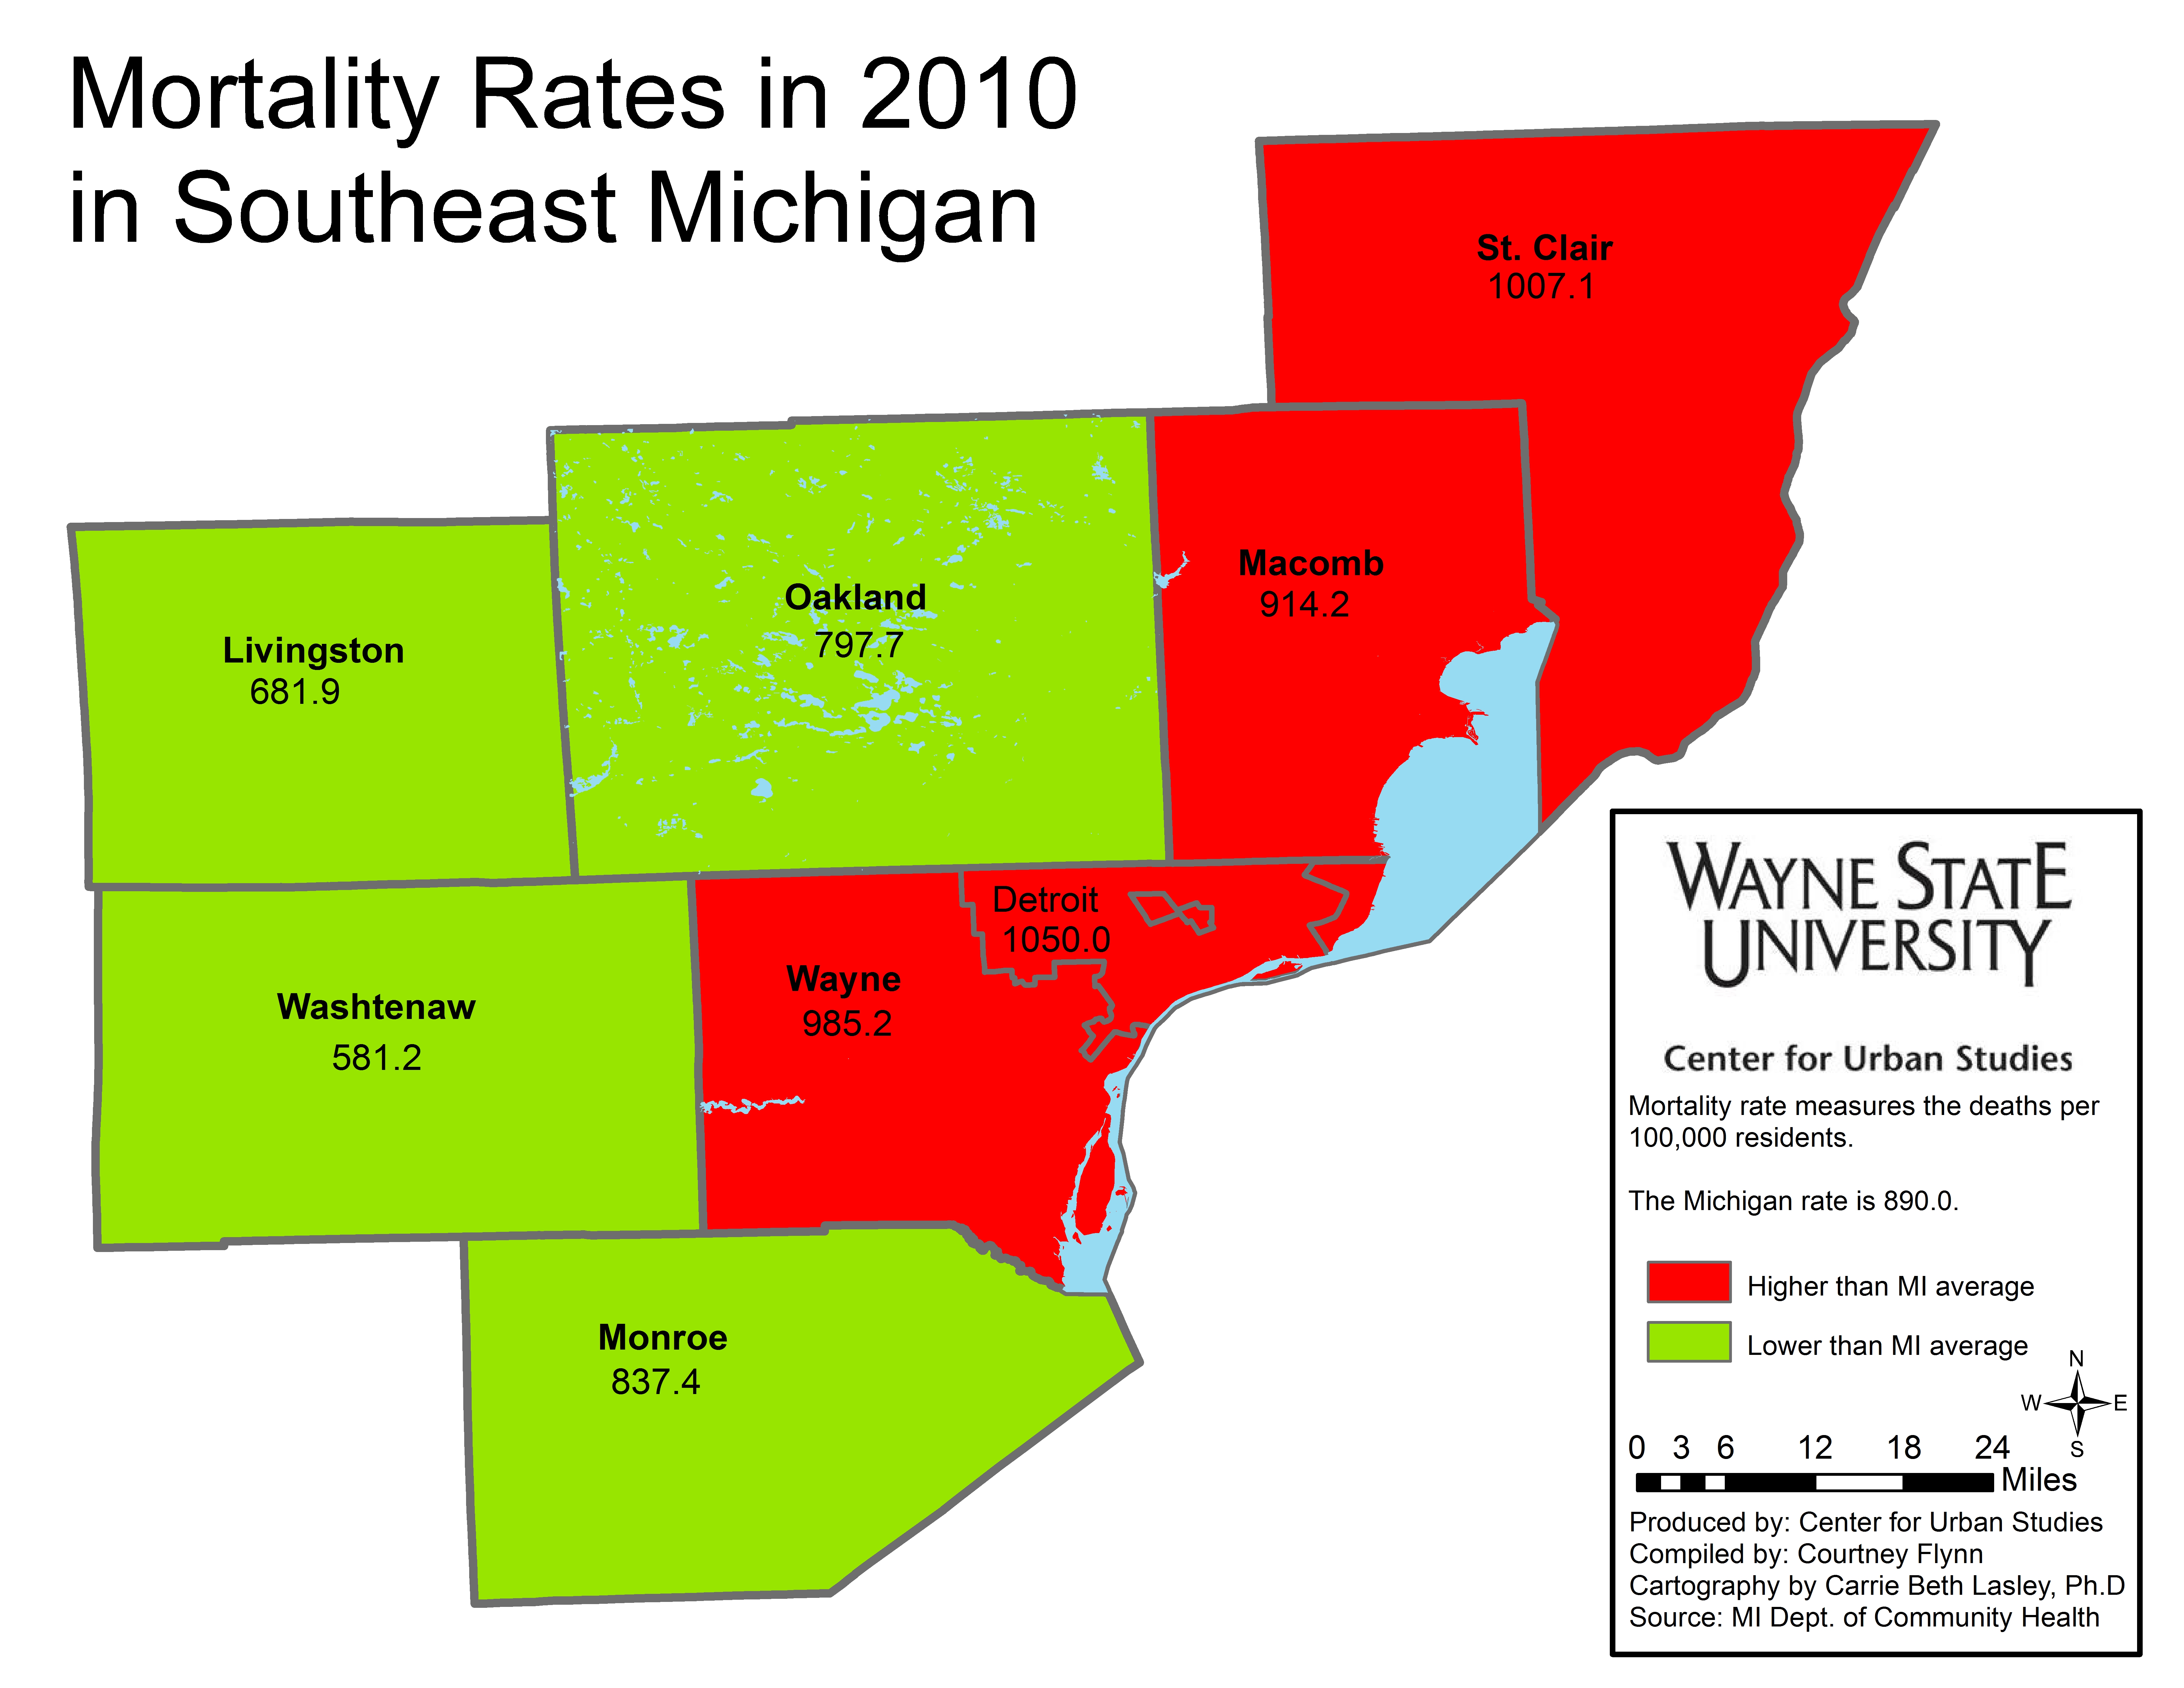
According to the Center for Disease Control and Prevention, the mortality rate is defined as “a measure of the frequency of occurrence of death among a defined population during a specified time interval.” For this map it is measured by deaths per 100,000 residents. The above map shows the mortality rates from 2010 for each of the seven counties that make up Southeastern Michigan. Of these counties, St. Clair County had the highest mortality rate in 2010 at 1,007.1 per 100,000 residents; Wayne County had the second highest rate at 985.2. Washtenaw County had the lowest rate at 581.2. Detroit’s mortality rate in 2010 was recorded at 1,050 per 100,000 residents.
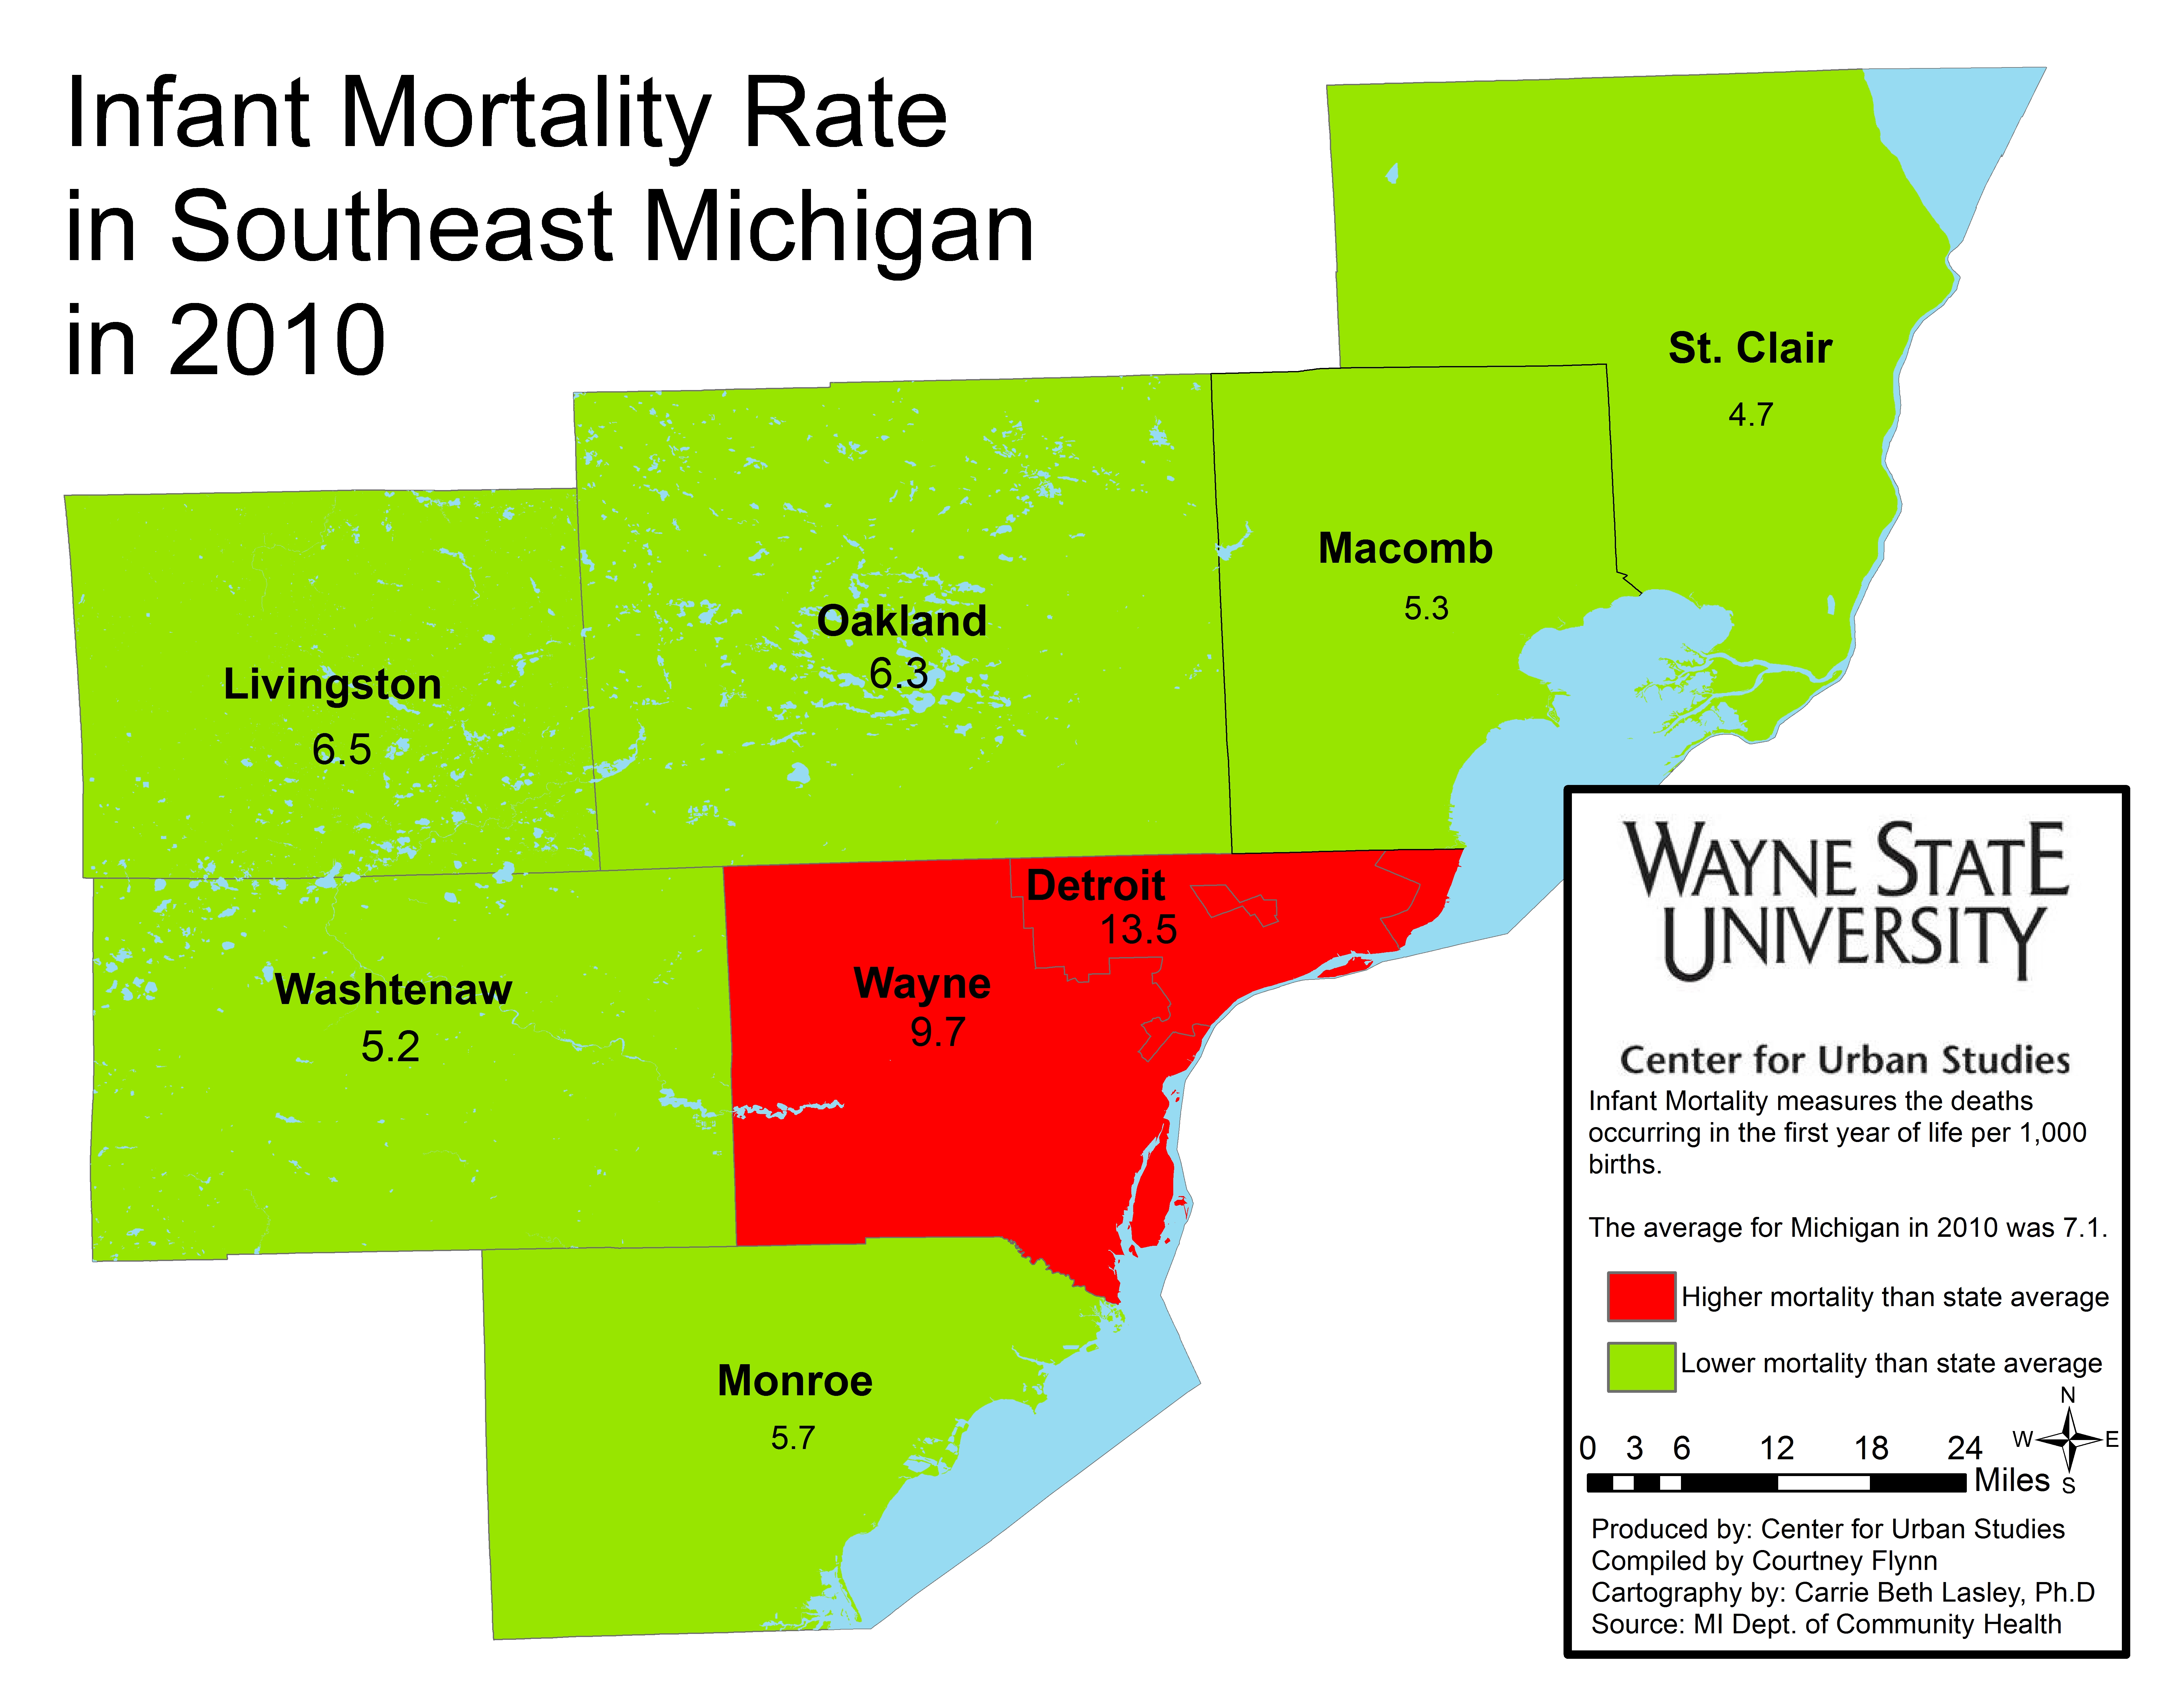
Infant mortality measures the deaths occurring in the first year of life per 1,000 births. For 2010, the Michigan Department of Community Health reported that the average infant mortality rate for the state was 7.1 per 1,000 live births. Wayne County had the highest infant mortality rate of the seven counties in the region at 9.7 per 1,000 live births; the City of Detroit had a rate of 13.5. Washtenaw County had the lowest infant mortality rate at 5.2 per 1,000 births.
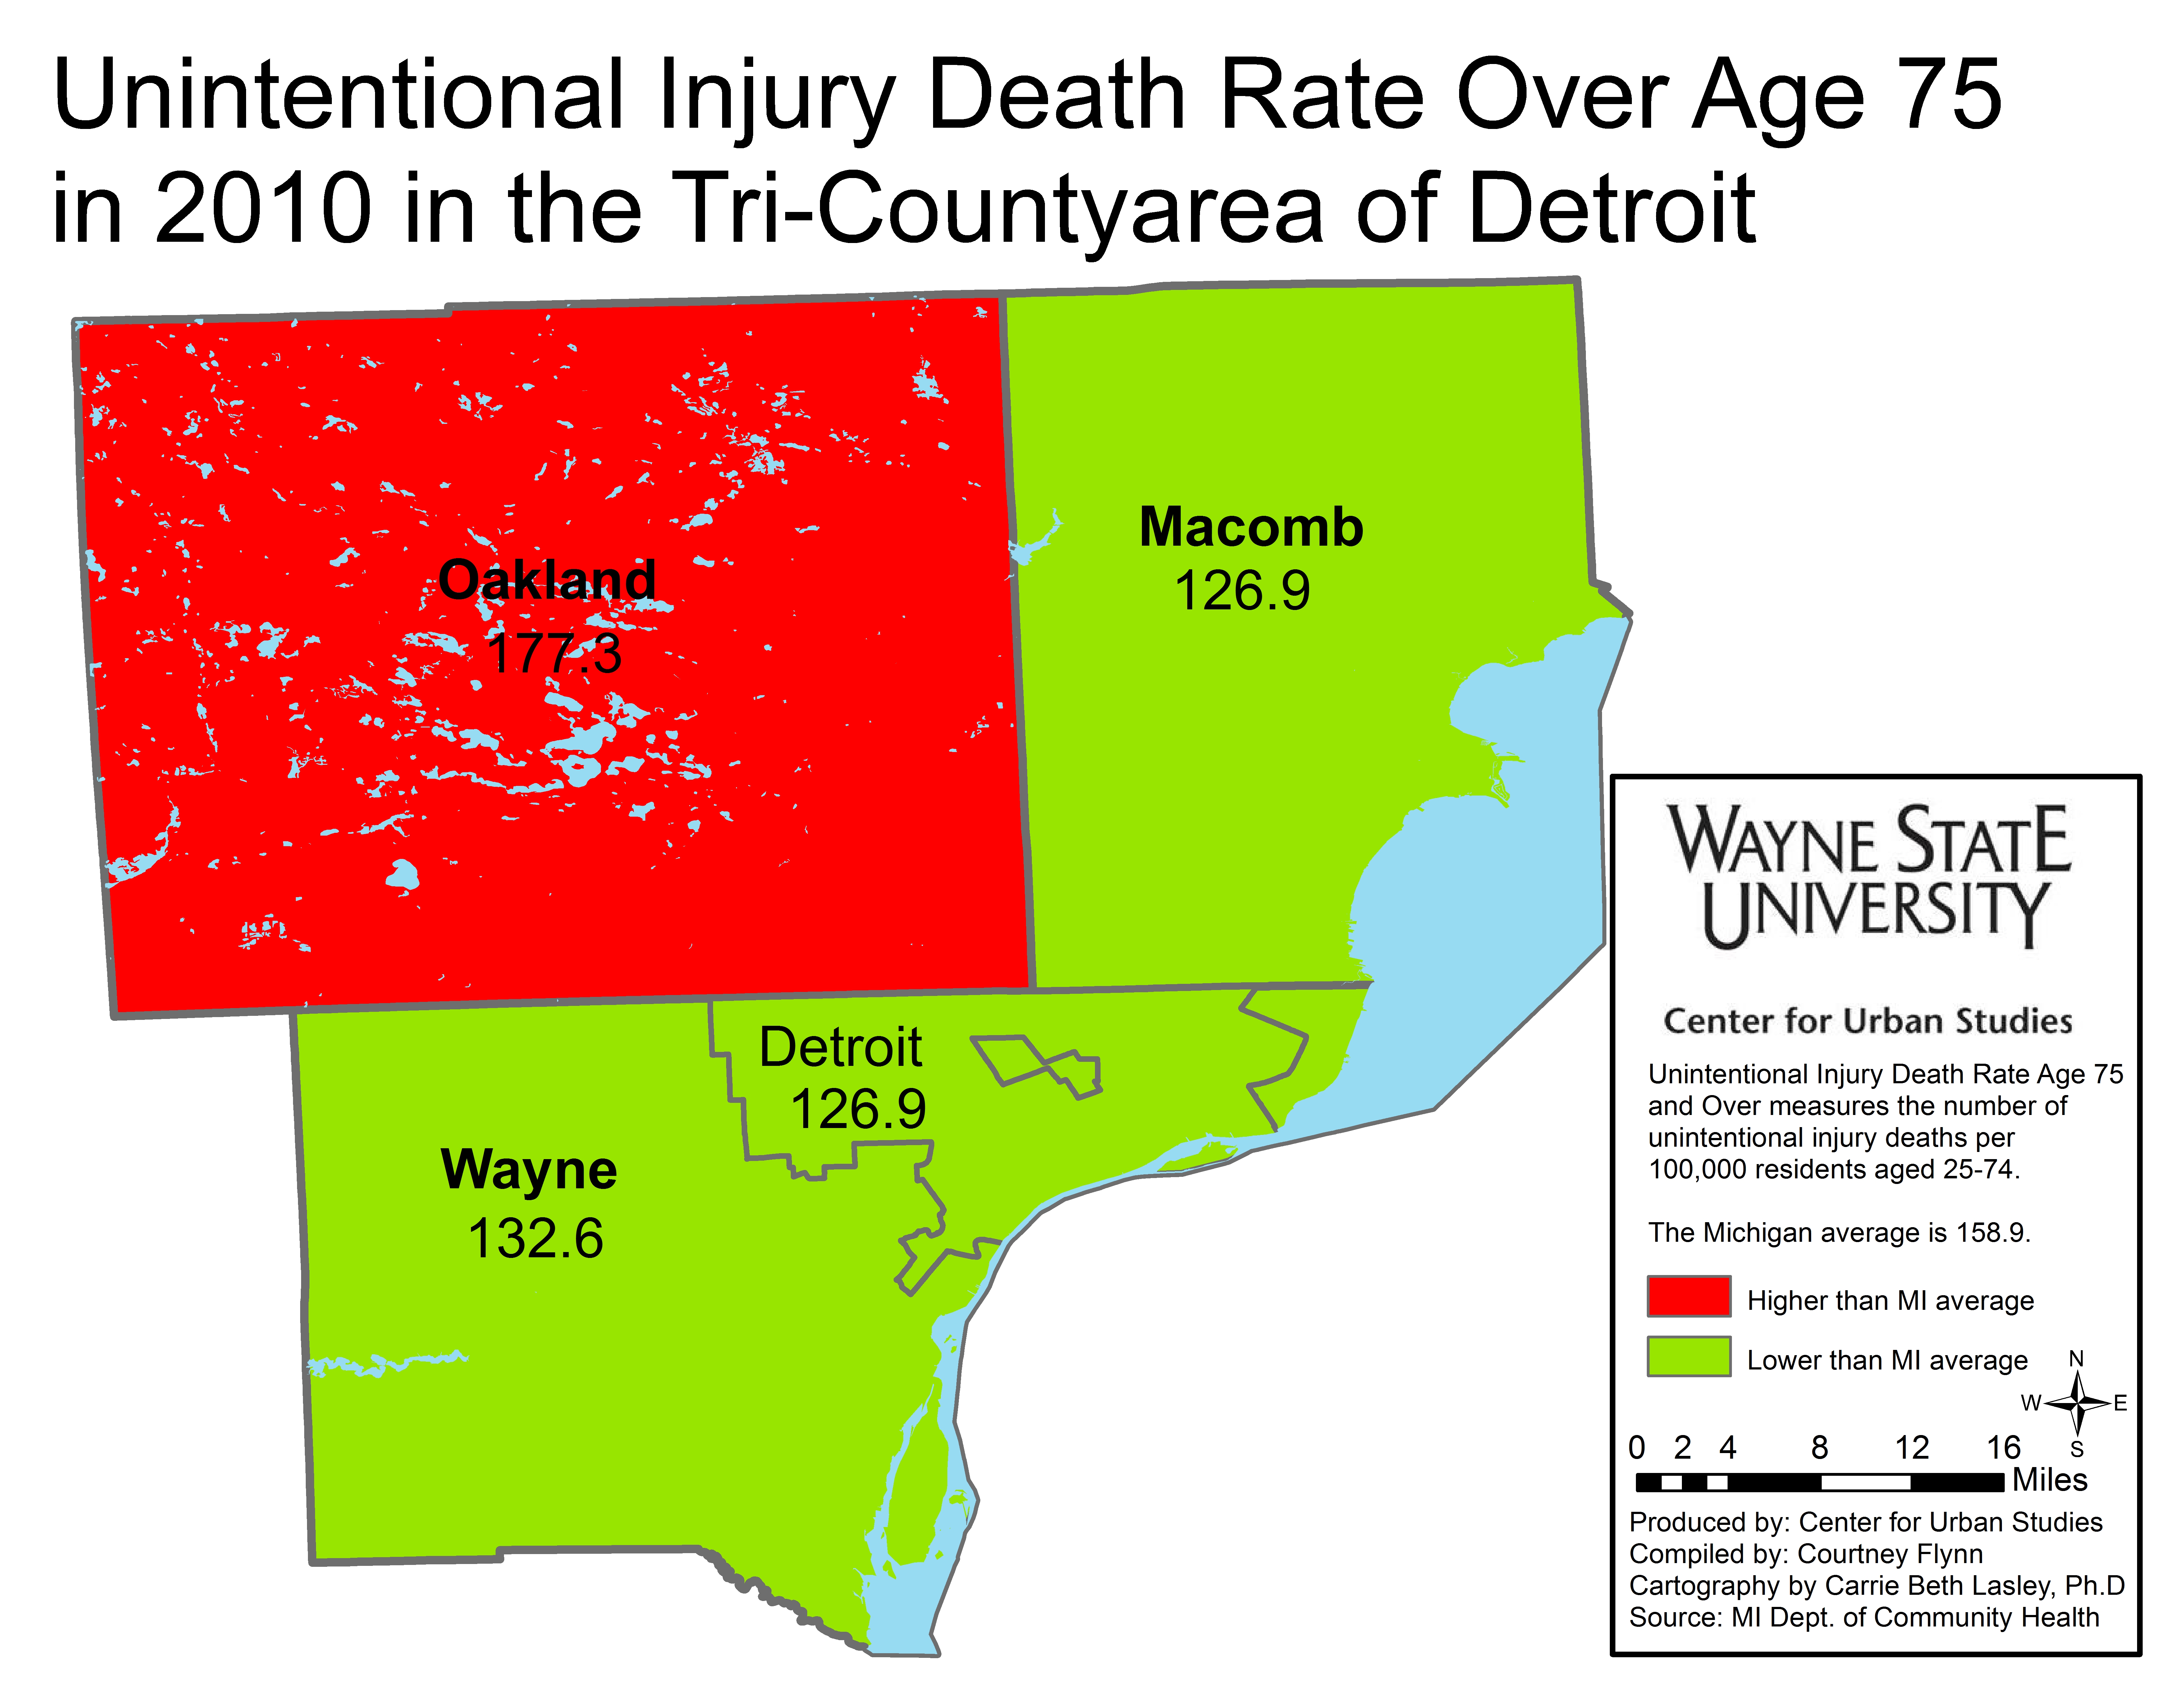
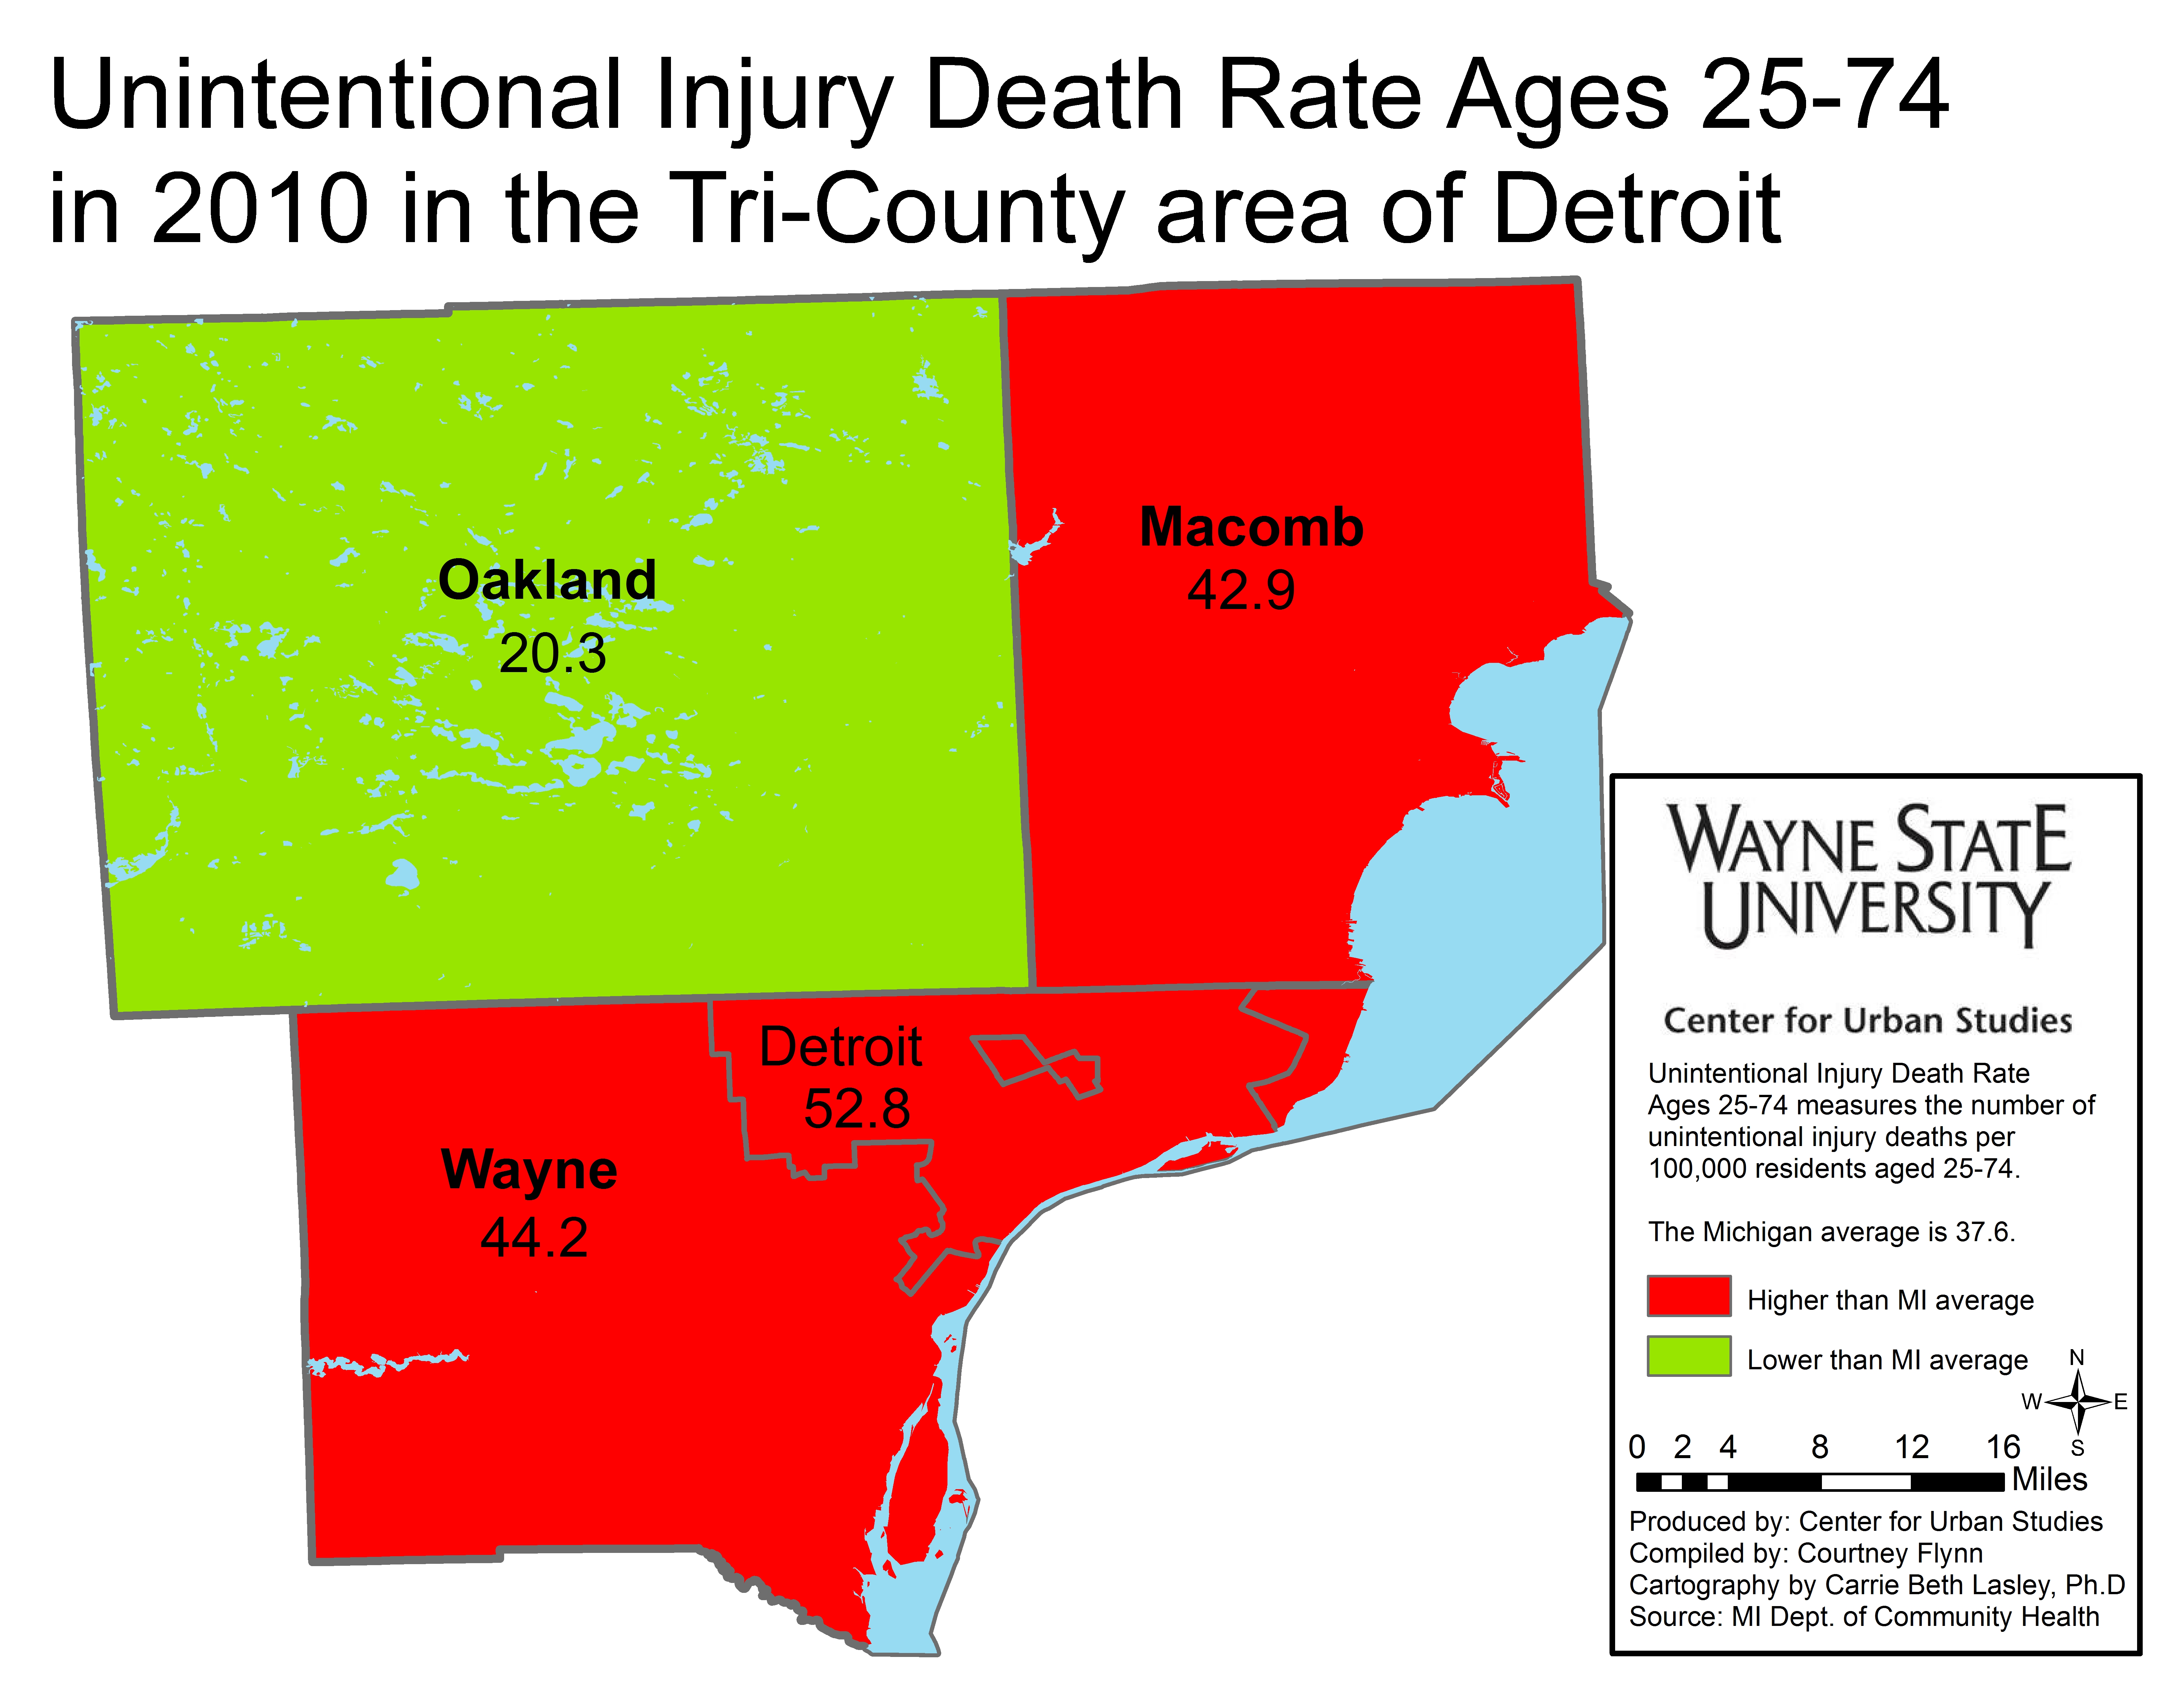
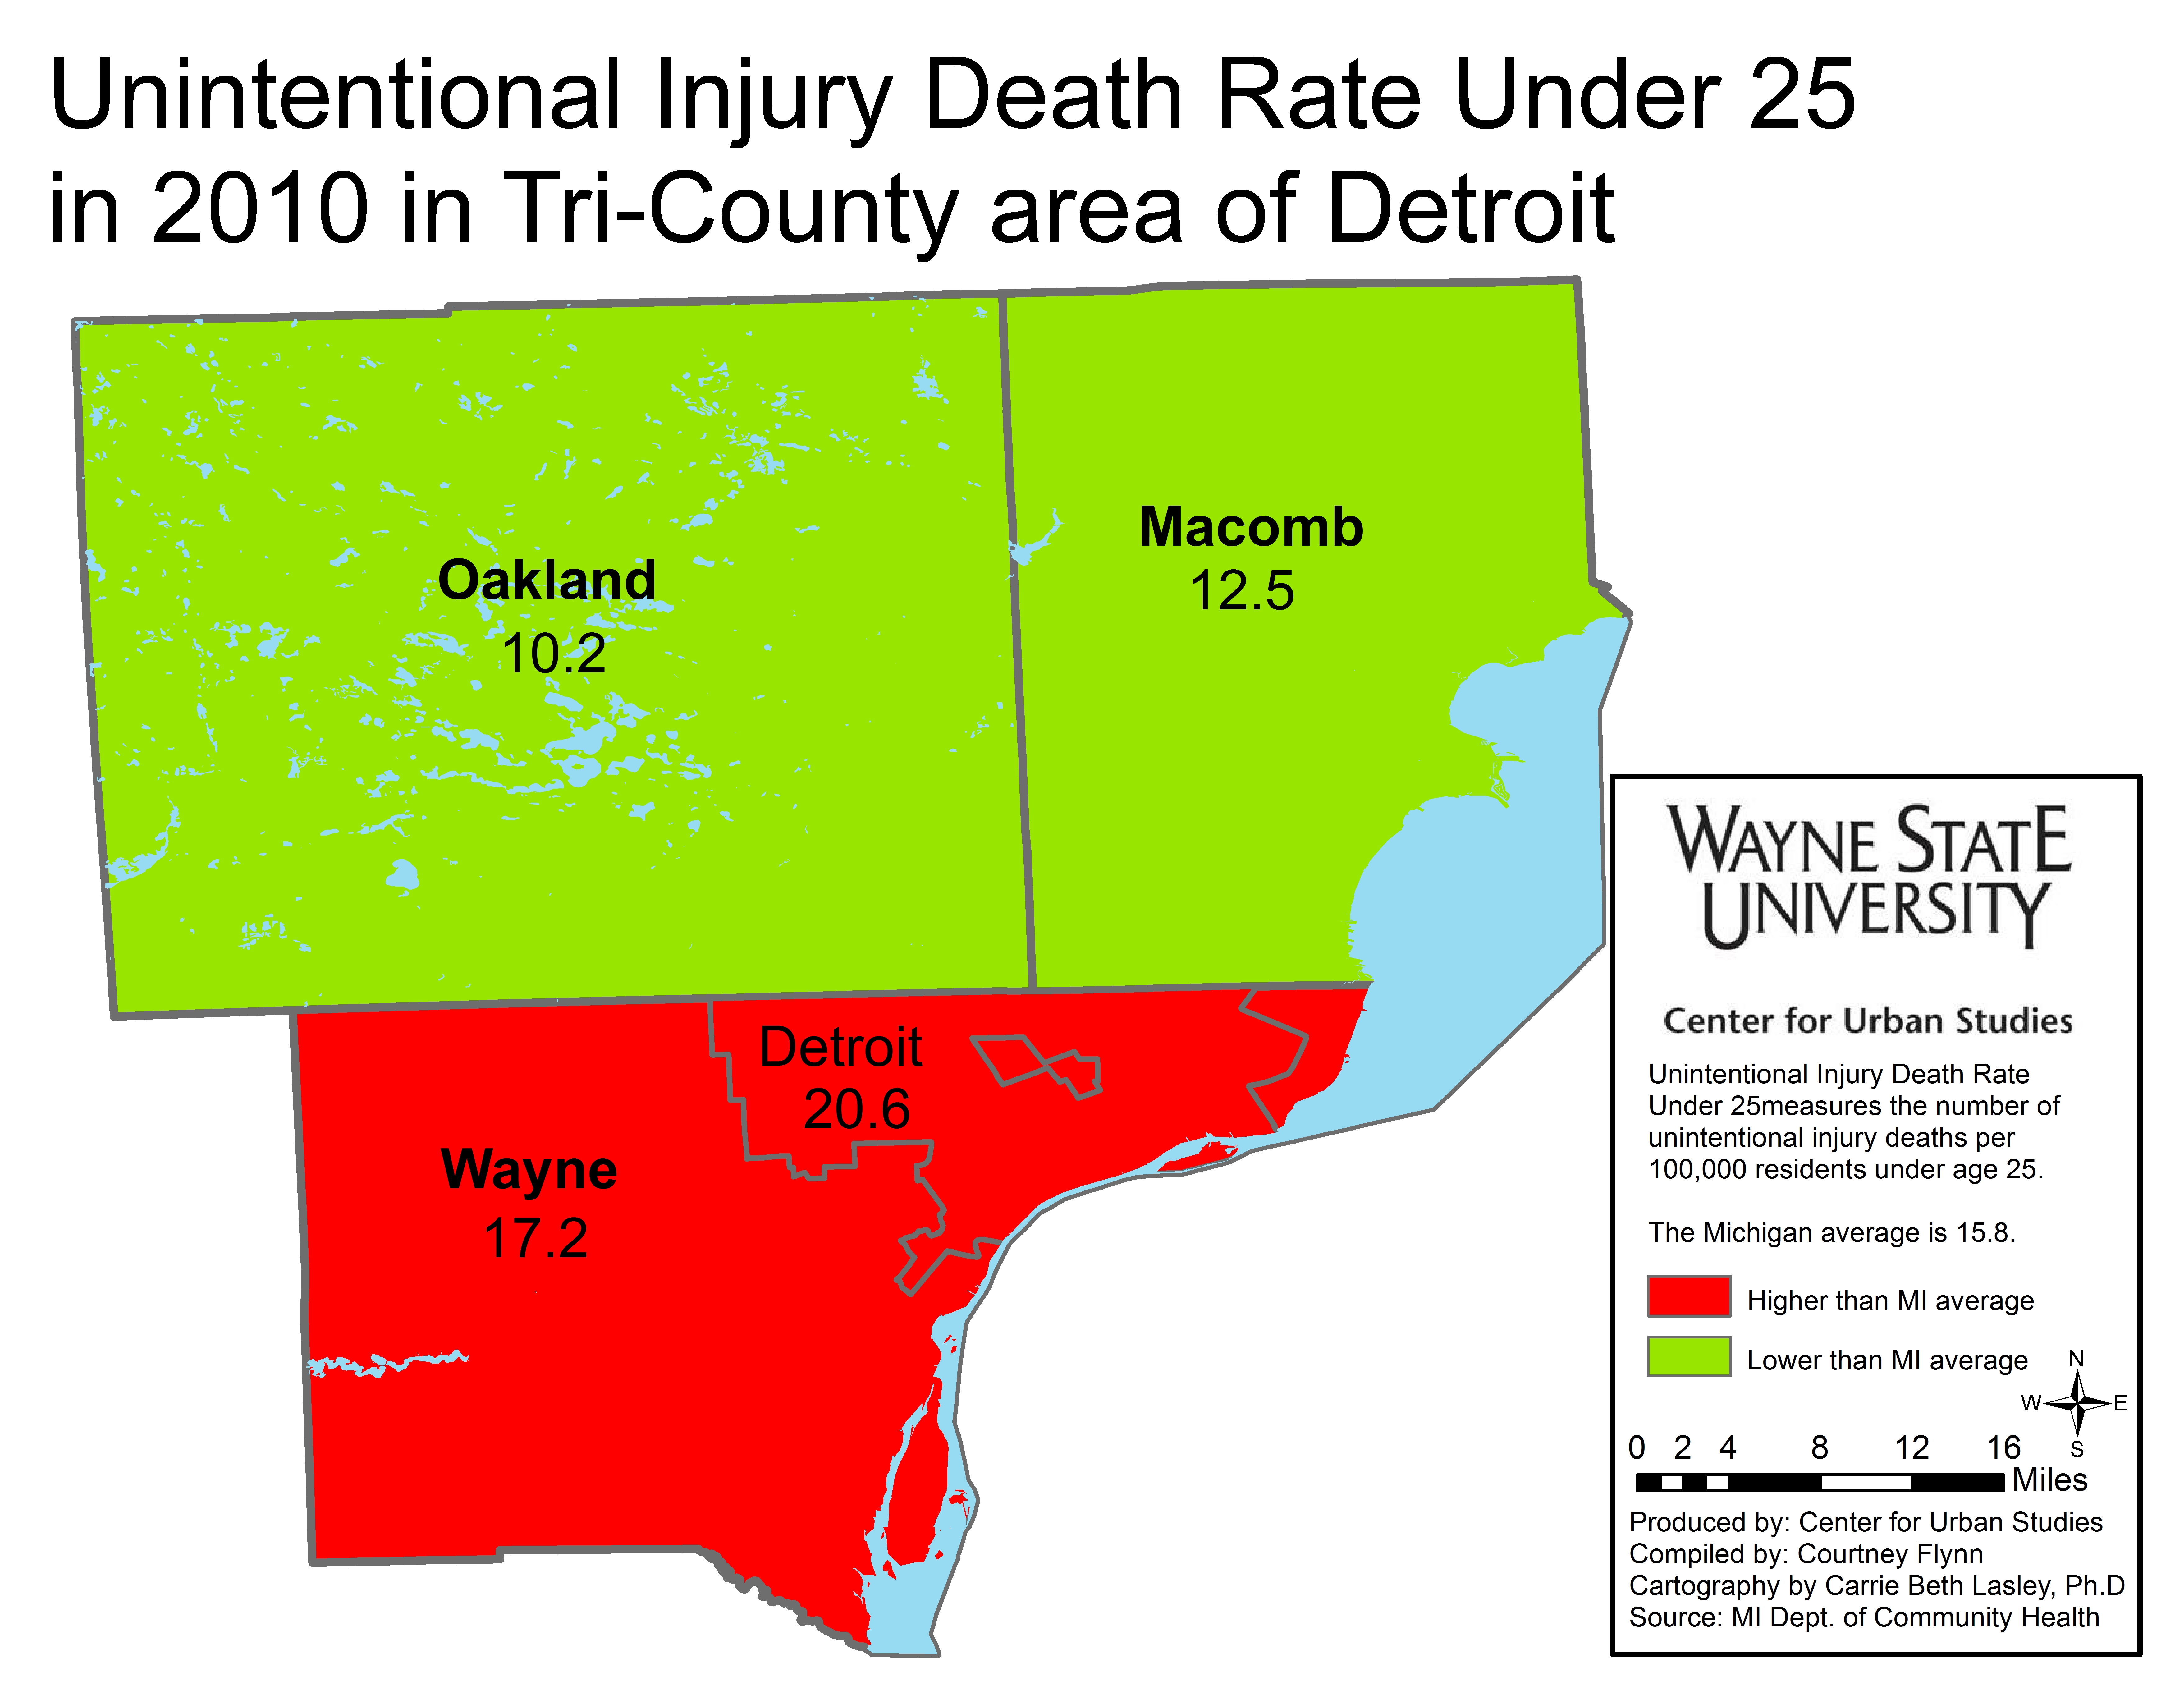
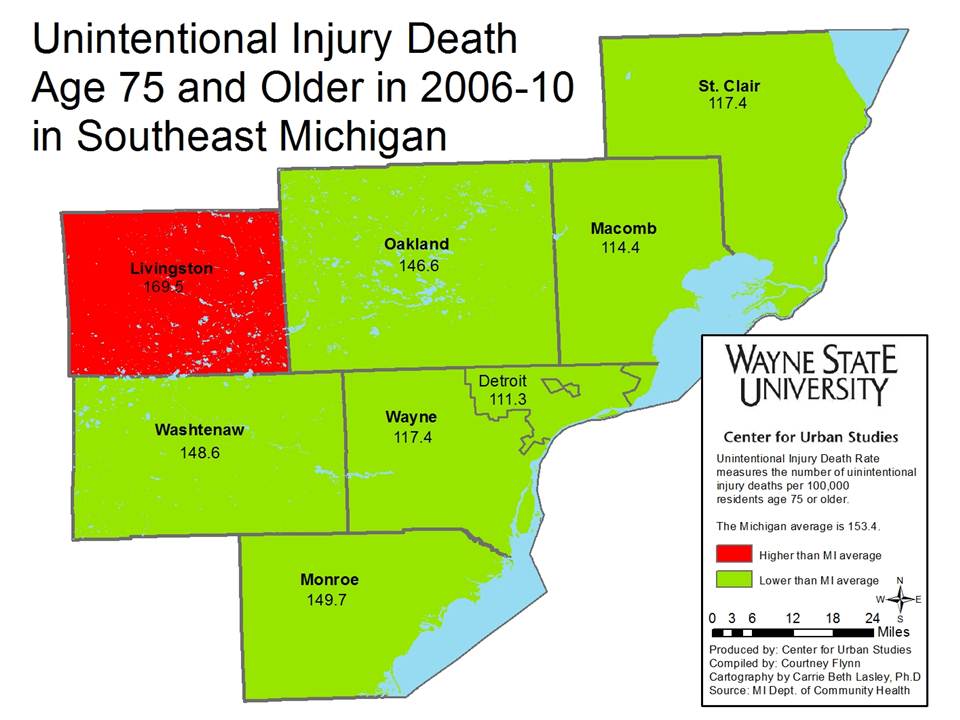
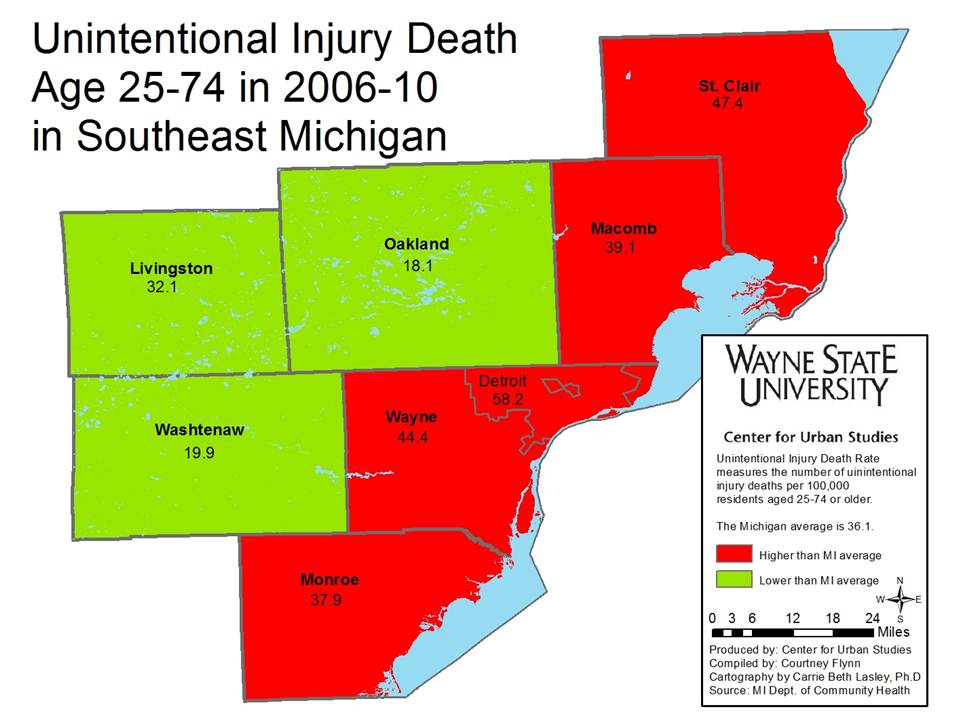
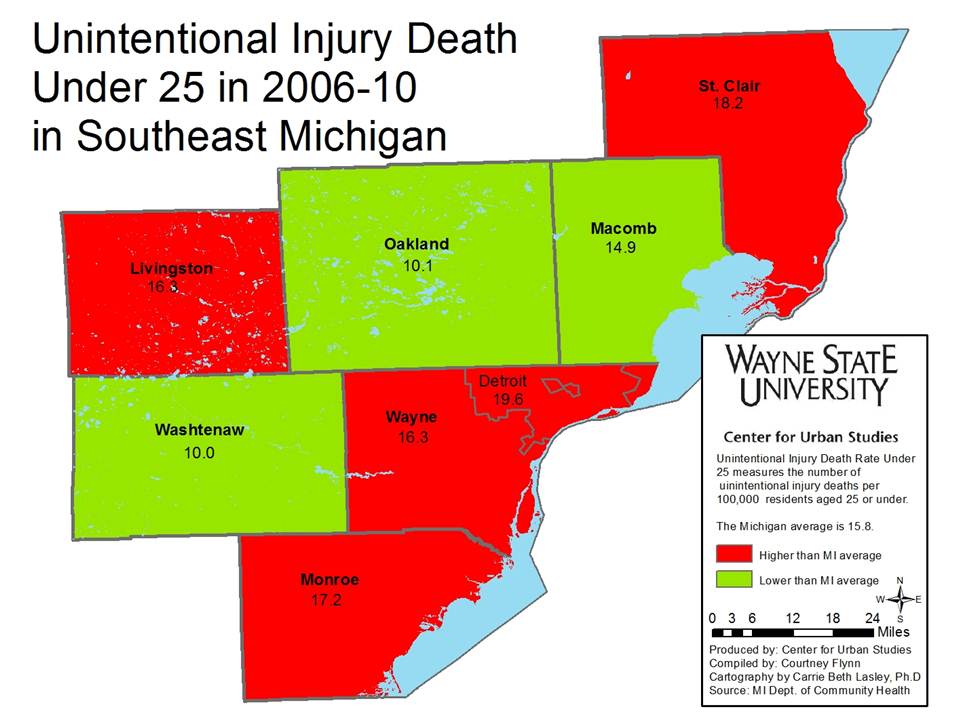
According to the Center for Disease Control, unintentional injuries are unplanned injuries that occur suddenly; they are typically associated with crashes, falls, fires, burns, drowning, poisoning, and aspirations. The death rate associated with unintentional injuries was highest for those 75 and older, although rates for the seven-county region have fluctuated across time.
With the exception of unintentional injury related deaths for those 75 and older, Detroit’s mortality rate for this category was higher than the state average and all the counties in the region. In the six maps above, Washtenaw County was the only county to remain under the state average for unintentional injury related deaths for the various age groups and averages presented.
To learn more how these numbers have changed over time please view our previous post here.
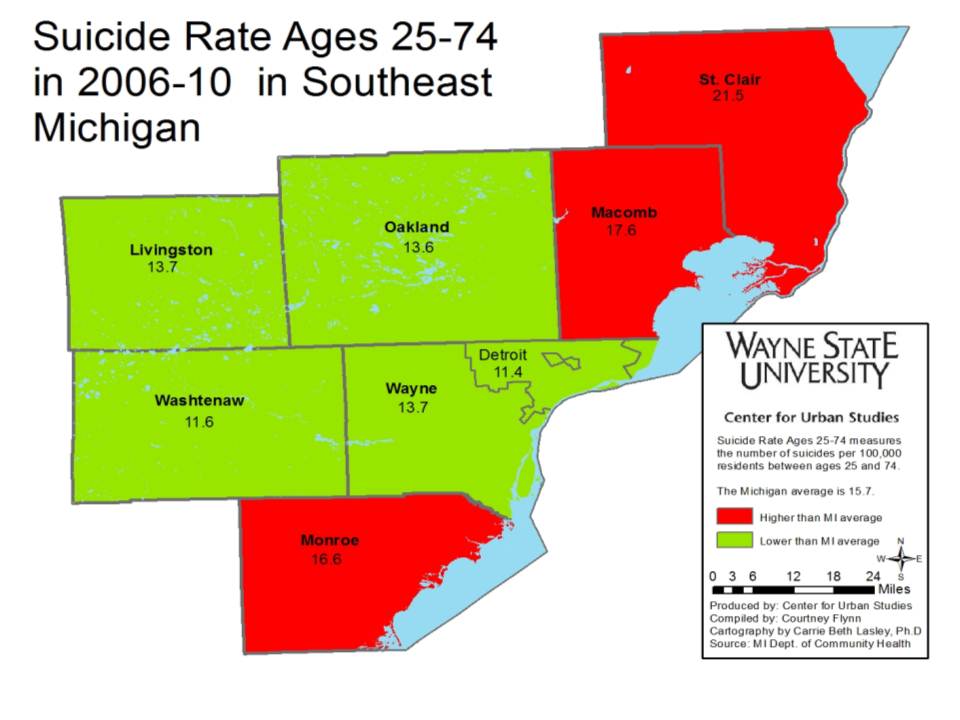
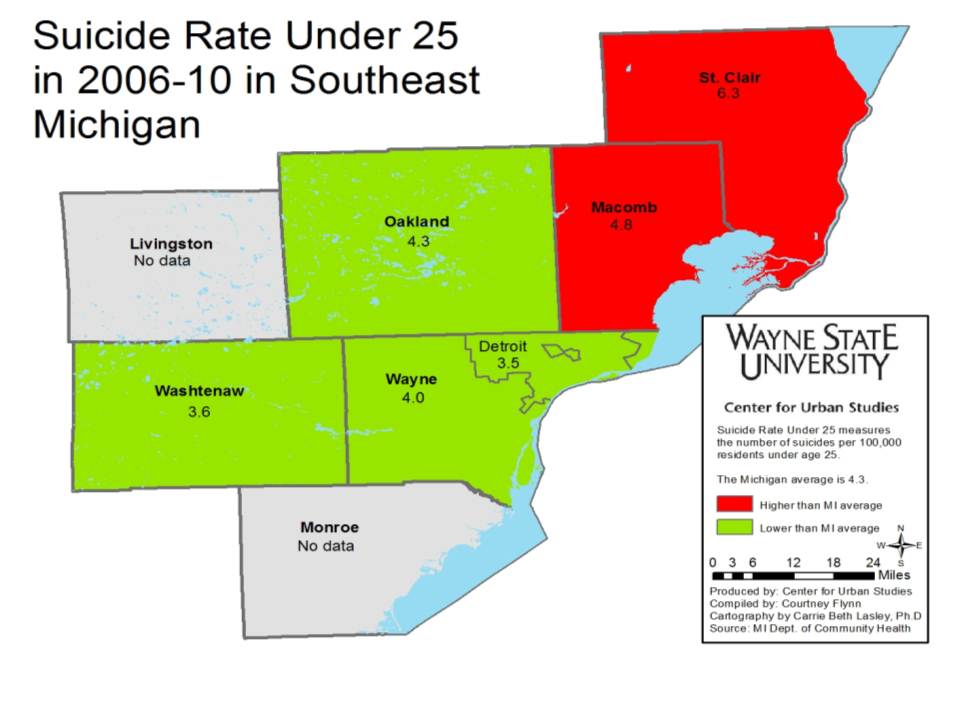
In Southeastern Michigan, St. Clair County had the highest suicide rate per 100,000 residents for those between 25-74 years old, peaking at 21.5 for the 2006-10 time-frame. For those under 25, it was recorded at 6.3 for the 2006-2010 time-frame.
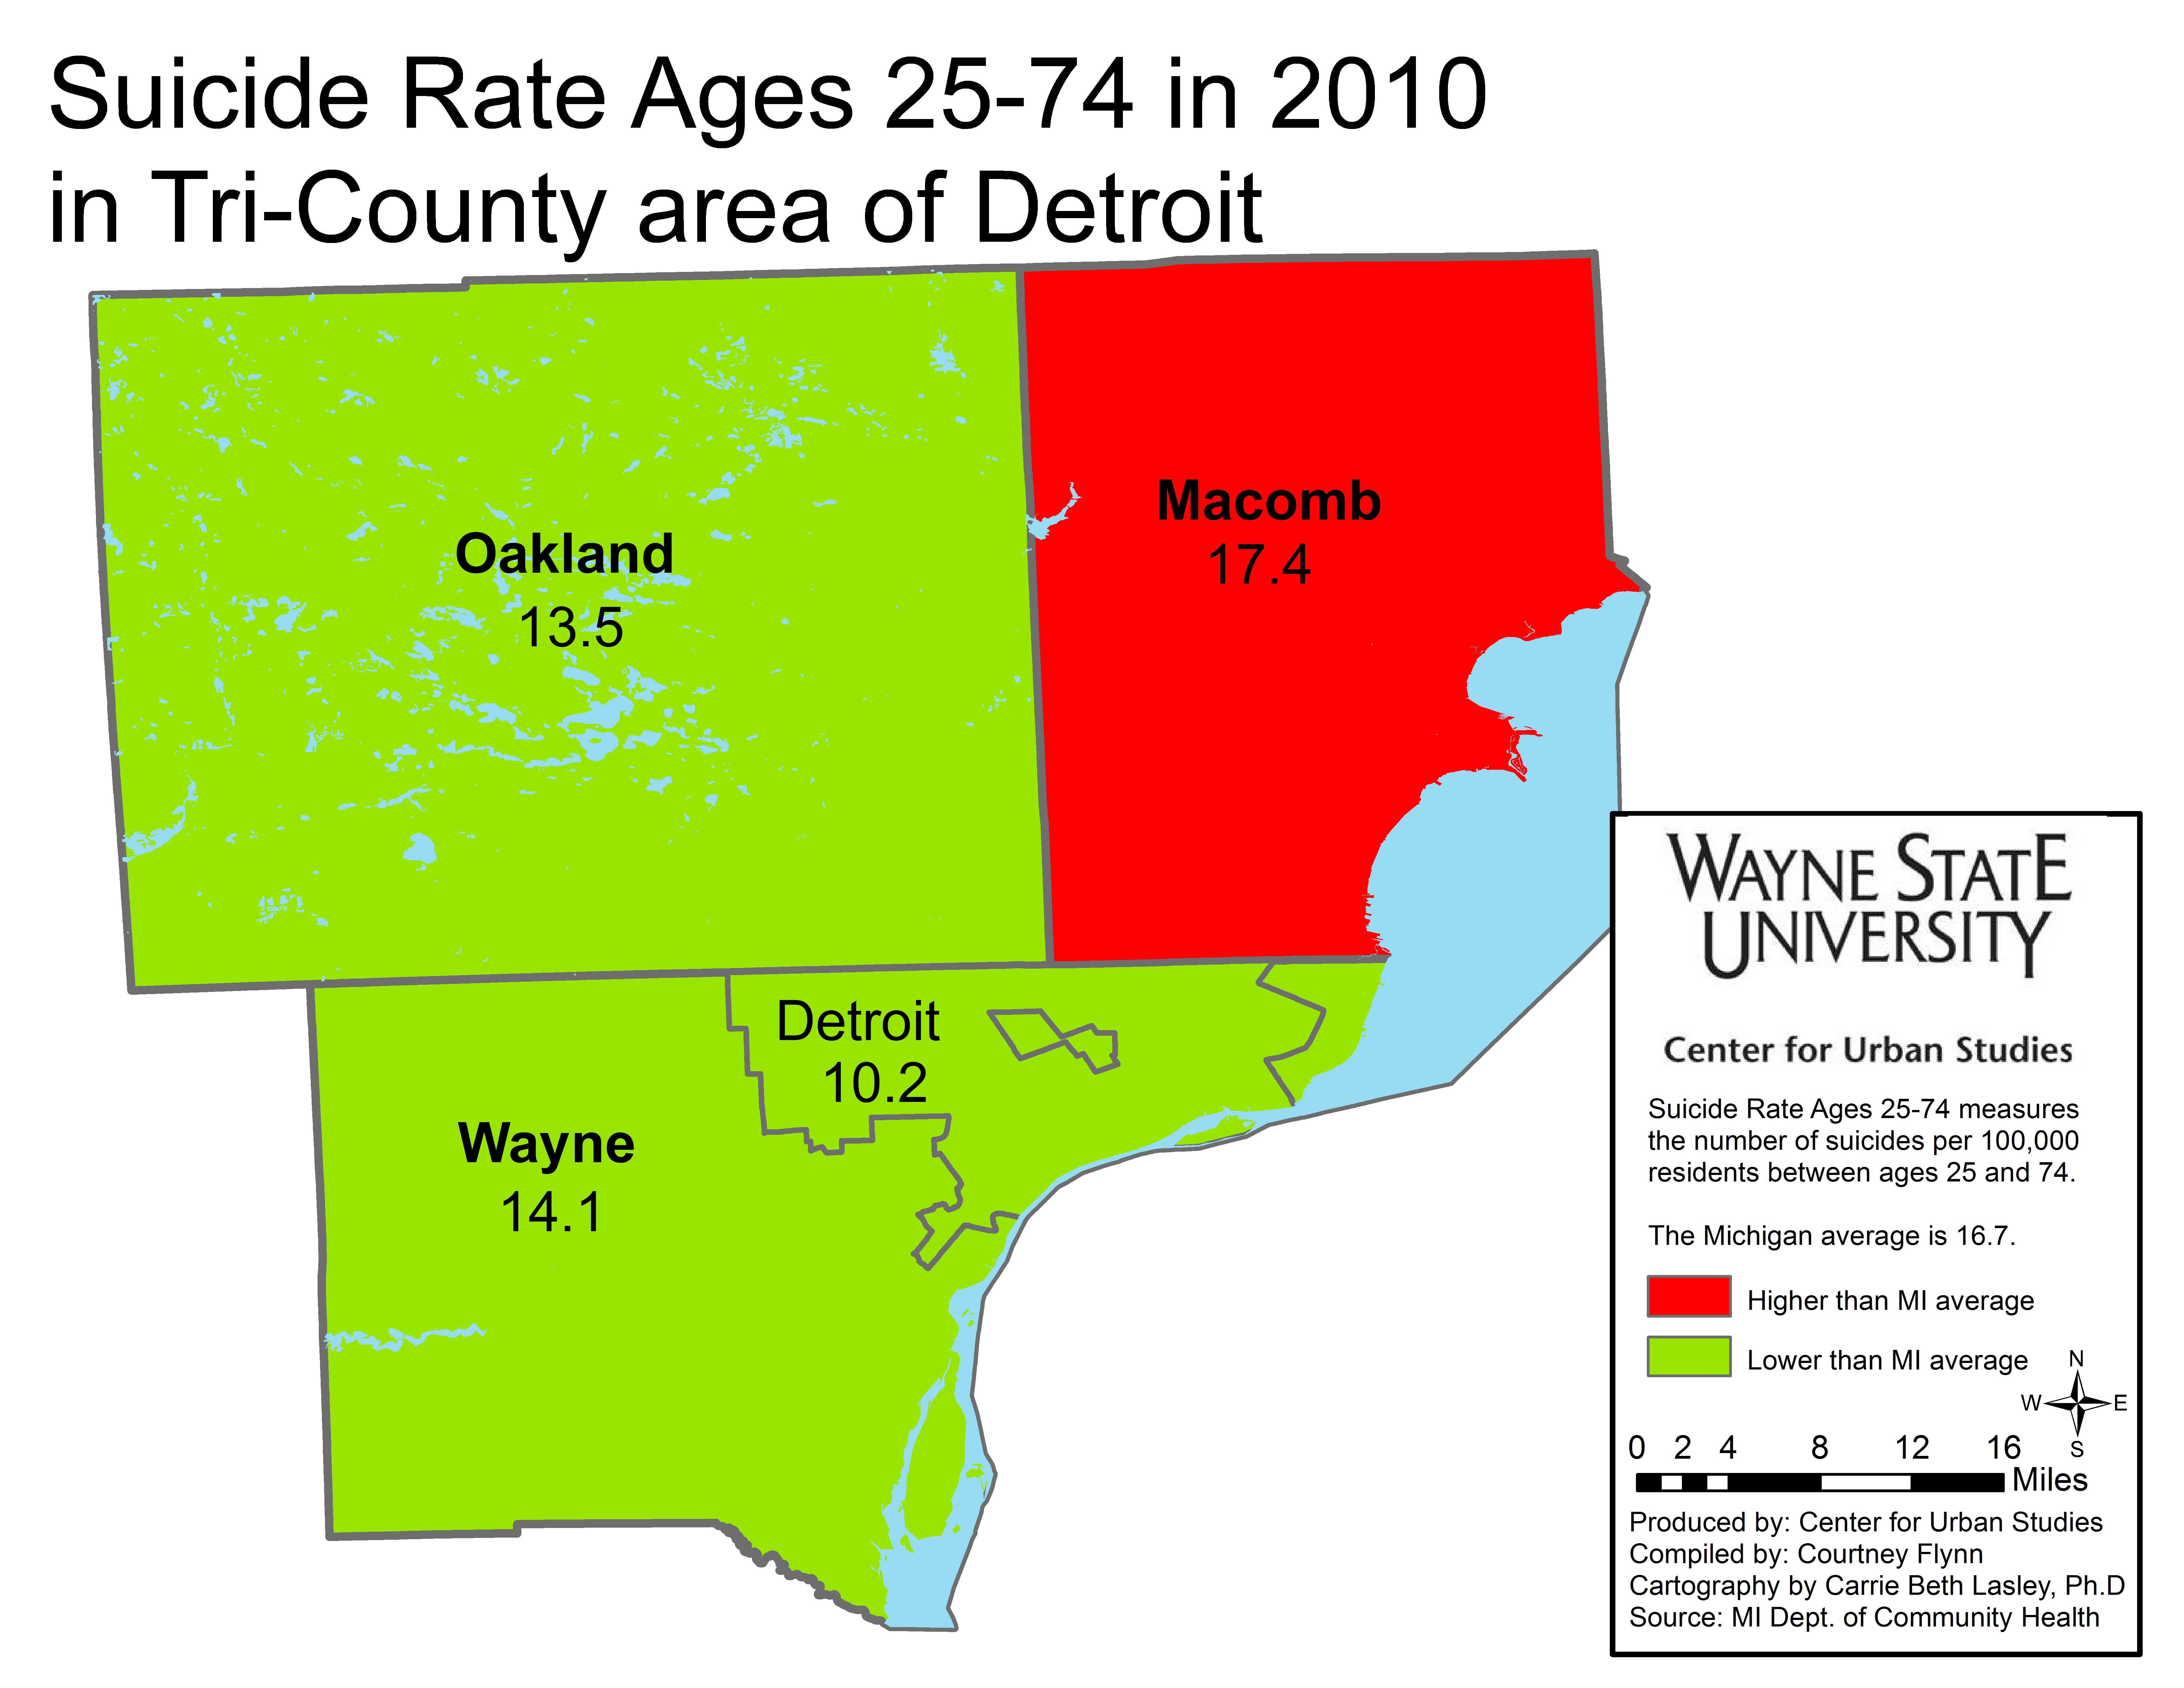
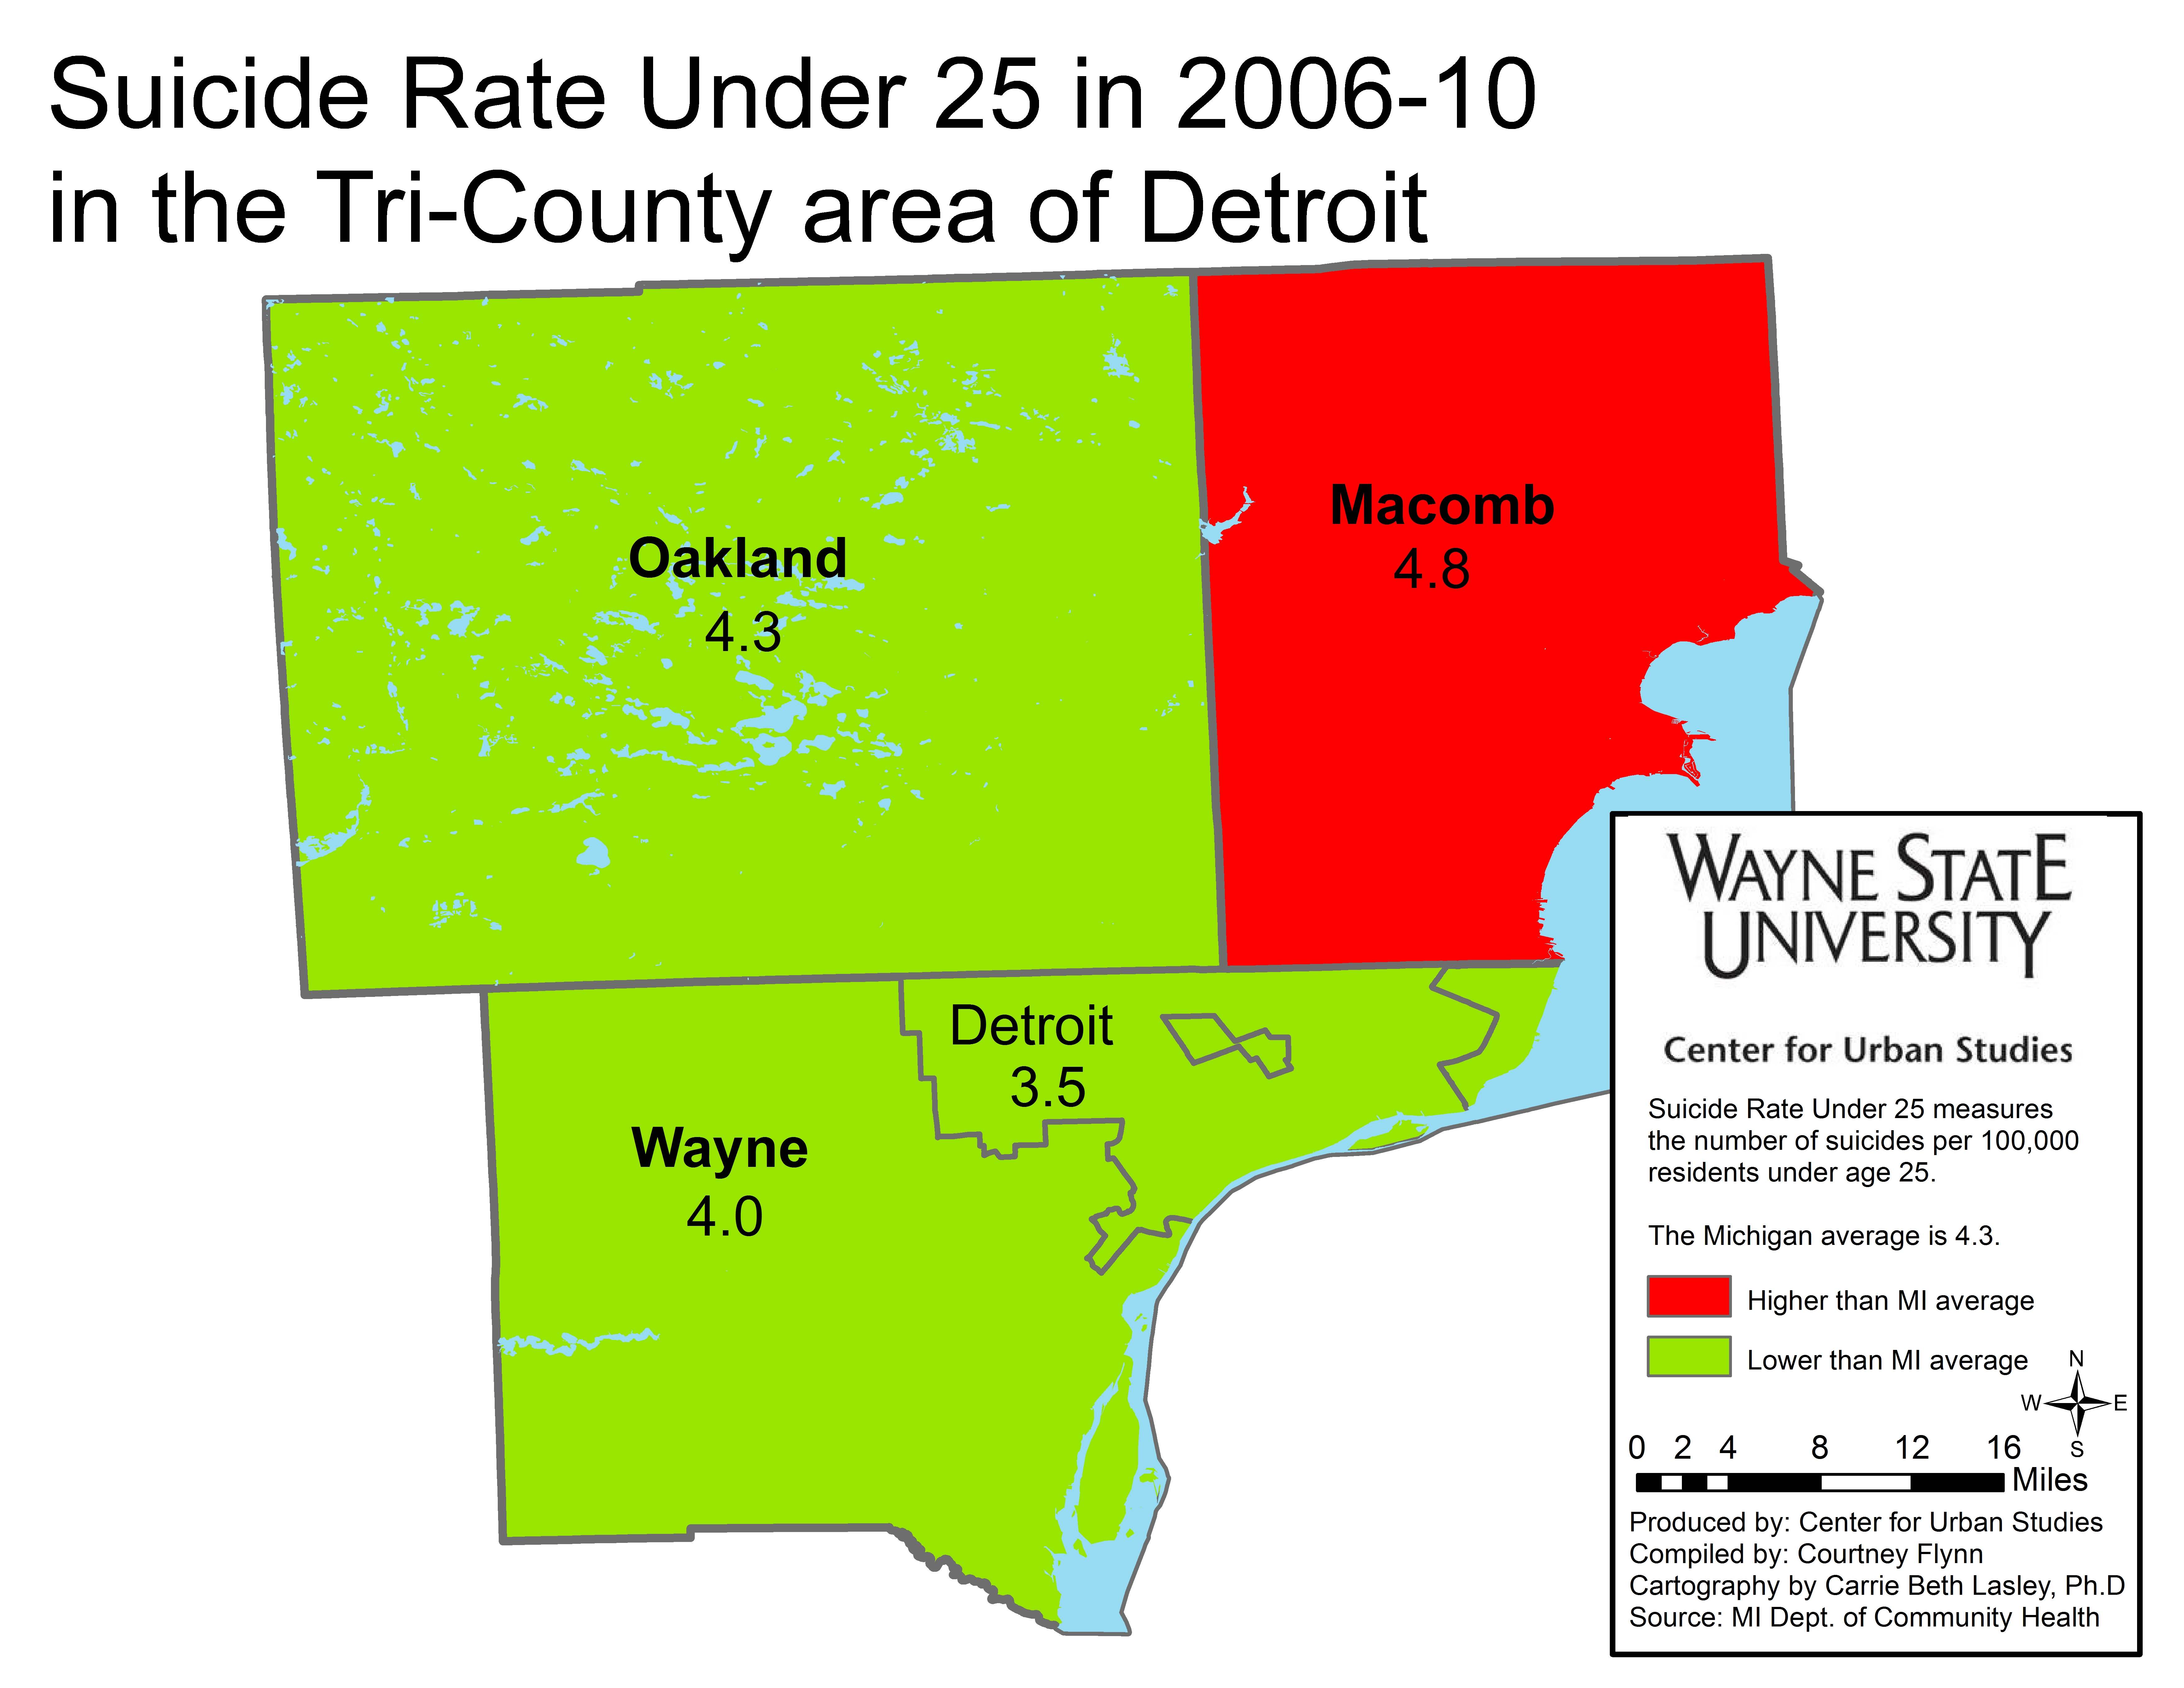
In the Metro-Detroit region (Wayne, Oakland, and Macomb counties), Macomb County had the highest suicide rate in 2010 for those under 25 and those 25-74; these rates, 6.8 and 17.4 respectively, were also above the state averages.
Information for Washtenaw and Livingston counties was not available for the 25-74 age group.
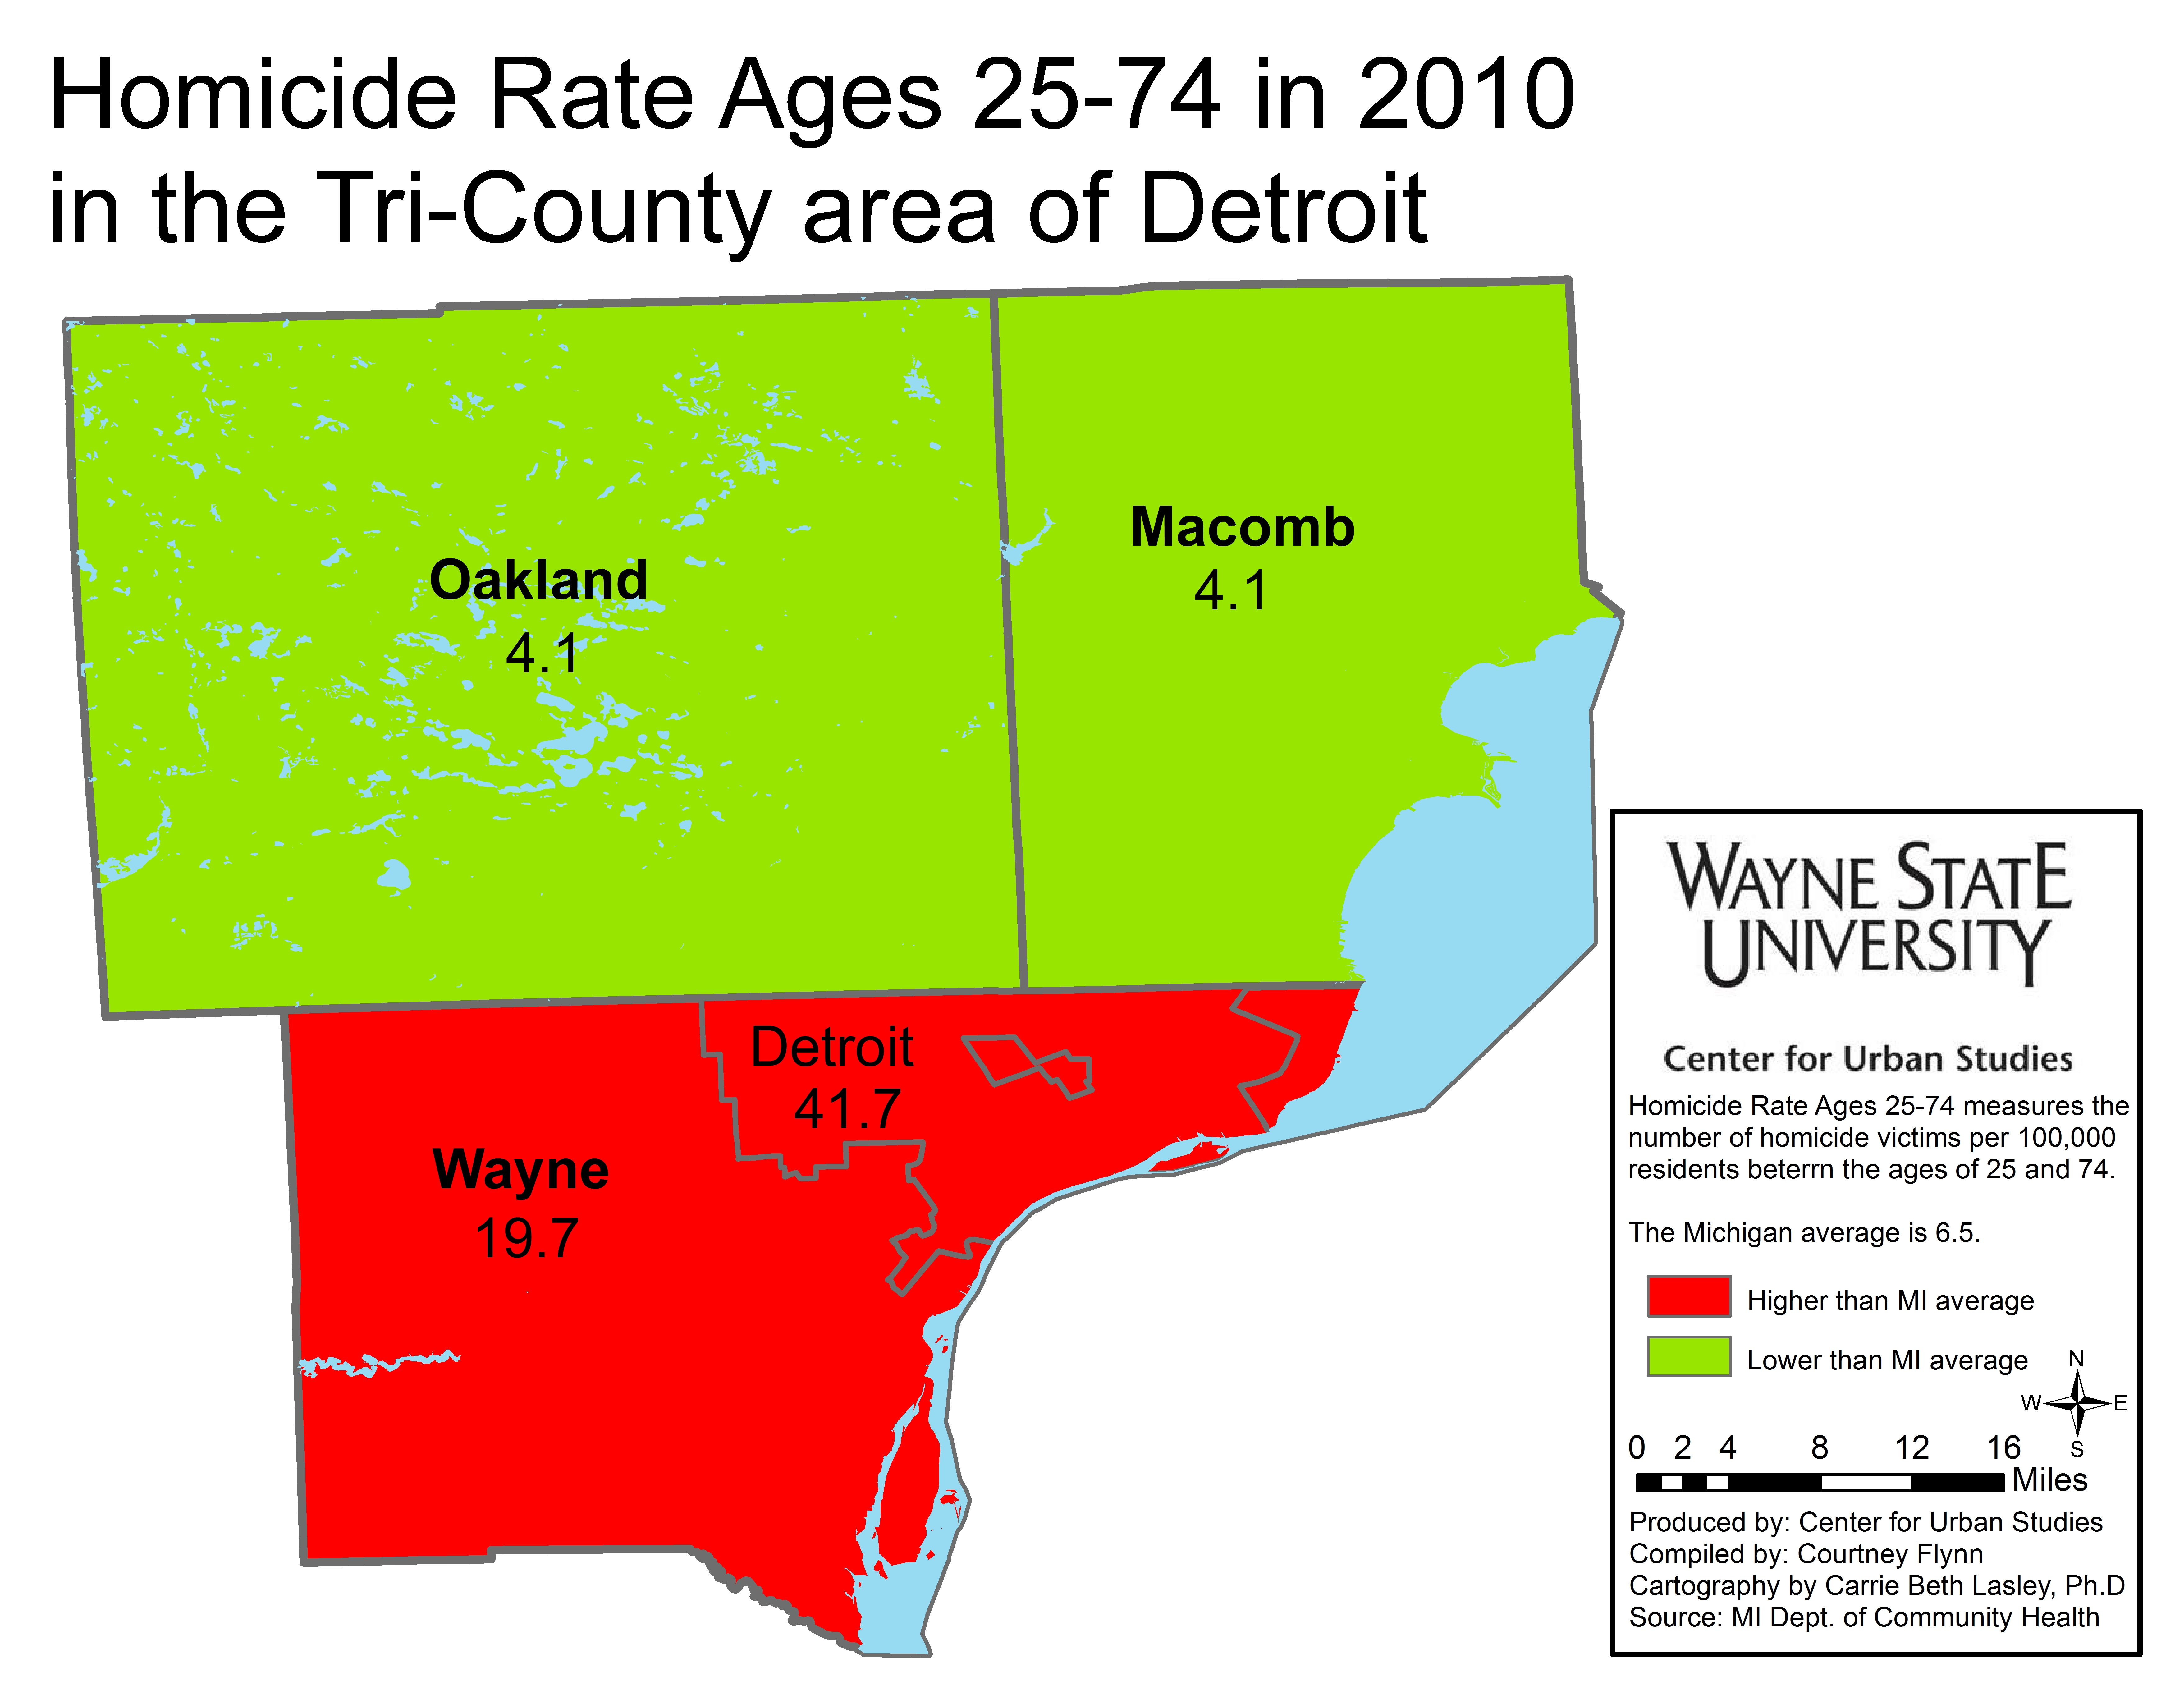

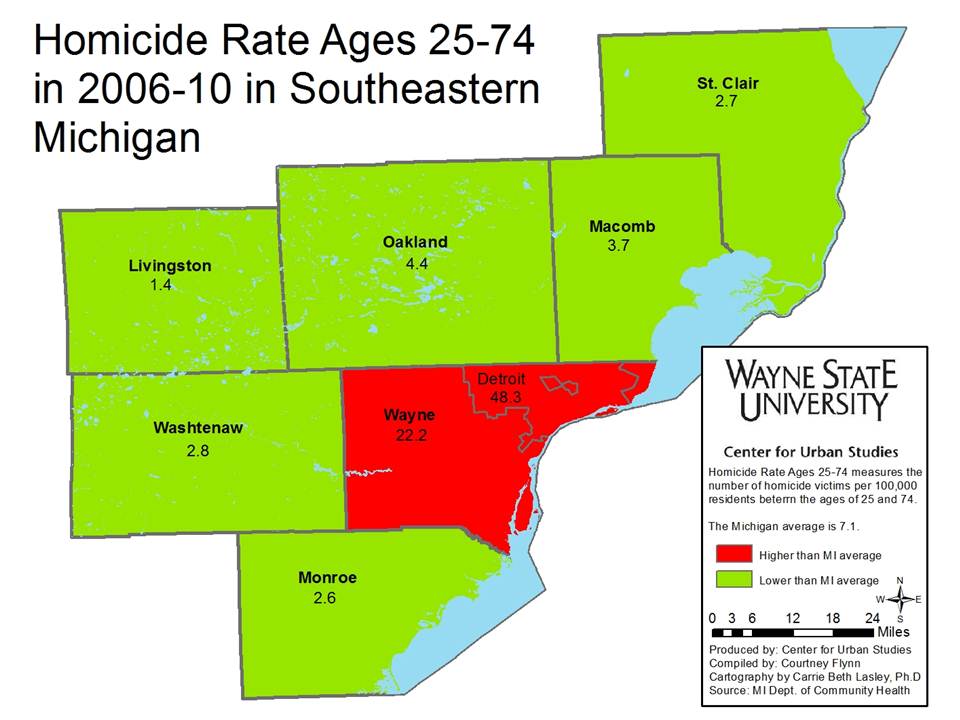
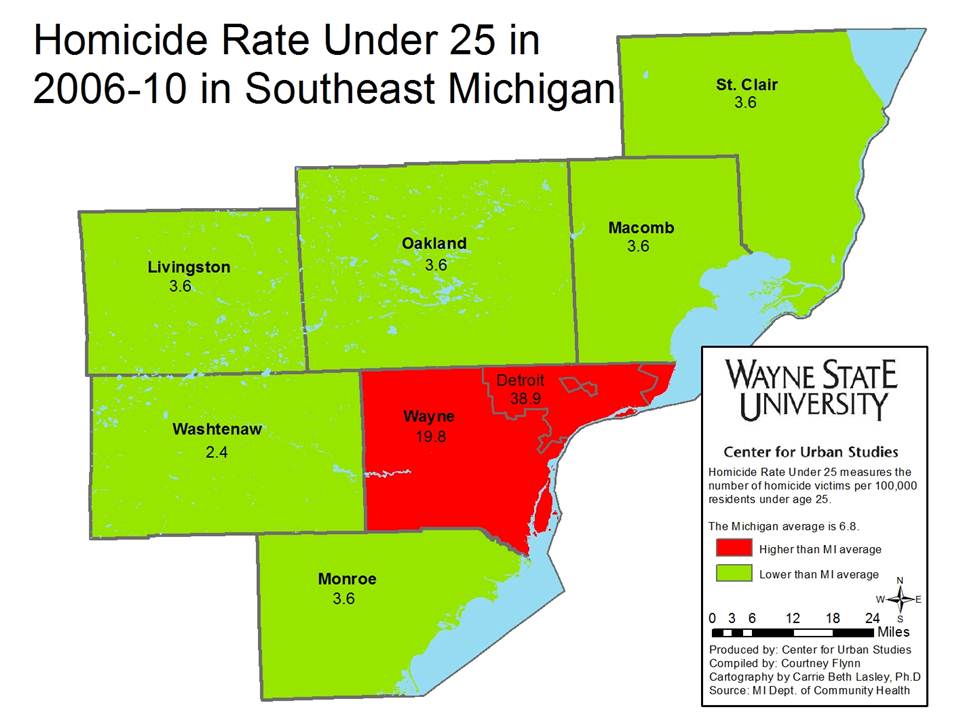
For all categories presented, Detroit had the highest homicide rates, according to the Michigan Department of Community Health. When looking at the 2006-2010 rolling averages, it was the highest for the 25-74 age group, per 1,000 residents. This rate was recorded at 48.3, and the Michigan average was recorded at 7.1. For just 2010 data, again, the 25-74 age group for Detroit had the highest homicide rate at 41.7; the state average was 6.1 per 1,000 residents.
To learn more about how homicide rates in the region have changed over time click here.
In a future post we will display maps showing the mortality rates related to specific health related deaths, such as cancer and Alzheimer’s disease.