According to the State of Michigan, the total number of COVID cases in Michigan rose to 55,104 on May 26, an increase of 223 cases from the previous day. This total was equivalent to 552 cases per 100,000 people (Chart 4). Of those 223 cases 141 were documented in Southeastern Michigan. This means that of the new daily COVID cases Southeastern Michigan accounted for 70 percent of them. This is the first time in over a week where most of the new COVID cases were concentrated in Southeastern Michigan, as opposed to other areas of the State. In Chart 1 we show that the State total for number of COVID cases on May 24 was 54,588. The five-day rolling average for the total number of COVID cases (Chart 1) reflects a smoother curve and adjusts for fluctuations in testing and/or the quality of reporting or failure to report.
Chart 2 shows that, based on the five-day rolling averages, the growth of new COVID cases in Southeastern Michigan continued to level off for the counties in the region, despite most of yesterday’s growth being concentrated in the region. On May 24 the number of cases in Detroit reached 10,695, the highest in the region, and Wayne County reported the second highest number of cases at 9,067. On May 24, the five-day rolling average for the number of COVID cases in Oakland County was 8,201, and Macomb County reported 6,494.
The City of Detroit had 1,608 COVID cases per 100,000 people on May 26, an increase from 1,595 the day before (Chart 3). This is based upon a reported increase of 91 new COVID cases, bringing the total number of COVID cases in Detroit to 10,818. Wayne County reported 846 cases per 100,000 people, and Oakland County had 655 cases per 100,000 people. These per capita rates were based upon 9,108 total cases for Wayne and 8,240 for Oakland. Macomb County reported 747 cases per 100,000 people, which is based upon 6,528 cases. With the exception of Detroit, all other entities only experienced minimal increases.
The daily data highlighted in these posts is from Michigan.gov/coronavirus, where data is updated daily at 3 p.m. Historical data were supplied from covidtracking.com, which republishes COVID data from the State. Additionally, the case totals do not reflect the number of people who have recovered, just those who have been infected.
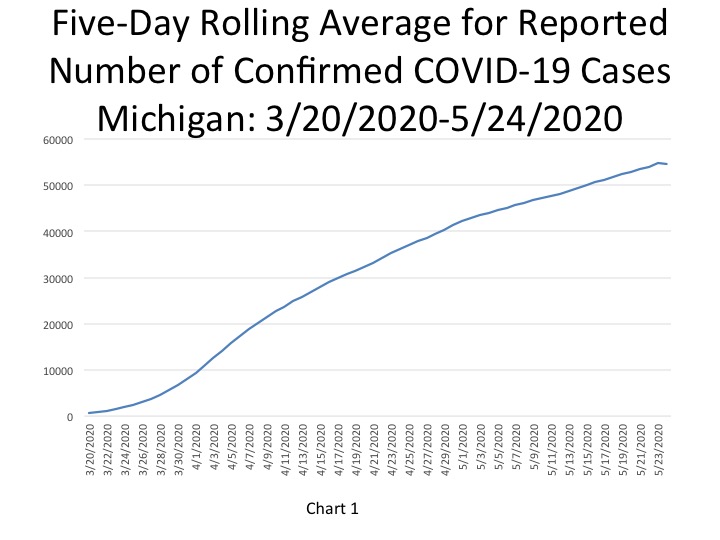
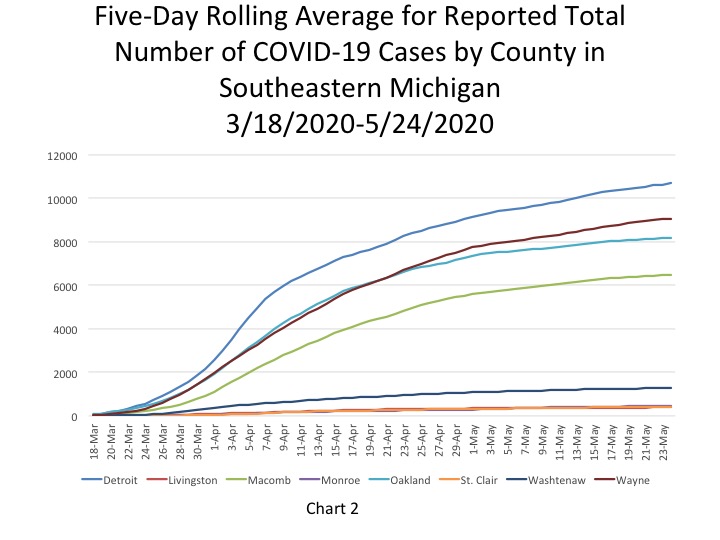
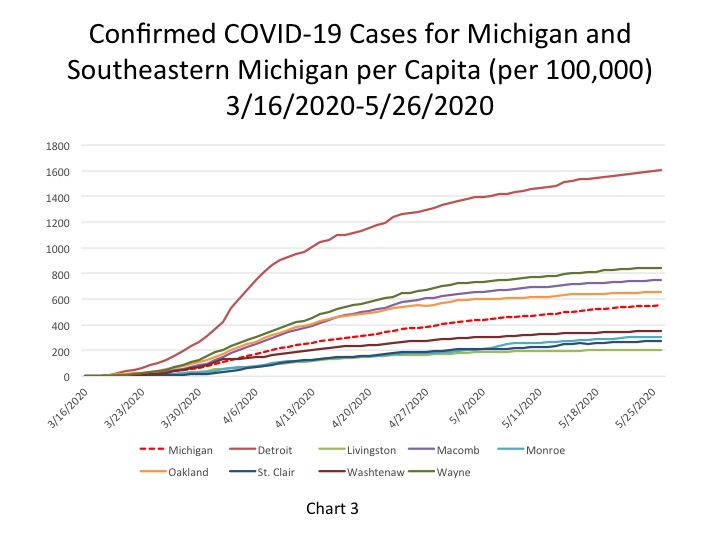
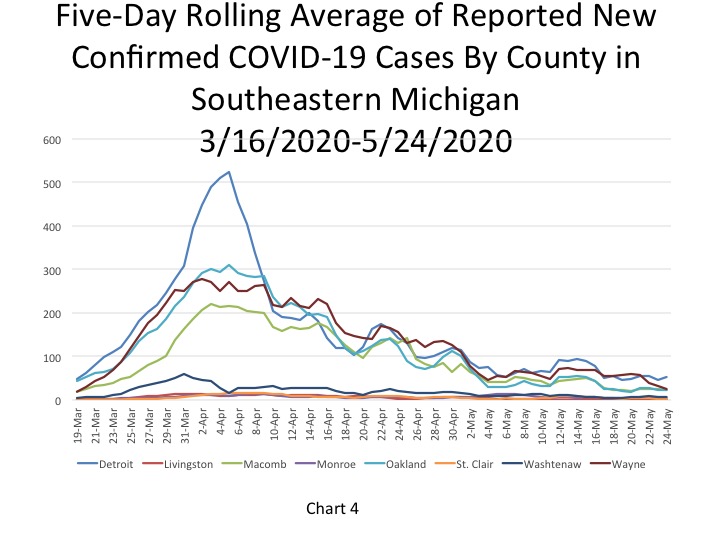
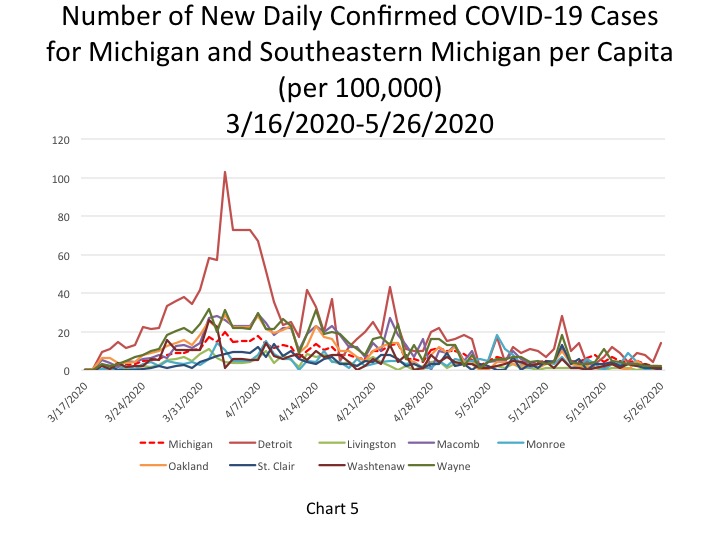
Chart 4 shows that Detroit reported the highest number of daily cases at 52 on May 24, a increase of 6 from the day prior. While Detroit experienced a small increase the counties in the region either remained flat or experienced a small decrease.
On May 26 the per capita rate for the number of new daily COVID cases per 100,000 people was 2 for the State. The per capita rate was equivalent to 223 new cases. While the State’s per capita rate remained the same, the City of Detroit’s increased from 4 new COVID cases per 100,000 people on May 25 to a rate of 14 on May 26. Detroit’s increased rate was equivalent to 91 new cases. Wayne County reported 2 new COVID cases per 100,000 people for the third day in a row, which was equivalent to 19 new cases. Oakland County reported a per capita rate of 1 new case per 100,000 people on May 26, which was equivalent to 14 new cases, and Macomb County reported a rate of 1, which was also equivalent to 12 new cases. Overall, 141 new COVID cases were reported in Southeastern Michigan on May 26. This is an increase of 61 from the day prior.
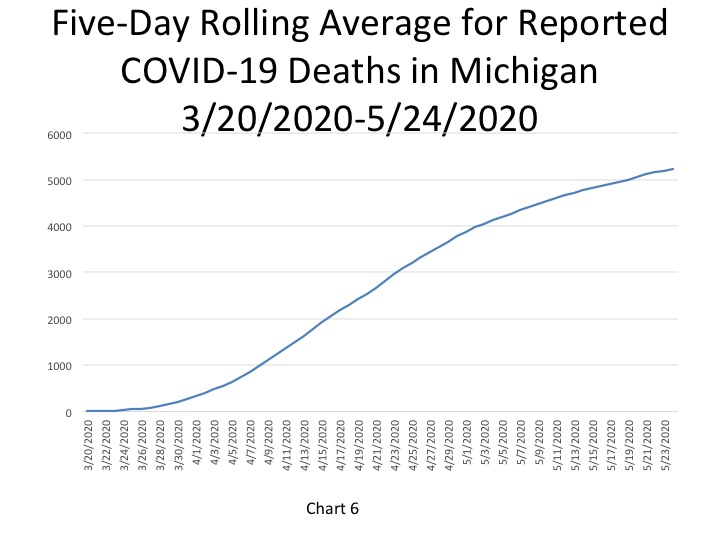
In Chart 6, the five-day rolling average for the number of deaths in Michigan shows a continuing slow increase (a lagged number of 5,223 deaths, an increase of 27 deaths). The actual reported COVID-19 on May 26 was 5,266, an increase of 26 deaths from the day prior. Of those 26 additional deaths Southeastern Michigan accounted for 9 of them. While Southeastern Michigan accounted for most of the new cases on May 26, the region did not account for majority of the additional deaths in the State.
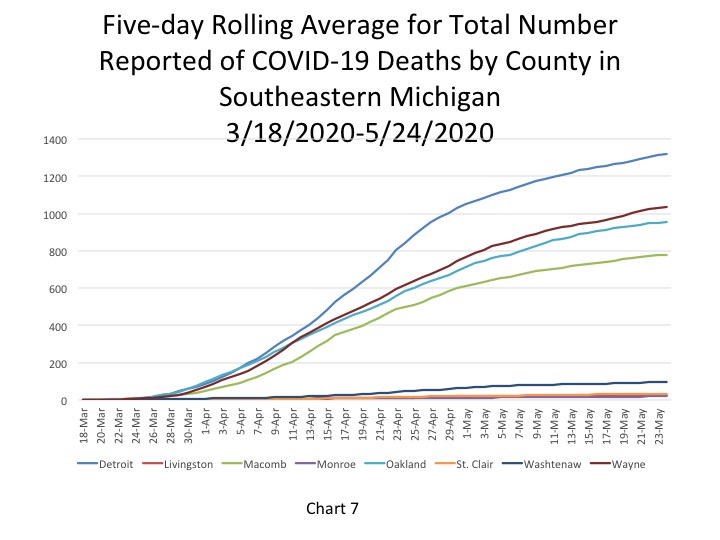
Chart 7 (a 5-day rolling average) portrays how the total number of COVID deaths in Southeastern Michigan continues to increase at a much slower rate, with Detroit reporting the highest cumulative number of deaths at 1,319 on May 24. Wayne County had the second highest total at 1,037 on May 24.
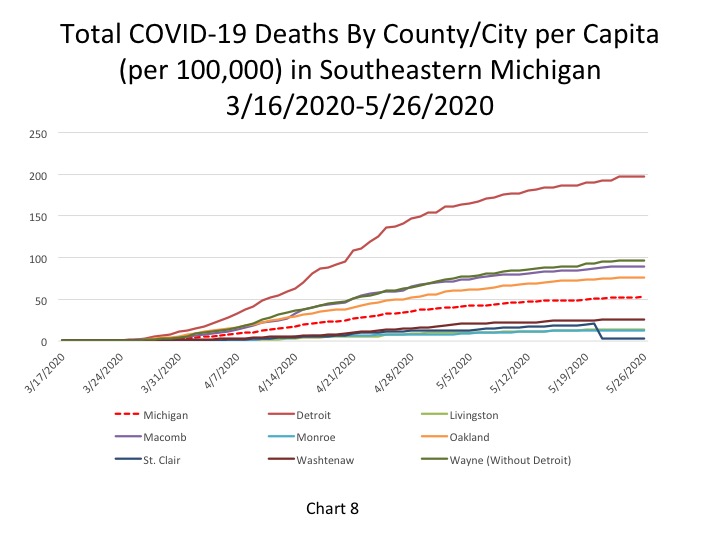
Chart 8 portrays the total number of COVID deaths per 100,000 people on May 26, and all the per capita rates in Southeastern Michigan and for the State remained the same as the previous day. For the entities in Southeastern Michigan this is the second or third day in a row the rates haven’t changed, showing that deaths are stabilizing and remaining at much lower numbers than a few weeks ago. The State of Michigan had 52 COVID deaths per 100,000 people, which was equal to 5,266 total deaths. The State has reported a per capita rate of 52 deaths for five days in a row now. The cumulative total of COVID deaths per 100,000 people in Detroit was 197 (representing 1,326 deaths). In Wayne County there were 97 COVID deaths per 100,000 people (1,042 total deaths-no increase from the day prior). In Oakland County there were 76 deaths per 100,000 people (958 total deaths) and in Macomb County there were 89 COVID deaths per 100,000 people (779 total). Detroit had the highest single day death count in Southeastern Michigan on May 26; 4 COVID deaths were reported.
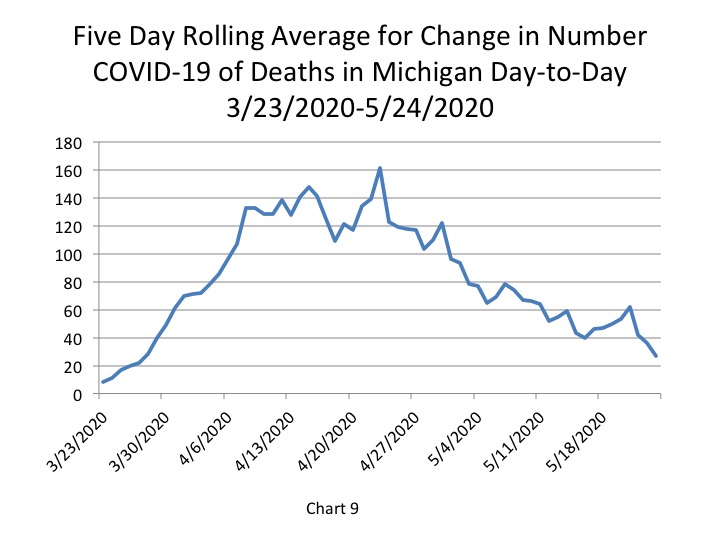
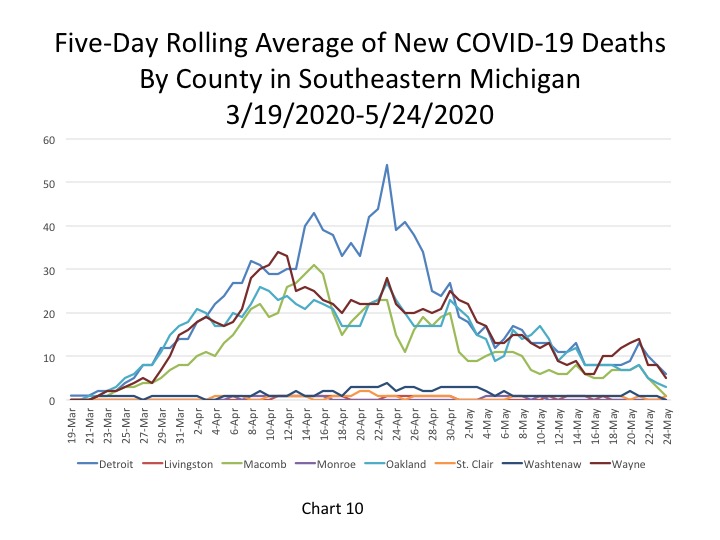
Chart 9, the five day rolling average of deaths, shows the number of new statewide deaths decreased by 9 from the day prior. On May 24 the State reported 27 COVID deaths. Chart 10 shows how the number of deaths in Southeastern Michigan have been either leveling off or decreasing. Detroit reported 6 daily COVID deaths, which was a decrease of 2 from the day prior, further confirming that the number of deaths, at least in areas of Southeastern Michigan, are continuing to decline. On May 24, of the 27 new deaths reported 16 were reported out of Southeastern Michigan. These numbers are based on 5-day rolling averages.
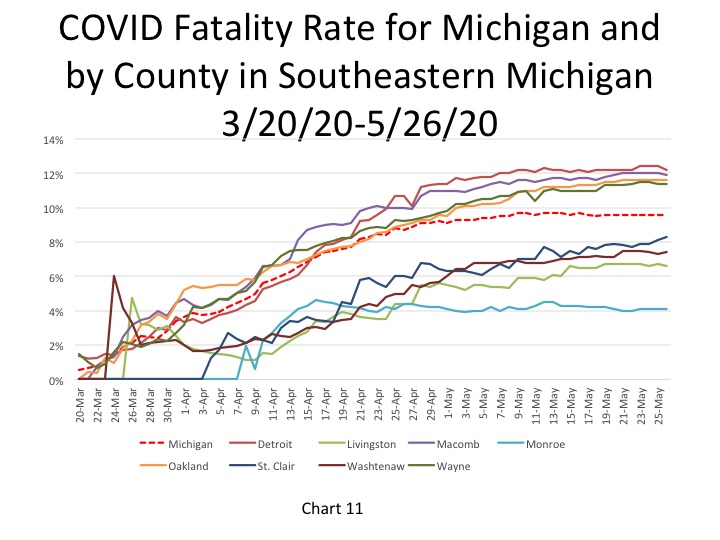
On May 26 Detroit reported a fatality rate of 12.2 percent, showing that while it is the highest rate in the region it has been maintaining at just above 12 percent since May 8. The fatality rate in Macomb County declined to 11.9 percent, and the State continued to report a fatality rate of 9.6 percent for 8 days in a row.
One reason we may be seeing such high fatality rates in Michigan is due to the low testing rates. When only having-presumably-a lower of number confirmed COVID cases than is actually likely due to the limited availability of tests, the fatality rate appears higher because the base comparison is smaller than it might be.
We continue to see lower case numbers and death numbers in Southeastern Michigan than we have in weeks. And, while this is a sign of encouragement, it is also increasing residents’ call to open the State. Gov. Whitmer extended the Stay-at-Home Order through June 12 last week, acknowledging we are seeing signs of improvement, but that we are not out of the woods yet. As economic frustrations grow, we must also remember the value of good health, for ourselves and others.