On July 2, the State of Michigan reported a total of 64,675 cases, an increase of 534 cases from the day prior. The daily total was equivalent to 648 cases per 100,000 people (Chart 4). Of those 534 cases, 219 were documented in Southeastern Michigan. In total, 41 percent of the new COVID cases were in Southeastern Michigan, meaning case numbers are increasing at a higher rate outside of the region than locally. In Chart 1 we show that the State total for the number of COVID cases on June 30 was 63,887–a five-day rolling average. The five-day rolling average for the total number of COVID cases (Chart 1) reflects a smoother curve and adjusts for fluctuations in testing and/or the quality of reporting or failure to report. A closer look at Chart 1 shows how the once flattened curve is spiking upward again.
Chart 2 shows that, based on the five-day rolling averages, the growth of new COVID cases in Southeastern Michigan continues to increase but at a slower rate that of the entire State. On June 30, the number of cases in Detroit reached 11,580, the highest in the region. Wayne County’s numbers reached 10,315 on June 30, Oakland County reported 8,899 cases and Macomb County reported 7,173.
The City of Detroit had 1,730 COVID cases per 100,000 people as of July 2, an increase from 1,724 on July 1(Chart 3). This is based upon a reported increase of 40 new COVID cases between July 1 and July 2, bringing the total number of COVID cases in Detroit to 11,638. Wayne County reported 967 cases per 100,000 people, and Oakland County had 714 cases per 100,000 people. These per capita rates were based upon 10,409 total cases for Wayne and for 8,980 Oakland. Macomb County reported 827 cases per 100,000 people, which is based upon 7,228 cases.
The daily data highlighted in these posts is from Michigan.gov/coronavirus, where data is updated daily at 3 p.m. Historical data were supplied from covidtracking.com, which republishes COVID data from the State. Additionally, the case totals do not reflect the number of people who have recovered, just those who have been infected. In early June the State changed how it reports its data on the website, making data more accurate in the long-term but more complicated to track as well. The State regularly updates older data and as we continue to publish regular updates on COVID the State’s changes to past data many not always be reflected in our posts. The data published in new posts is accurate for the day we received it on though.
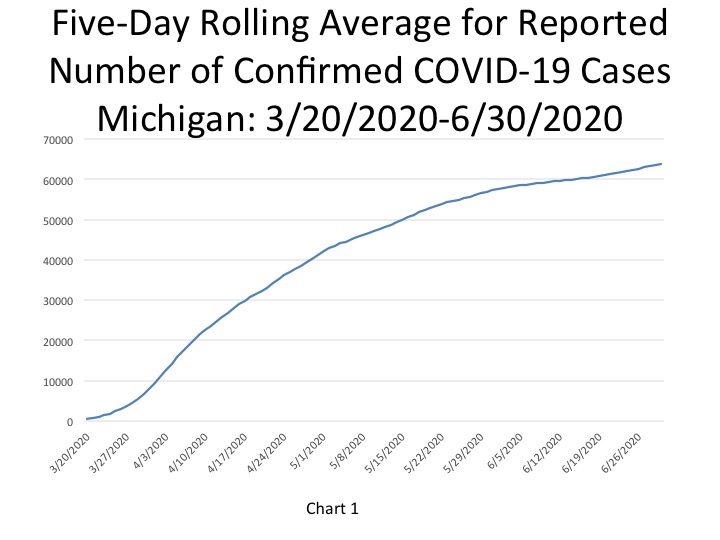
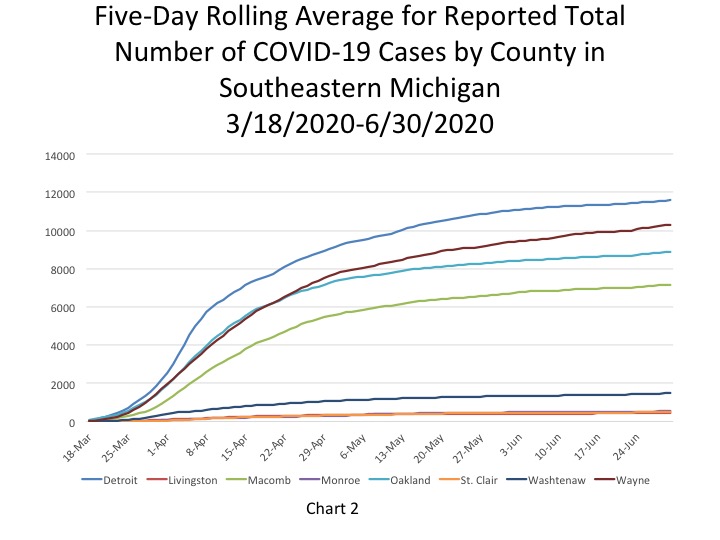
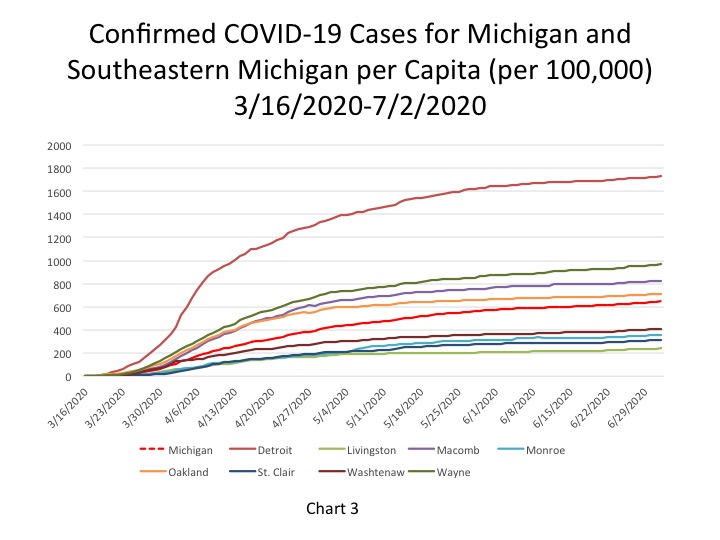
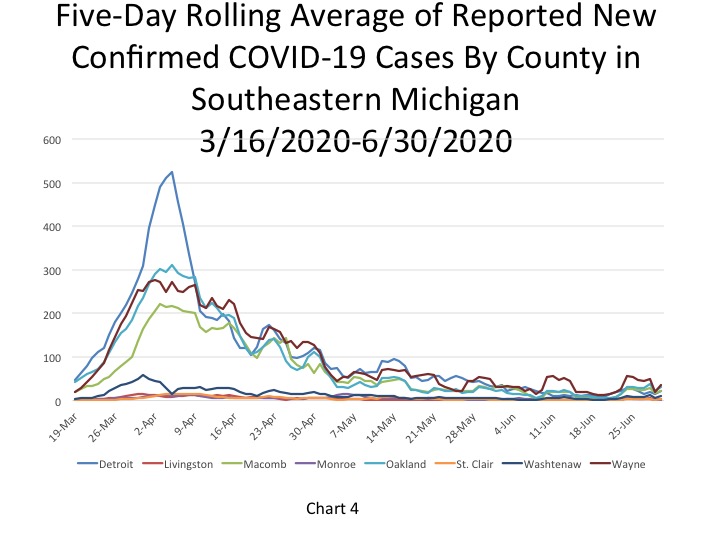
Chart 4 shows that Wayne County continues to report the highest number of daily cases, according to the five-day rolling average, at 35 on June 30. Detroit and Macomb County each reported 22 new daily cases while Oakland County reported 31. The chart shows that the number of new daily cases in the last several days is higher than what was reported in mid-June.
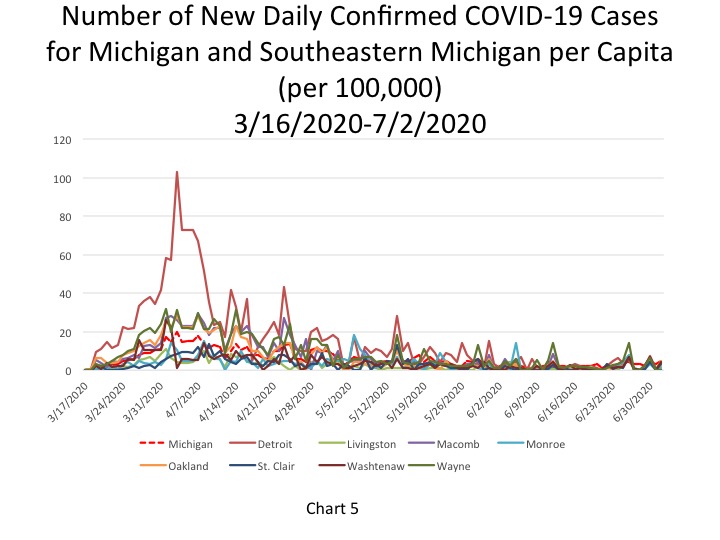
On July 2, the per capita rate for the number of new daily COVID cases per 100,000 people was 5 for the State, which was equivalent to 543 new cases. The last time similar numbers were reported at the State level was May 31. On July 2, Detroit and Wayne County were the only local government entities in the region to have a higher per capita rate than the State. Wayne County reported 7 new daily COVID cases per 100,000 people on July 2, which was equivalent to 76 new cases and Detroit reported a per capita rate of 6, which was equivalent to 40 new cases. Oakland County reported a per capita rate of 5 and Macomb County reported a per capita rate of 4, these rates were equivalent to 58 and 34 new cases, respectively. In Southeastern Michigan there were 219 new COVID cases reported on July 2.
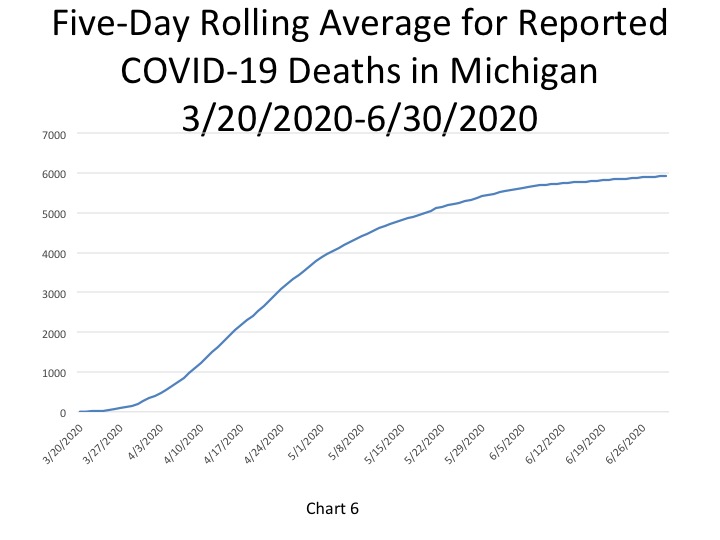
In Chart 6, the five-day rolling average for the number of deaths in Michigan, shows the number of deaths in the State of Michigan is increasing at a much lower rate than the number of new COVID cases. On June 30 the cumulative deaths were 5,938 deaths (an increase of 12 deaths from the day prior). The actual cumulative COVID-19 deaths on July 2 was 5,966, an increase of 14 deaths from the prior day. Of the 14 deaths that were reported on July 2, 8 occurred in Southeastern Michigan. Additionally, 13 of the those 14 deaths were added on to the July 2 total as a result of comparing death records with the COVID database.
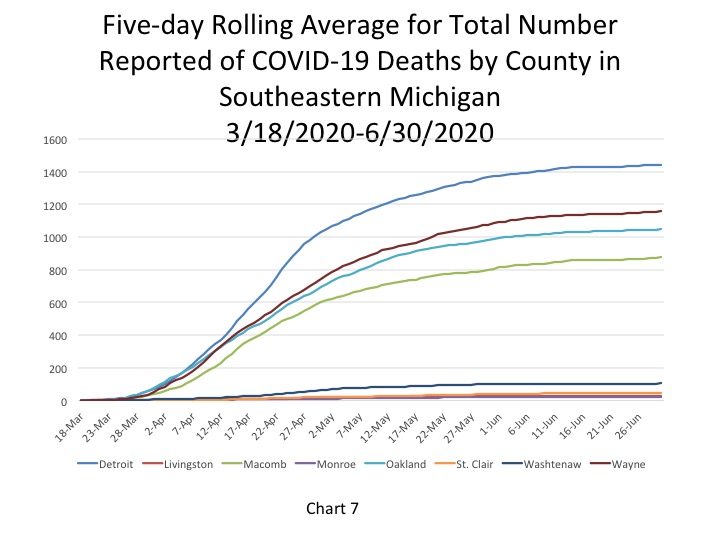
Chart 7 (a 5-day rolling average) echoes the message the statewide data is conveying regarding COVID deaths in Michigan-they are occurring at minimal rates and mostly in Southeastern Michigan. On June 30 the City of Detroit reported 1,441 deaths, an increase of 1 death from the day prior. Wayne County had the second highest total at 1,158 deaths on June 30.
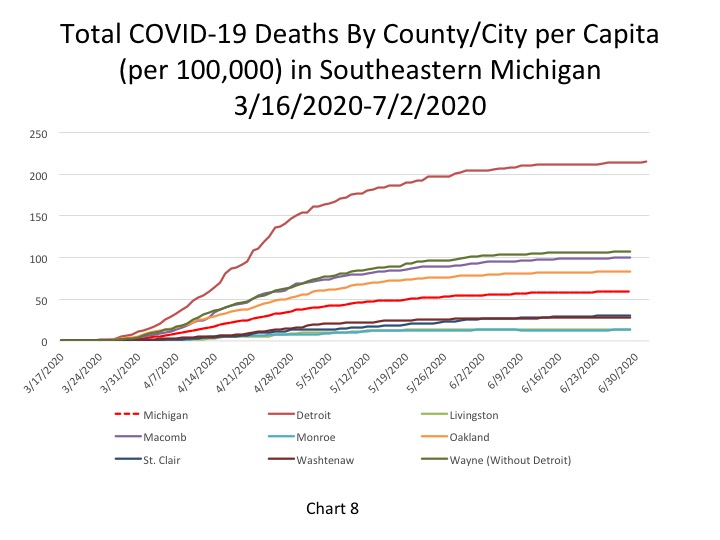
The per capita rates for the number of total COVID deaths in Southeastern Michigan continues to remain fairly stagnant across the region as counties, and the City of Detroit experience zero to minimal increases in COVID death numbers. Detroit reported 215 total COVID deaths per 100,000 people on July 2, which was equivalent to 1,445 deaths. Wayne County reported a per capita rate of 108 (1,163 deaths), Macomb County reported a per capita rate of 110 (880 deaths) and Oakland County reported a per capita rate of 83 (1,049 deaths). The State of Michigan reported a per capita rate for the number of total COVID deaths at 60 per 100,000 people, which was equivalent to 5,966 total deaths.
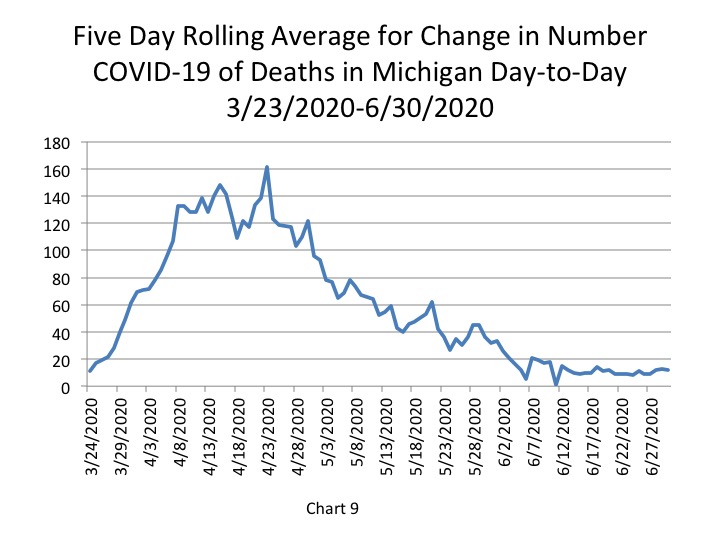
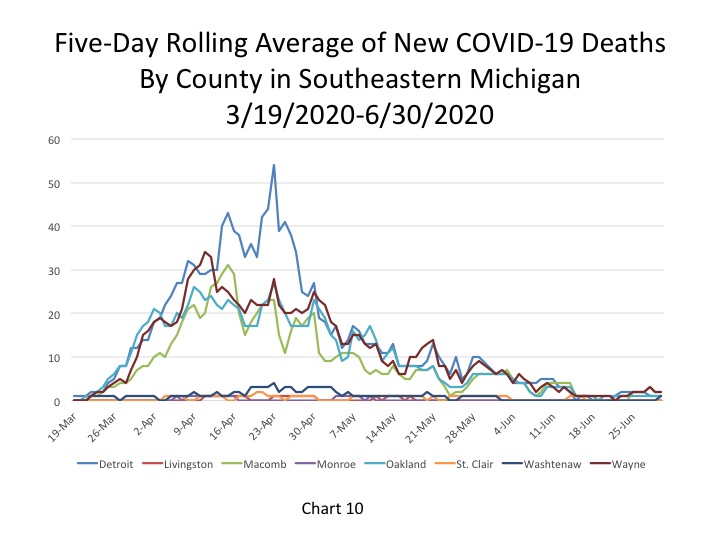
Chart 9, the five day rolling average of deaths, shows the number of new statewide deaths was reported at 12 on June 30. Furthermore, Chart 10 shows how the number of deaths in Southeastern Michigan continues to remain low but also how the region is the largest contributor to the number of Statewide deaths. Macomb and Wayne counties each reported 2 new deaths on June 30, and Detroit and Oakland and Washtenaw counties reported 1; the other counties in the region reported 0. These numbers are based on 5-day rolling averages.
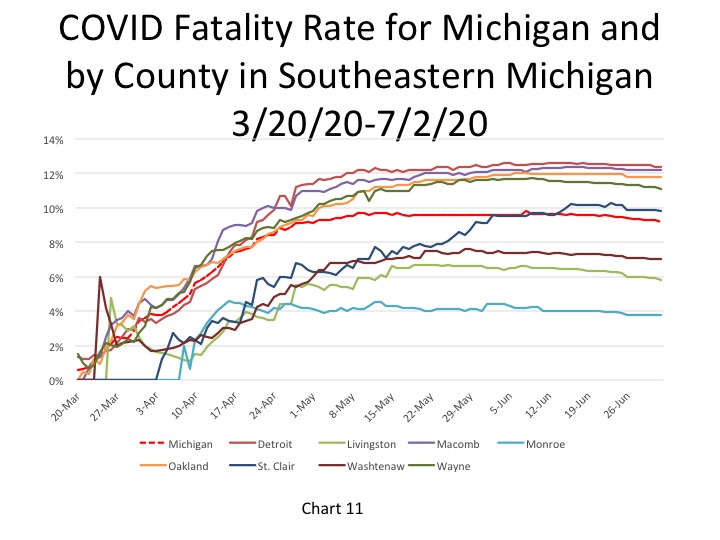
Detroit and Macomb County were the only two government entities in Southeastern Michigan to maintain a fatality rate above 12 percent as of July 2. Detroit’s fatality rate was 12.4 percent and Macomb County’s was 12.2 percent. The fatality rate continues to decline, it was reported at 9.2 percent on July 2.
While COVID death numbers remaining low is encouraging, the fact that the number of new daily cases continues to increase is just the opposite. With 534 new COVID cases reported on July 2, the highest number since May 31, cause for concern also continues to increase. Gov. Gretchen Whitmer has also seen the increasing number of new daily cases as a risk to public health, which is why she recently ordered indoor bars to close throughout most of Michigan.
With the holiday weekend here and case numbers rising it is vital that citizens continue to remain distant from others, wear masks, regularly wash their hands and stay home if they feel sick. As has been seen with examples such as the one coming out of an East Lansing bar, one infected person in a crowded area with little to no protection can cause a major outbreak, putting the public at a greater risk.