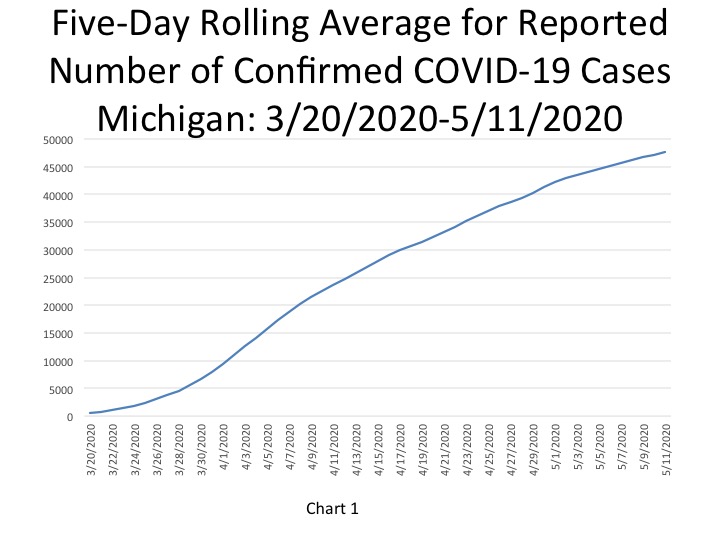
According to the State of Michigan, the total number of COVID cases in Michigan rose to 48,391 on May 13, an increase of 370 cases from the previous day. This total was equivalent to 485 cases per 100,000 people (Chart 4). The five-day rolling average for the total number of COVID cases (Chart 1) reflects a smoother curve and adjusts for fluctuations in testing and/or the quality of reporting or failure to report. The upward trend of the curve has been flattening in recent weeks as the number of new COVID cases, both throughout the State and regionally, gradually declines. In Southeastern Michigan, Detroit reported the highest number of daily cases at 65 on May 11; this was a decline from the day before (Chart 4). Note that this five day rolling average causes these daily case and daily death charts to lag two days behind.
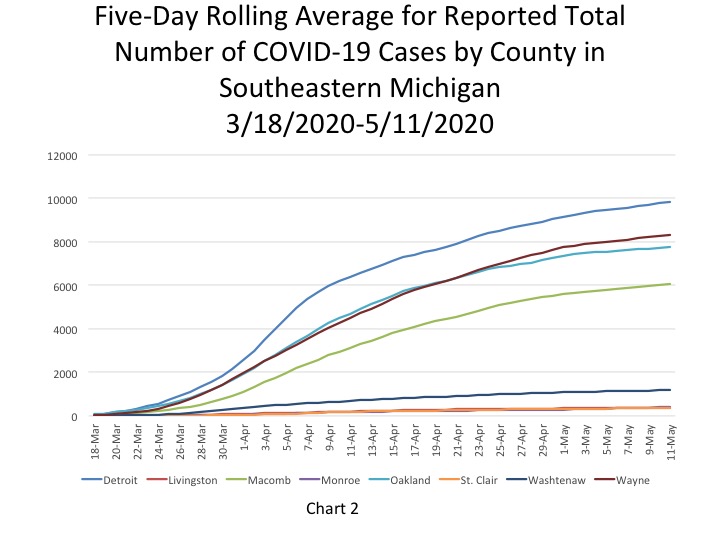
Chart 2 shows that, based on the five-day rolling averages, the number of new COVID cases in Southeastern Michigan continues to flatten. The number of cumulative COVID cases remained the highest in Detroit at 9,843 on May 11, with Wayne County following at a reported 8,335 cases. On May 11, the five-day rolling average for the number of COVID cases in Oakland County was 7,759, and Macomb County reported 6,072.
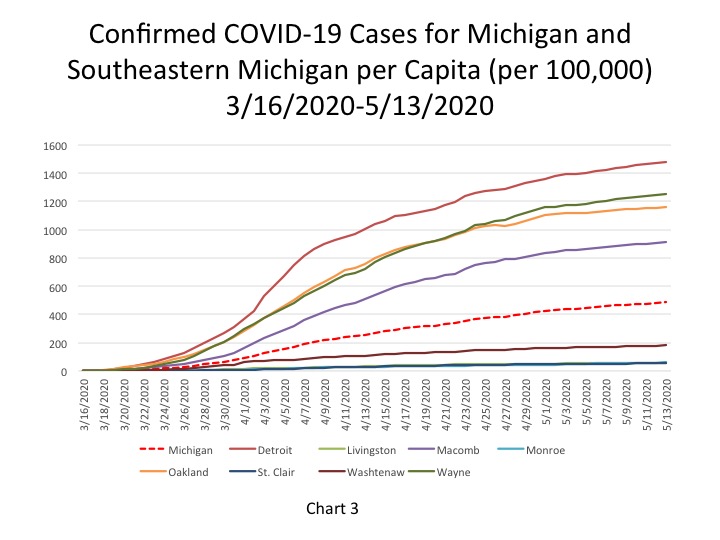
The City of Detroit had 1,483 COVID cases per 100,000 people on May 13, an increase from 1,471 the day before (Chart 3). This is based upon a reported increase of 76 new cases, bringing the total number of COVID cases in Detroit to 9,973. Wayne County reported 1,251 cases per 100,000 people, and Oakland County had 1,164 cases per 100,000 people. These per capita rates were based upon 8,416 total cases for Wayne and 7,830 for Oakland. Macomb County reported 912 cases per 100,000 people, which is based upon 6,137 cases.
The daily data highlighted in these posts is from Michigan.gov/coronavirus, where data is updated daily at 3 p.m. Historical data were supplied from covidtracking.com, which republishes COVID data from the State. Additionally, the case totals do not reflect the number of people who have recovered, just those who have been infected.
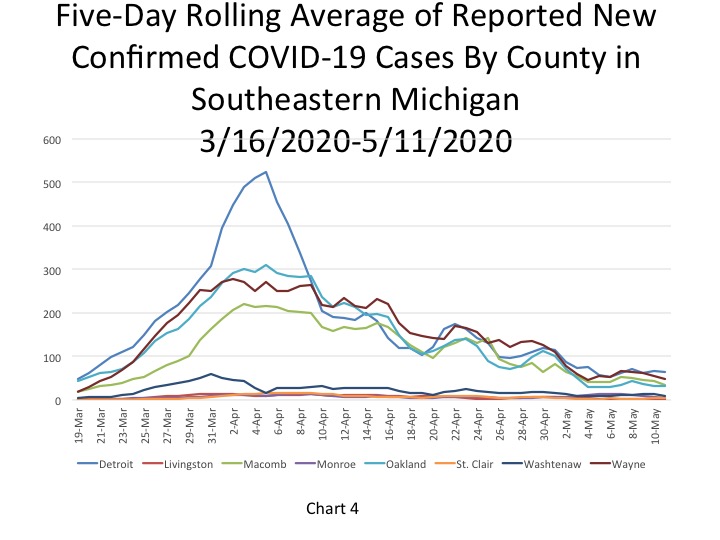
As noted, Chart 4 shows that Detroit reported the highest number of daily cases at 65 on May 11. This chart further highlights how the number of new cases, calculated with a 5-day rolling average, have flattened out of over the last week throughout Southeastern Michigan.
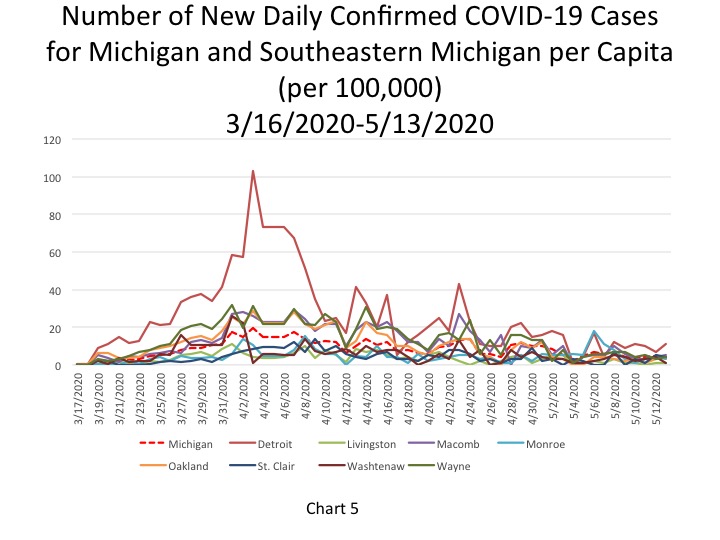
Chart 5 shows that the per capita rate for the number of new daily COVID cases per 100,000 people has nearly flattened out across Southeastern Michigan, but with Detroit still remaining noticeably above the others. The per capita rate for Detroit on May 13 was 11 new COVID cases per 100,000 people; this was equivalent to 76 new cases. Wayne County’s per capita rate increased to 4 new COVID cases, which was equivalent to 39 new cases. Oakland County reported a per capita rate of 4 new cases per 100,000 people on May 13, which was equivalent to 46 new cases, and Macomb County reported a rate of 5, which was equivalent to 40 new cases.
The State’s per capita rate was 3.7 new cases per 100,000 people, equivalent to 370 new cases. Of these 370 new cases, Southeastern Michigan accounted for 218.
The chart also shows that the per capita rates for the number of daily COVID cases has been fairly stable for the last several days.
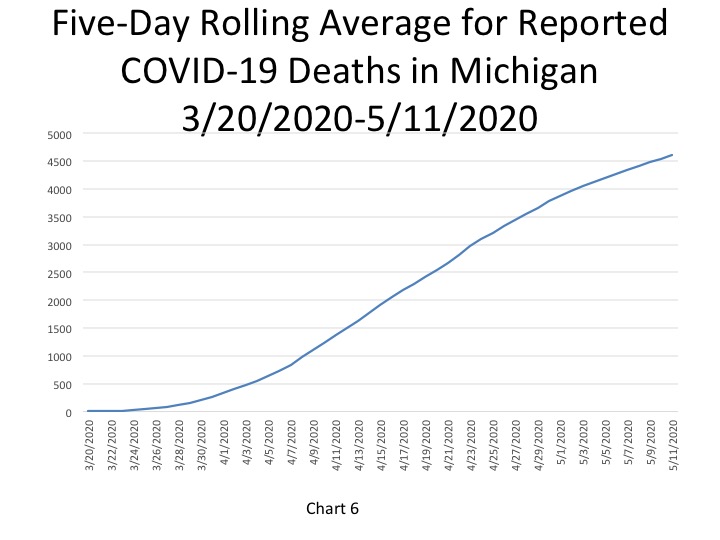
In Chart 6, the five-day rolling average for the number of cumulative deaths shows a continuing slow increase (a lagged number of 4,610 deaths, an increase of 64 deaths). The actual reported COVID-19 deaths reached 4,714 on May 13, an increase of 40 deaths from the day prior. Southeastern Michigan contributed 27 additional deaths to the overall 40 reported on May 13. Such data further shows that while the rate of death is increasing at a much slower rate throughout the State and in Southeastern Michigan, the Southeastern Michigan region accounts for the majority of the growth in cases and deaths.
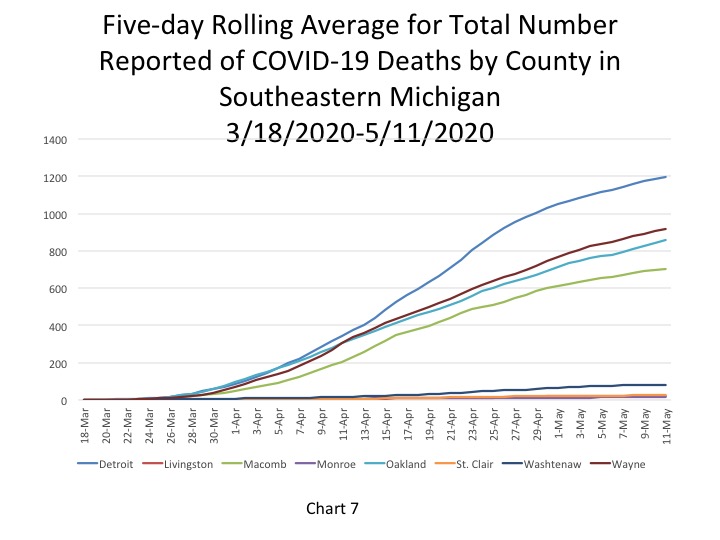
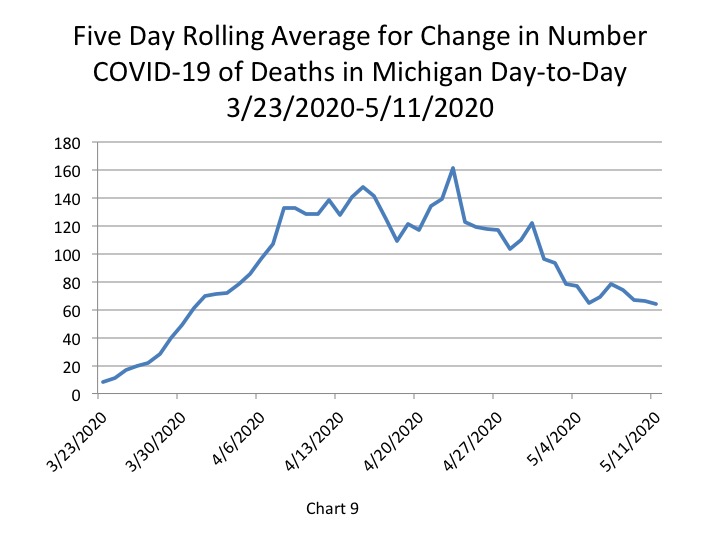
Chart 7 portrays how the total number of COVID deaths in Southeastern Michigan continues to increase, but at a much slower rate. The rate of increase is gradually declining because the number of additional deaths throughout the State (Chart 9) and the region are declining.
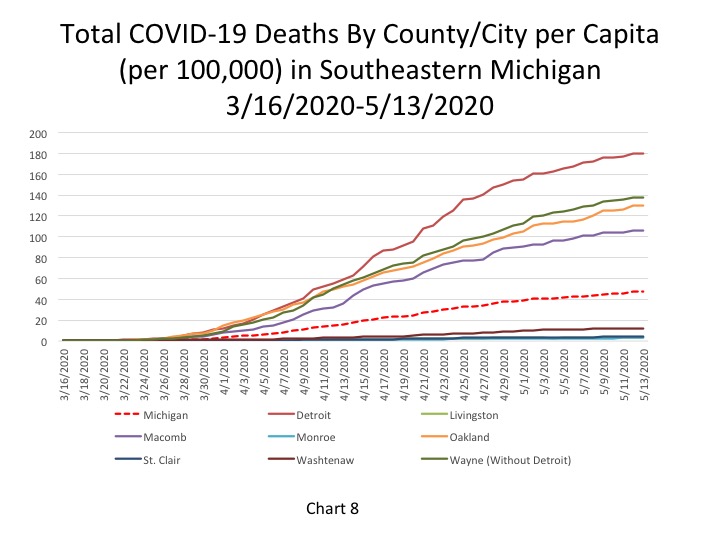
Chart 8 portrays the total number of COVID deaths per 100,000 people. As of May 13, the cumulative total of COVID deaths per 100,000 people in Detroit was 181 (representing 1,218 deaths). In Wayne County there were 139 COVID deaths per 100,000 people (938 total deaths), in Oakland County there were 130 deaths per 100,000 people (874 total deaths), and in Macomb County there were 107 COVID deaths per 100,000 people (717 total). Wayne County reported the highest number of additional deaths at 11.
As shown in Chart 9, the last time the State reported as few deaths as was reported on May 11 (as determined by a 5-day rolling average) was in March; the State reported 64 daily COVID deaths on May 11.
The State of Michigan had 47 COVID deaths per 100,000 people.
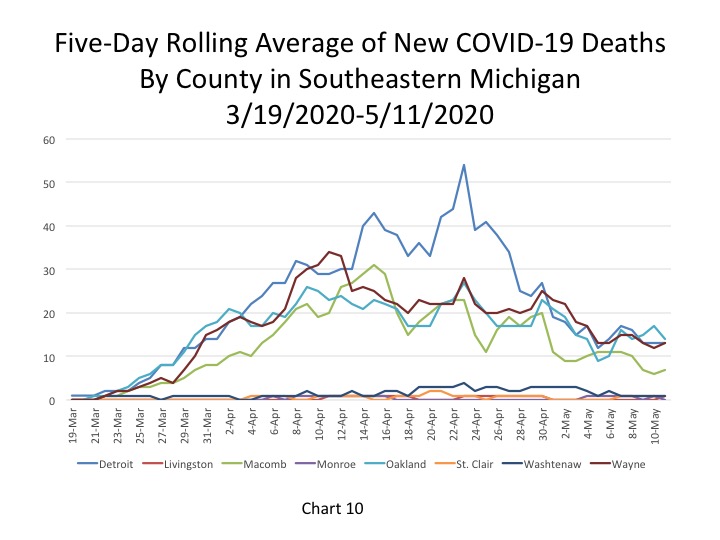
Just as the State’s daily COVID death numbers are gradually declining so are those numbers in Southeastern Michigan. Chart 10 highlights how since mid-April the overall number of daily COVID deaths has declined in Detroit and Macomb, Oakland and Wayne counties. Even more recently, those numbers are leveling off. Oakland County reported the highest number of additional deaths on May 11 at 14, this was based on a 5-day rolling average calculation. Detroit reported 13 additional daily deaths, the same number it reported for the last three days. Wayne County also reported 13 additional daily COVID deaths on May 11, based on 5-day rolling averages, while Macomb County reported 7.
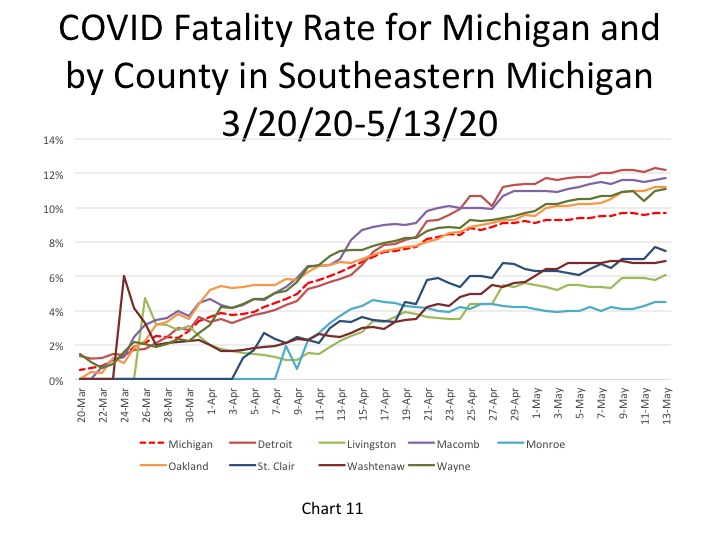
The fatality rate for Detroit continued to hover above 12 percent on May 13 while Macomb County’s fatality rate inched toward 12 percent. Detroit reported a fatality rate of 12.2 percent and Macomb County reported a fatality rate of 11.7 percent. The State reported a 9.7 percent fatality rate on May 13, the same rate it reported the day prior.
One reason we may be seeing such high fatality rates in Michigan is due to the low testing rates. When only having-presumably-a lower of number confirmed COVID cases than is actually likely due to the limited availability of tests, the fatality rate appears higher because the base comparison is smaller than it might be.
On the other hand, there is the possibility that despite increasing numbers of tests, the case fatality rate might remain high. If so, this means COVID-19 is a very lethal disease.
The data continues to show that the spread of the virus is slowing down, with the number of daily case and death numbers declining overall. However, a new concern was raised on May 13 by Gov. Gretchen Whitmer, and others, following a New York Times article that showed how Michigan had the largest drop in the percentage of people staying home last week. According to the article, about 1 million people started leaving their homes again. We do know that some industry-such as construction and manufacturing-have begun to open in Michigan, and this is certainly affecting the increase in the number of people moving about. We also know that, given the infectious nature of this virus, the increased amount of movement might trigger an increase in COVID case numbers for another week or so.