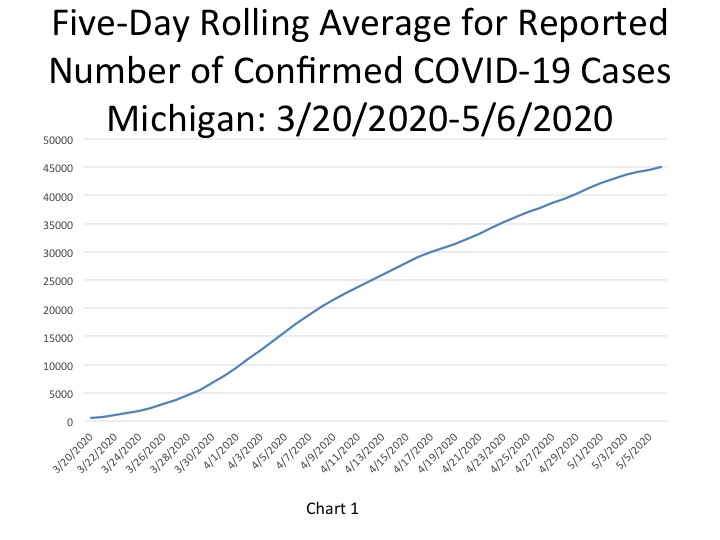
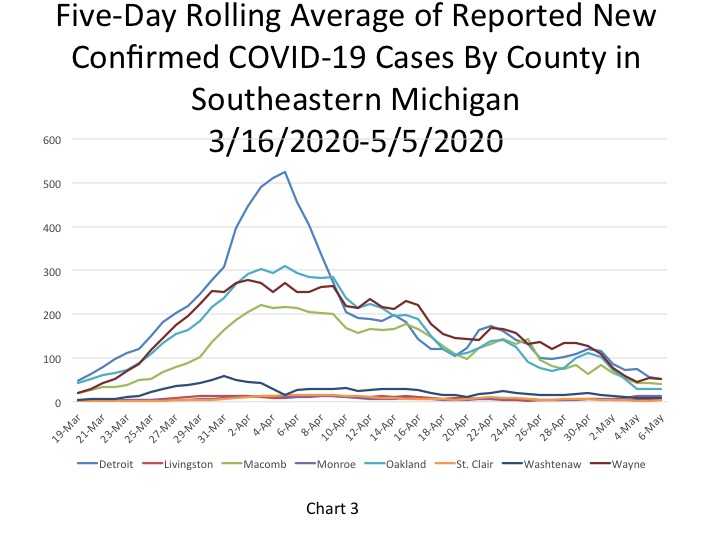
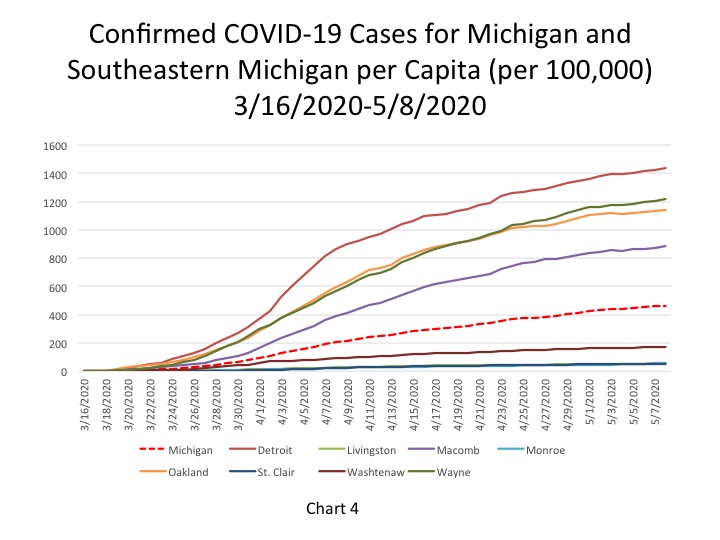
According to the State of Michigan, the total number of COVID cases in Michigan rose to 46,326, an increase of 680 cases from the previous day. This total was equivalent to 463 cases per 100,000 people (Chart 4) on May 8. The five-day rolling average for the total number of COVID cases (Chart 1) reflects a smoother curve and adjusts for fluctuations in testing and/or the quality of reporting or failure to report. That curve continues to trend upward, but the number of new COVID cases identified each day in Southeastern Michigan has been slowly decreasing for nearly a month now. Since April 2 none of the counties in Southeastern Michigan or Detroit have reported more than 100 new daily cases. On May 6 Wayne County reported the highest number of new cases at 53 (Chart 3). Note that this five day rolling average causes these daily case and daily death charts to lag two days behind.
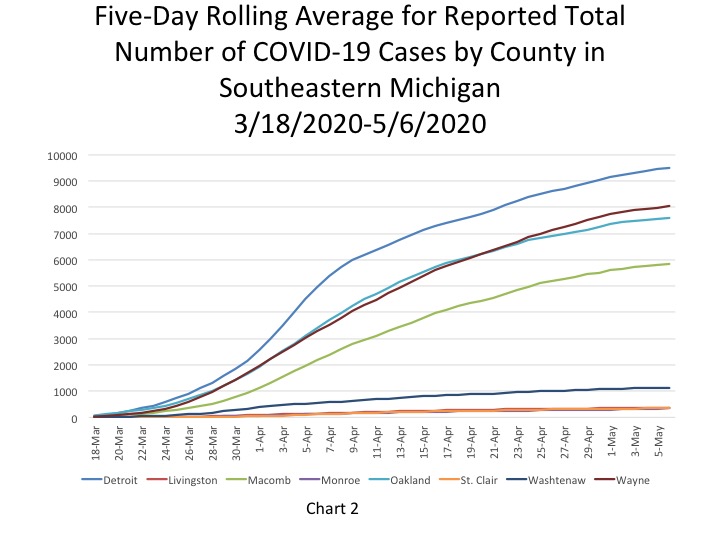
Chart 2 shows how the curve is flattening in Southeastern Michigan, based on the five-day rolling averages. This is inline with the Gov. Gretchen Whitmer’s statement that the State is in Stage 3 of her 6 stage “plan;” Stage 3 is where the COVID case growth is gradually declining. So, while the numbers overall are continuing to rise it is at a much slower rate, showing new case growth is on the decline. Detroit still had the highest number of cumulative COVID cases at 9,514 on May 6, with Wayne County following at a reported 8,040 cases. On May 6, the five-day rolling average for the number of COVID cases in Oakland County was 7,580, and Macomb County reported 5,843.
The daily data highlighted in these posts is from Michigan.gov/coronavirus, where data is updated daily at 3 p.m. Historical data were supplied from covidtracking.com, which republishes COVID data from the State.
The City of Detroit had 1,434 COVID cases per 100,000 people on May 8, an increase from 1,422 the day before (Chart 4). This is based upon a reported increase of 82 new cases, bringing the total number of COVID cases in Detroit to 9,648. Wayne County reported 1,215 cases per 100,000 people, and Oakland County had 1,139 cases per 100,000 people. These per capita rates were based upon 8,176 total cases for Wayne and 7,664 for Oakland. Macomb County reported 886 cases per 100,000 people, which is based upon 5,963 cases.
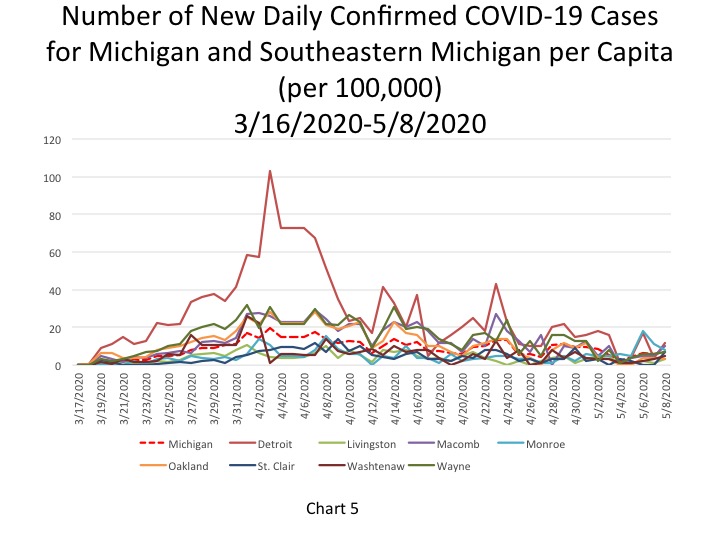
Chart 5 shows that the per capita rate for the number of new daily COVID cases per 100,000 people doubled, or more, for Detroit and Macomb and St. Clair counties between May 7 and May 8. On May 8, Detroit reported 12 new daily COVID cases per 100,000 people, an increase from a rate of 4 the day before. Detroit reported 82 new COVID cases on May 8. For Macomb County, its rate increased from 5 new COVID cases per 100,000 people to 10; in total Macomb County reported 87 new cases on May 8. The per capita rate in St. Clair County increased from 0 to 7 new COVID cases per 100,000 people; this was equivalent to 11 new cases. Wayne County reported a rate of 7 new COVID cases on May 8, which was equivalent to 75 new cases. Oakland County experienced a decline in its rate, from 4 to 3 new cases per 100,000 people. On May 8 Oakland County reported 40 new COVID cases.
The State’s per capita rate was 6.8 new cases per 100,000 people, equivalent to 680 new cases. In total, of the 680 new cases, Southeastern Michigan accounted for 333 of them.
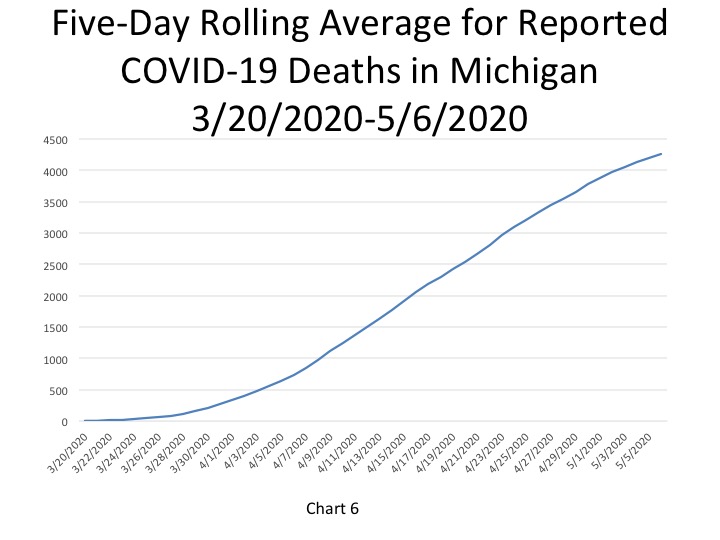
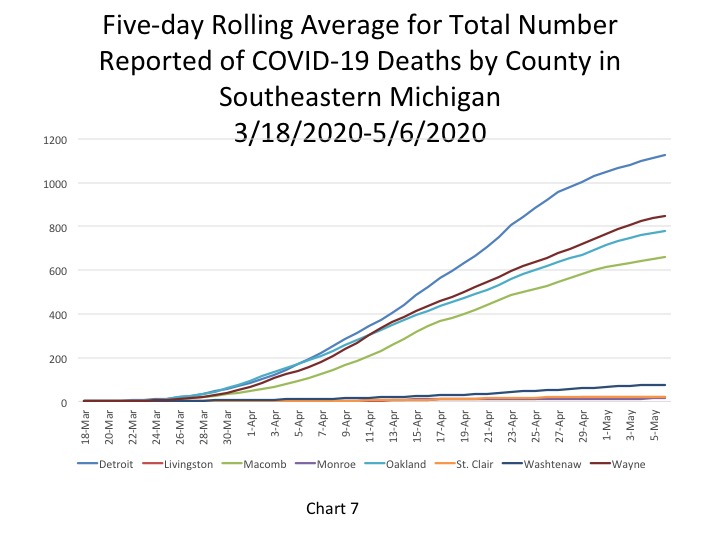
In Chart 6 the five-day rolling average for the number of deaths shows a continuing steady increase (a lagged number of 4,260 deaths, an increase of 69 deaths). The actual reported COVID-19 deaths reached 4,395 on May 8, an increase of 50 deaths from the day prior. Of those 50 additional deaths reported on May 8, 40 were in Southeastern Michigan. Chart 7 portrays how the total number of COVID deaths in Southeastern Michigan continues to increase, but that rate has been gradually declining overall, showing that the curve is now beginning to flatten. The rate at which the number of deaths is increasing in Detroit and Wayne County is now roughly equal, though Detroit, where Covid-19 landed first, continues to have a much higher cumulative death total.
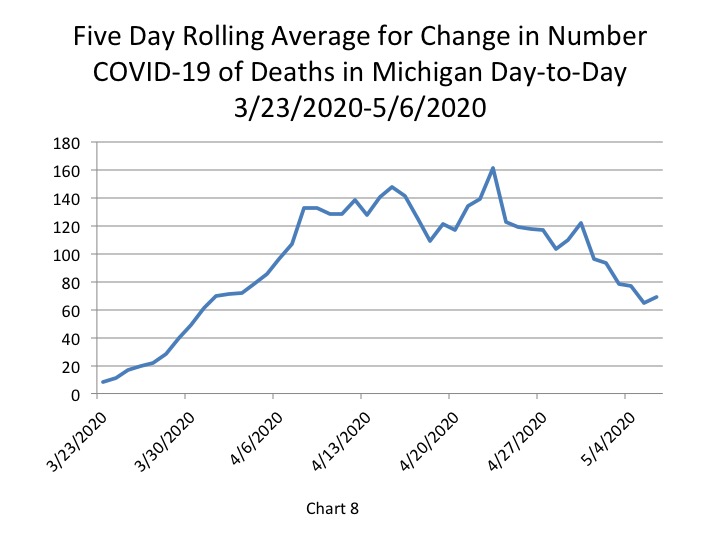
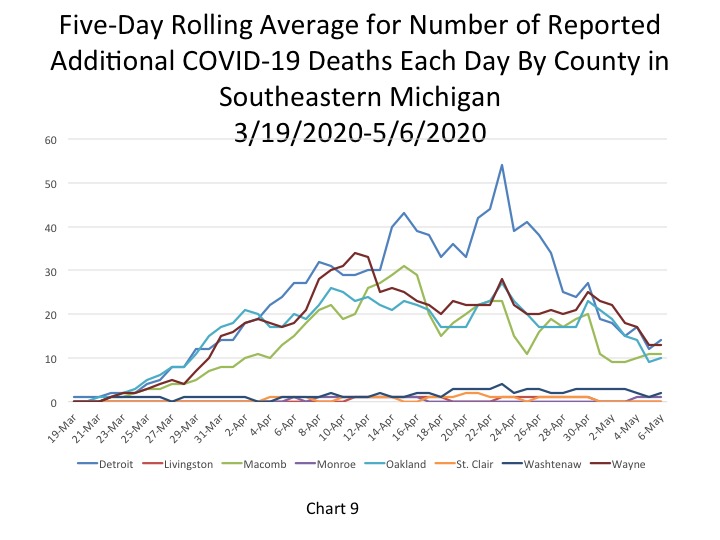
Chart 8 shows that the number of daily deaths in Michigan continues to decline overall, despite a small uptick on May 6. Chart 9 shows that Detroit and Oakland and Washtenaw counties contributed to the small uptick in the total number of additional deaths in Michigan. Detroit reported 14 additional deaths, which was 2 more than what was reported the day prior. Oakland and Washtenaw counties each reported 1 single additional death from the day prior. Aside from those three entities, the other five counties in Southeastern Michigan reported the same number of additional deaths as the day prior, further showing that the curve is in fact flattening.
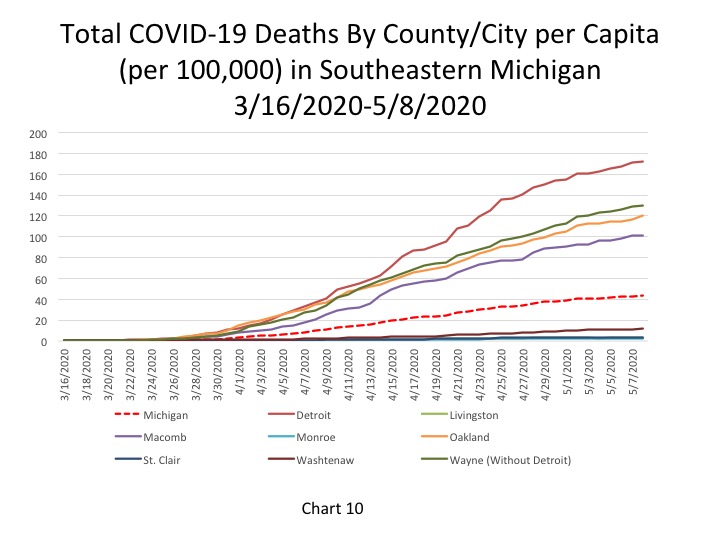
Chart 10 portrays the total number of COVID deaths per 100,000 people. As of May 8, the cumulative total of COVID deaths per 100,000 people in Detroit was 172 (representing 1,154 deaths). In Wayne County there were 130 COVID deaths per 100,000 people (874 total deaths), in Oakland County there were 120 deaths per 100,000 people (805 total deaths), and in Macomb County there were 101 COVID deaths per 1000,000 people (682 total).
The State of Michigan had 44 COVID deaths per 100,000 people, a rate that continues to remain lower than the four entities discussed above.
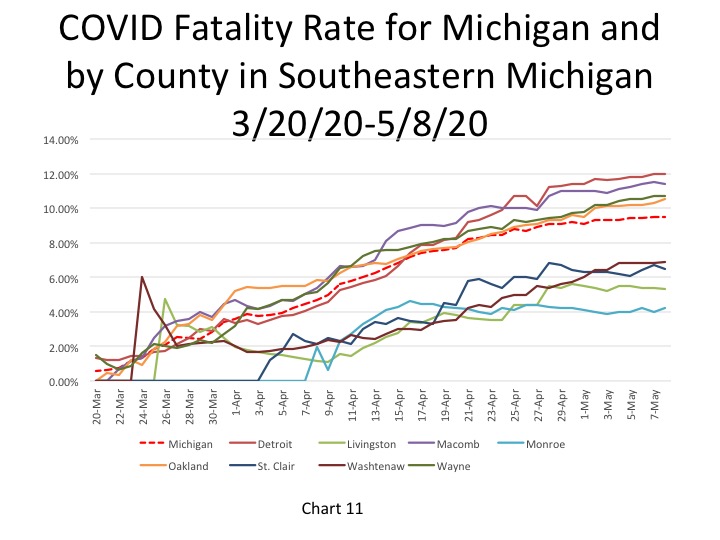
The fatality rate in Detroit remained at 12 percent on May 8 and the State’s remained at 9.5 percent. Macomb, Oakland and Wayne counties all have fatality rates above 10 percent.
One reason we may be seeing such high fatality rates in Michigan is due to the low testing rates. When only having-presumably-a lower of number confirmed COVID cases than is actually likely due to the limited availability of tests, the fatality rate appears higher because the base comparison is smaller than it might be.
As Gov. Whitmer announced earlier this week, Michigan is in the “flattening the curve” phase in facing the coronavirus pandemic. The data presented in this post supports that statement, showing how the number of new daily cases and deaths have remained steady and even showed signs of declining in recent days. In order for the State to safely re-open though we need to move beyond flattening the curve and show that hospitalizations are not only continuously declining but that outbreaks can be quickly contained, and community spread is no longer expected to return.