According to the State of Michigan, the total number of COVID cases in Michigan rose to 49,582 on May 14, an increase of 1,191 cases from the previous day. This total was equivalent to 497 cases per 100,000 people (Chart 4). The five-day rolling average for the total number of COVID cases (Chart 1) reflects a smoother curve and adjusts for fluctuations in testing and/or the quality of reporting or failure to report. While the curve is smooth, and still trending upward at a much lower rate, Chart 1 does reflect a larger increase on May 12 than what has been trending. The 1,191 case increase on May 14, which is reflected in Chart 1 with the 5-day rolling average calculation, is partially due to a backlog of case information from Michigan’s correctional facilities that is now being reported, according to the State. Additionally, the State continues to increase the number of people being tested, including those in correctional facilities. The 1,191 daily cases reported on May 14 is the highest daily case number that has been reported since April 29.
Chart 2 shows that, based on the five-day rolling averages, the number of new COVID cases in Southeastern Michigan are also only gradually increasing, but Detroit’s rates are increasing at a higher pace than the other entities in the region. The number of cumulative COVID cases remained the highest in Detroit at 9,934 on May 12, with Wayne County following at a reported 8,406 cases. On May 12, the five-day rolling average for the number of COVID cases in Oakland County was 7,811, and Macomb County reported 6,114.
The City of Detroit had 1,511 COVID cases per 100,000 people on May 11, an increase from 1,483 the day before (Chart 3). This is based upon a reported increase of 191 new cases, bringing the total number of COVID cases in Detroit to 10,164 . Wayne County reported 799 cases per 100,000 people, and Oakland County had 632 cases per 100,000 people. These per capita rates were based upon 8,606 total cases for Wayne and 7,952 for Oakland. Macomb County reported 713 cases per 100,000 people, which is based upon 6,232 cases. Please note there was an error in population numbers for some of the entities reported here, which affected recent per capita rate numbers. That has been adjusted, as have the rate numbers. These overall trends have not changed though.
The daily data highlighted in these posts is from Michigan.gov/coronavirus, where data is updated daily at 3 p.m. Historical data were supplied from covidtracking.com, which republishes COVID data from the State. Additionally, the case totals do not reflect the number of people who have recovered, just those who have been infected.
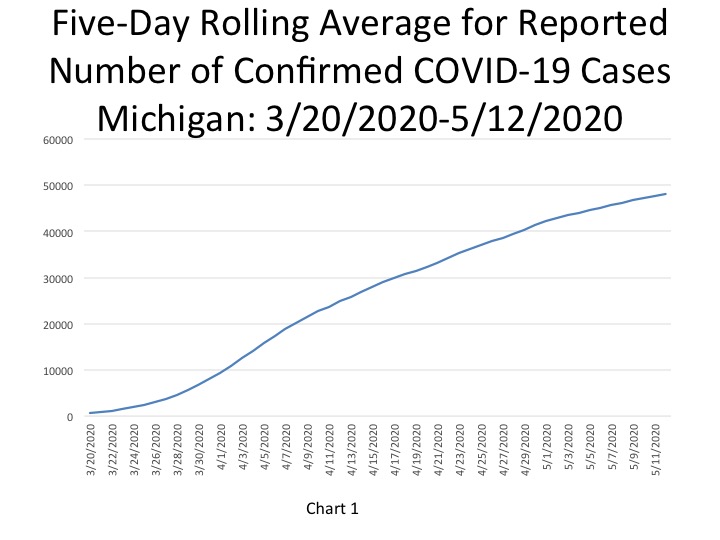
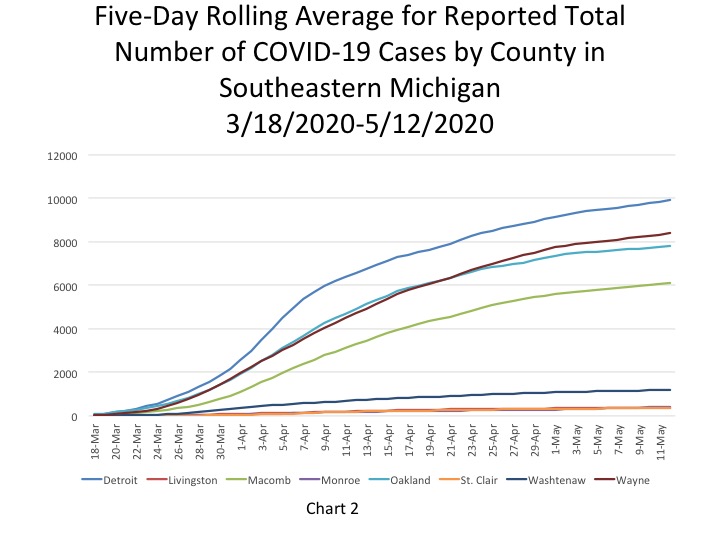
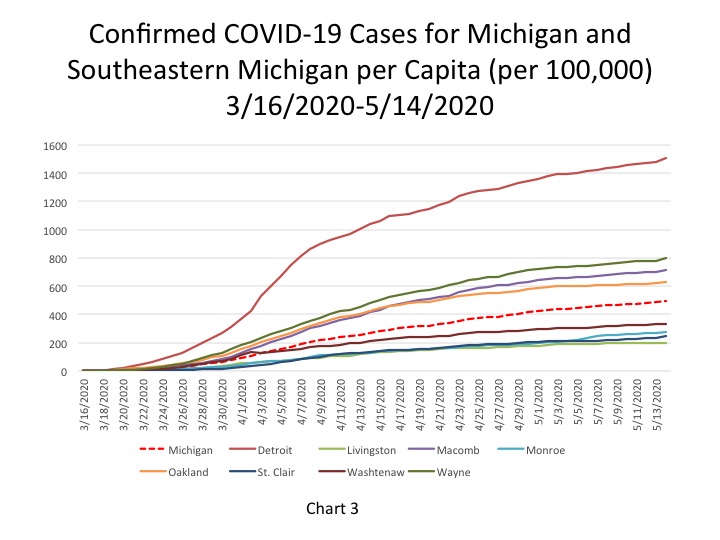
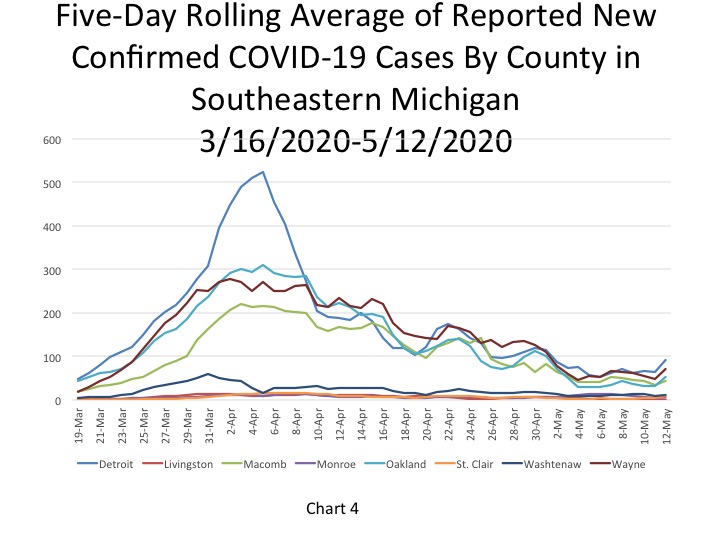
Chart 4 shows that Detroit reported the highest number of daily cases at 91 on May 12, an increase from the 65 new cases reported the day prior. Overall this chart reflects that the largest daily case increase since April did impact Detroit and Macomb, Oakland and Wayne counties.
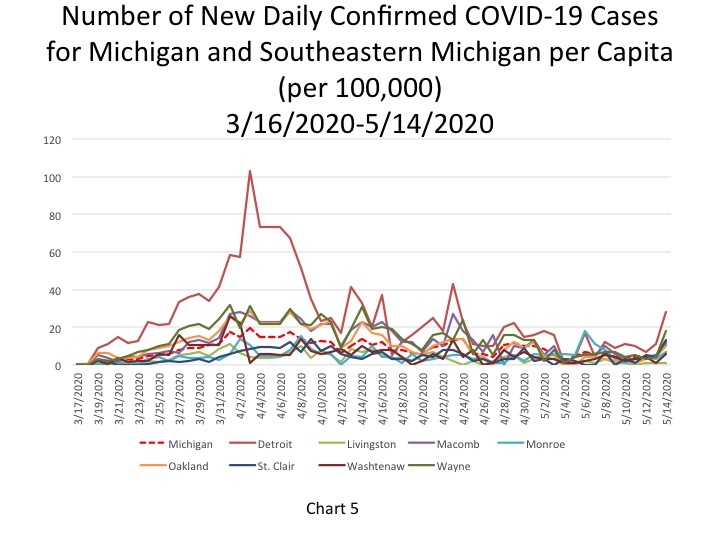
Chart 5 further highlights how the per capita rate for the number of new daily COVID cases per 100,000 people did noticeably increase for Detroit and Macomb, Oakland and Wayne counties. The per capita rate for Detroit on May 14 was 28 new COVID cases per 100,000 people; this was equivalent to 191 new cases and more than double the per capita rate from the day prior. Wayne County’s per capita rate increased to 18 new COVID cases, which was equivalent to 190 new cases. Oakland County reported a per capita rate of 10 new cases per 100,000 people on May 14, which was equivalent to 122 new cases, and Macomb County reported a rate of 11, which was equivalent to 95 new cases.
The State’s per capita rate was 11.9 new cases per 100,000 people, equivalent to 1,191 new cases. Of these 1,191 new cases, Southeastern Michigan accounted for 653.
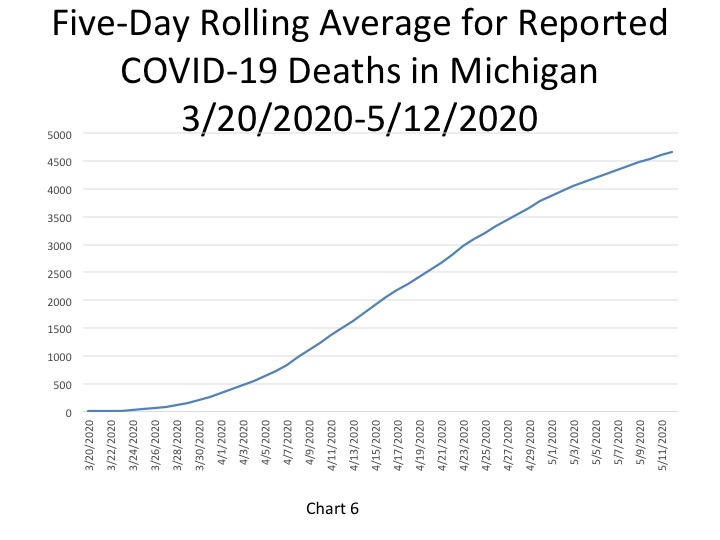
In Chart 6, the five-day rolling average for the number of deaths shows a continuing slow increase (a lagged number of 4,662 deaths, an increase of 52 deaths). The actual reported COVID-19 deaths reached 4,787 on May 14, an increase of 73 deaths from the day prior. Of those 73 deaths, 35 were added to the May 14 count as a result of the State comparing death records with the COVID database. Southeastern Michigan contributed 55 additional deaths to the overall 73 reported on May 14. Even with the addition of the 35 deaths, the overall daily death county continued to decrease from the day prior.
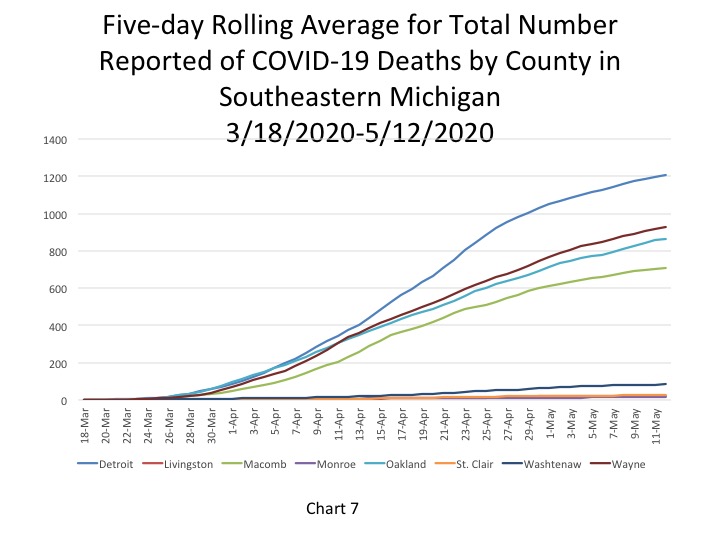
Chart 7 portrays how the total number of COVID deaths in Detroit moved above 1,200 on May 12. According to the 5-day rolling average data Detroit reported 1,209 cumulative deaths. Wayne County had the second highest total at 927 on May 12.
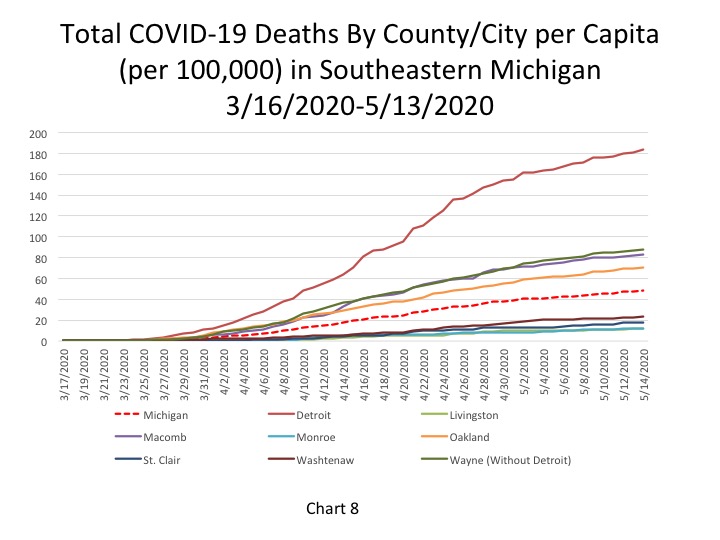
Chart 8 portrays the total number of COVID deaths per 100,000 people. As of May 14, the cumulative total of COVID deaths per 100,000 people in Detroit was 184 (representing 1,236 deaths). In Wayne County there were 88 COVID deaths per 100,000 people (947 total deaths), in Oakland County there were 71 deaths per 100,000 people (888 total deaths), and in Macomb County there were 83 COVID deaths per 100,000 people (728 total). Detroit reported the highest number of additional deaths at 18.
The State of Michigan had 48 COVID deaths per 100,000 people.
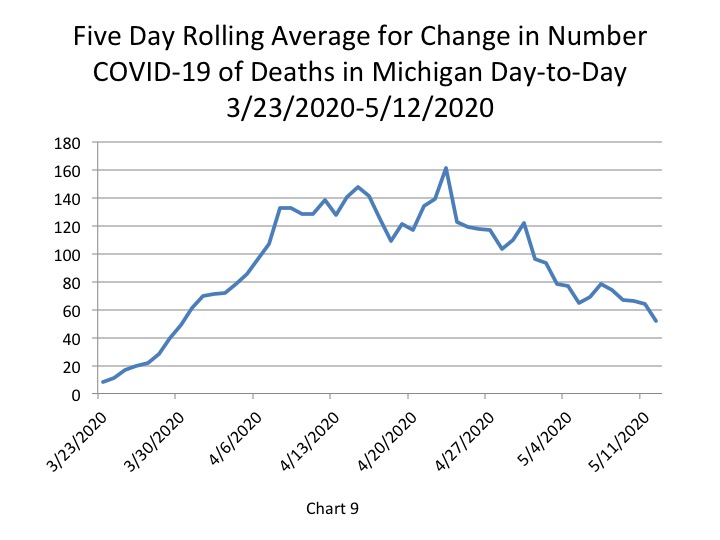
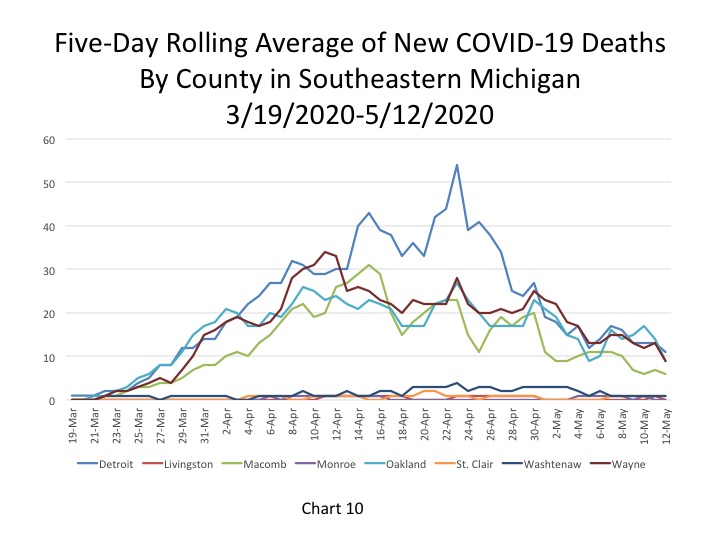
Although the number of daily cases spiked up on May 14, the number of daily deaths continued to decline both statewide and regionally. In Chart 9 we see that the number of daily statewide deaths decreased to 52, and in Chart 10 we see that the number of daily deaths has been declining as well. Chart 10 also shows how the number of deaths in Southeastern Michigan has a large impact on the statewide deaths. Detroit reported the highest number of daily deaths on May 12 at 11, a decline from the 13 daily deaths reported the day prior. These numbers are based on 5-day rolling averages.
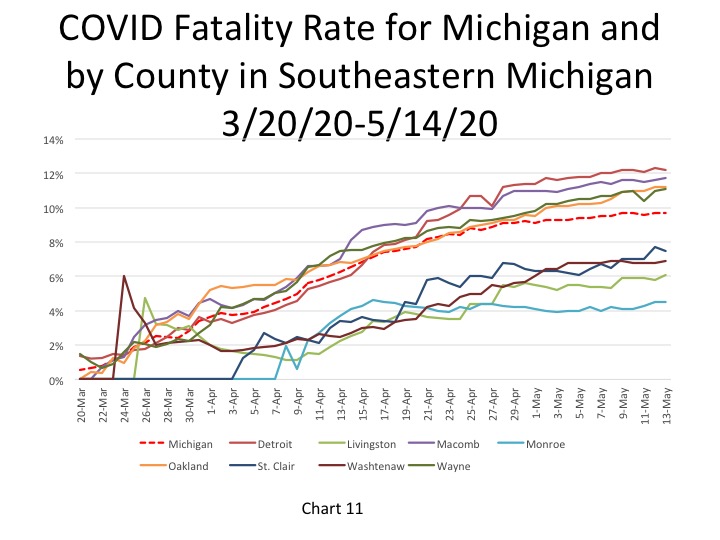
The fatality rate for Detroit was 12.2 percent on May 14 and the State’s rate was 9.7 percent. The fatality rates for Macomb, Oakland and Wayne counties all remained above 11 percent.
One reason we may be seeing such high fatality rates in Michigan is due to the low testing rates. When only having-presumably-a lower of number confirmed COVID cases than is actually likely due to the limited availability of tests, the fatality rate appears higher because the base comparison is smaller than it might be.
On the other hand, there is the possibility that despite increasing numbers of tests, the case fatality rate might remain high. If so, this means COVID-19 is a very lethal disease.
On May 14 the number of daily COVID cases reached the highest its highest point since late April. Although some of the 1,191 daily cases reported are a result of a backlog of case data from Michigan correctional facilities, it also leaves the question as to how many additional cases haven’t been reported. And, while the number of daily deaths continues to decline, a recent New York Times article states that the true number of COVID deaths are highly underreported throughout the Country. In Michigan, we see some signs of this as daily death numbers spike up three times a week due to a comparison of death certificates and COVID databases. But, as the article states, there are certainly even more COVID deaths that aren’t be accounted for any way.
So, as the statewide case and death numbers decline overall, information such as that presented yesterday does highlight how data spikes can happen for several reasons. Not only are backlogged and lack of data and increased testing such reasons, but also if the rate of community spread increases due to people disobeying the Stay-at-Home order.