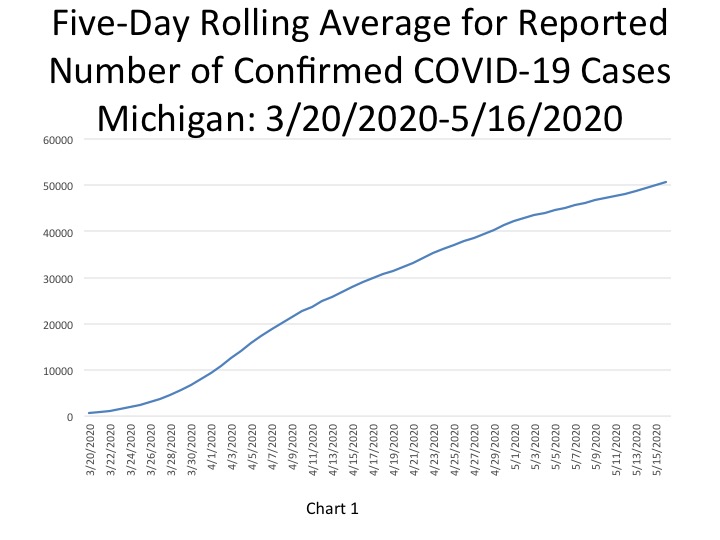
According to the State of Michigan, the total number of COVID cases in Michigan rose to 51,915 on May 18, an increase of 773 cases from the previous day. This total was equivalent to 520 cases per 100,000 people (Chart 4). Of those 773 cases the State reported, 513 were tacked onto the daily total as a result of increased testing in Michigan correctional facilities. Furthermore, of those 773 cases 94 were documented in Southeastern Michigan. The five-day rolling average for the total number of COVID cases (Chart 1) reflects a smoother curve and adjusts for fluctuations in testing and/or the quality of reporting or failure to report. While the curve is smooth, Chart 1 shows that number of cases in Michigan continues to increase, and at higher rates in recent days. However, as noted, at least part of the reason behind the increased rate of growth is due to increased testing, including in Michigan correctional facilities.
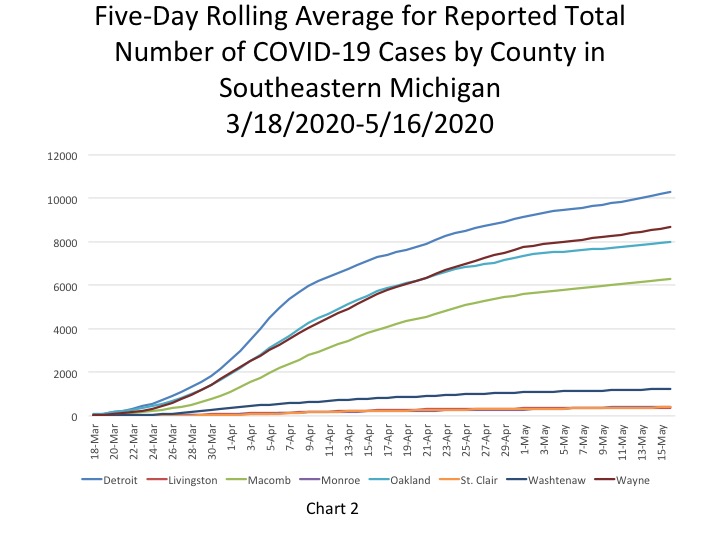
Chart 2 shows that, based on the five-day rolling averages, the growth of new COVID cases in Southeastern Michigan did not increase as fast as Michigan as a whole. Even though the growth rate has declined in Southeastern Michigan the number of cumulative COVID cases remained the highest in Detroit, reaching 10,278 on May 16, with Wayne County following at a reported 8,685 cases. On May 16, the five-day rolling average for the number of COVID cases in Oakland County was 8,012, and Macomb County reported 6,302.
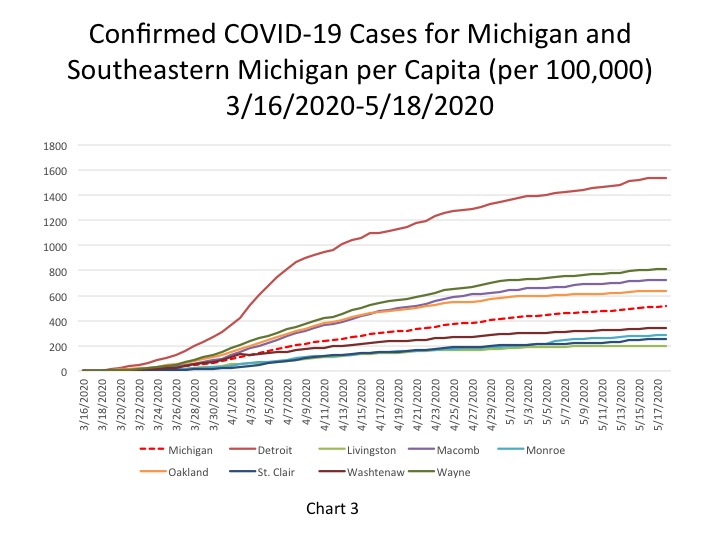
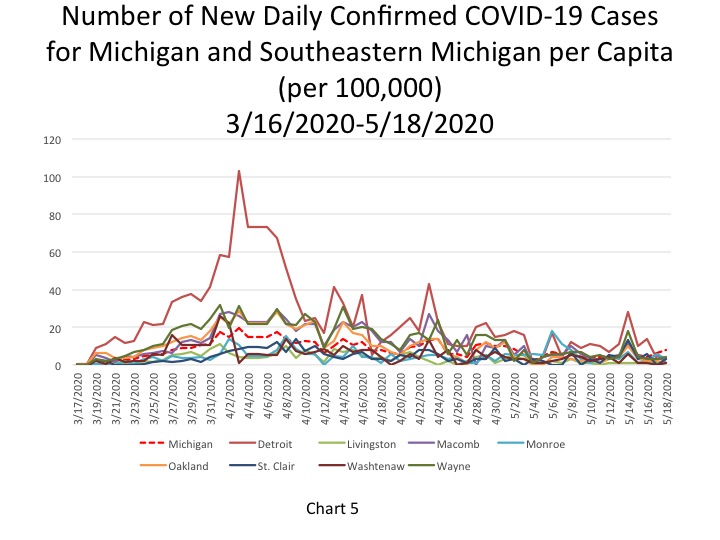
The City of Detroit had 1,541 COVID cases per 100,000 people on May 18, a small increase from 1,538 the day before (Chart 3). This is based upon a reported increase of 20 new COVID cases, bringing the total number of COVID cases in Detroit to 10,368. Wayne County reported 814 cases per 100,000 people, and Oakland County had 640 cases per 100,000 people (the same as it did the day prior). These per capita rates were based upon 8,760 total cases for Wayne and 8,050 for Oakland. Macomb County reported 726 cases per 100,000 people, which is based upon 6,357 cases. As noted earlier, the per capita rates for new COVID cases in Southeastern Michigan did not increase much from the day prior because the majority of new COVID cases reported on May 18 came from Michigan correctional facilities.
The daily data highlighted in these posts is from Michigan.gov/coronavirus, where data is updated daily at 3 p.m. Historical data were supplied from covidtracking.com, which republishes COVID data from the State. Additionally, the case totals do not reflect the number of people who have recovered, just those who have been infected.
According to the State of Michigan, the total number of COVID cases in Michigan rose to 51,915 on May 18, an increase of 773 cases from the previous day. This total was equivalent to 520 cases per 100,000 people (Chart 4). Of those 773 cases the State reported, 513 were tacked onto the daily total as a result of increased testing in Michigan correctional facilities. Furthermore, of those 773 cases 94 were documented in Southeastern Michigan. The five-day rolling average for the total number of COVID cases (Chart 1) reflects a smoother curve and adjusts for fluctuations in testing and/or the quality of reporting or failure to report. While the curve is smooth, Chart 1 shows that number of cases in Michigan continues to increase, and at higher rates in recent days. However, as noted, at least part of the reason behind the increased rate of growth is due to increased testing, including in Michigan correctional facilities.
Chart 2 shows that, based on the five-day rolling averages, the growth of new COVID cases in Southeastern Michigan did not increase as fast as Michigan as a whole. Even though the growth rate has declined in Southeastern Michigan the number of cumulative COVID cases remained the highest in Detroit, reaching 10,278 on May 16, with Wayne County following at a reported 8,685 cases. On May 16, the five-day rolling average for the number of COVID cases in Oakland County was 8,012, and Macomb County reported 6,302.
The City of Detroit had 1,541 COVID cases per 100,000 people on May 18, a small increase from 1,538 the day before (Chart 3). This is based upon a reported increase of 20 new COVID cases, bringing the total number of COVID cases in Detroit to 10,368. Wayne County reported 814 cases per 100,000 people, and Oakland County had 640 cases per 100,000 people (the same as it did the day prior). These per capita rates were based upon 8,760 total cases for Wayne and 8,050 for Oakland. Macomb County reported 726 cases per 100,000 people, which is based upon 6,357 cases. As noted earlier, the per capita rates for new COVID cases in Southeastern Michigan did not increase much from the day prior because the majority of new COVID cases reported on May 18 came from Michigan correctional facilities.
The daily data highlighted in these posts is from Michigan.gov/coronavirus, where data is updated daily at 3 p.m. Historical data were supplied from covidtracking.com, which republishes COVID data from the State. Additionally, the case totals do not reflect the number of people who have recovered, just those who have been infected.
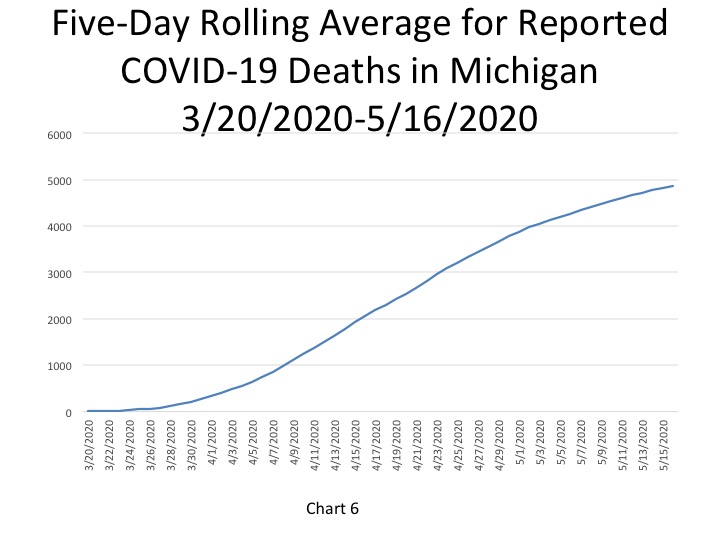
In Chart 6, the five-day rolling average for the number of deaths in Michigan shows a continuing slow increase (a lagged number of 4,860 deaths, an increase of 40 deaths). The actual reported COVID-19 deaths reached 4,915 on May 18, an increase of 24 deaths from the day prior. Of those 24 additional deaths Southeastern Michigan accounted for 15 of them.
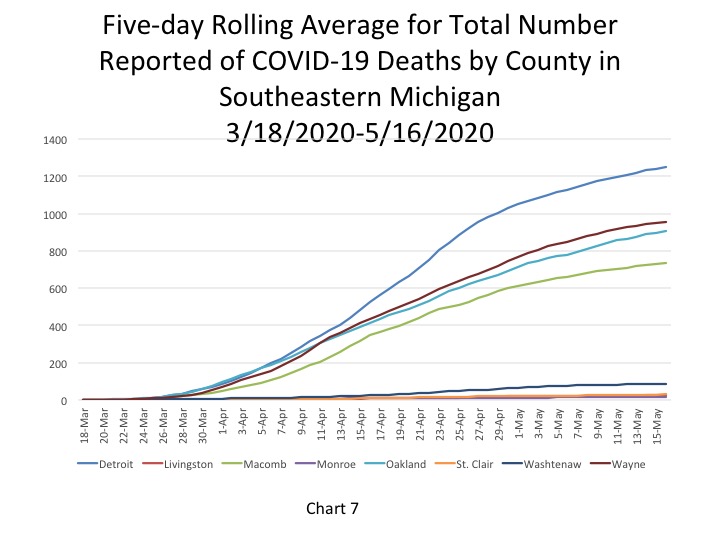
Chart 7 (a 5-day rolling average) portrays how the total number of COVID deaths in Southeastern Michigan continues to level off, with Detroit reporting the highest cumulative number of deaths at 1,249 on May 16. Wayne County had the second highest total at 956 on May 16.
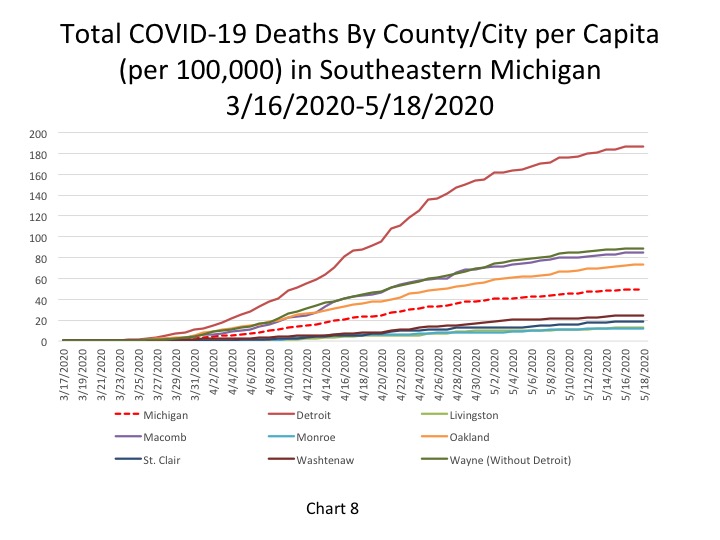
Chart 8 portrays the total number of COVID deaths per 100,000 people, all of which remained the same for the State, Detroit and the seven counties in Southeastern Michigan from May 17 to May 18. As of May 18, the cumulative total of COVID deaths per 100,000 people in Detroit was 187 (representing 1,260 deaths). In Wayne County there were 89 COVID deaths per 100,000 people (966 total deaths), in Oakland County there were 73 deaths per 100,000 people (913 total deaths), and in Macomb County there were 85 COVID deaths per 100,000 people (740 total). The State of Michigan had 49 COVID deaths per 100,000 people. Wayne County had the highest single day death count in Southeastern Michigan on May 18; 8 COVID deaths were reported.
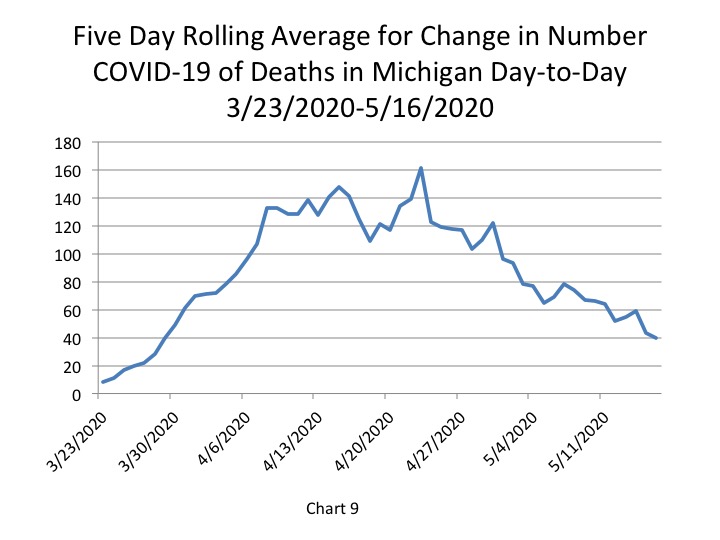
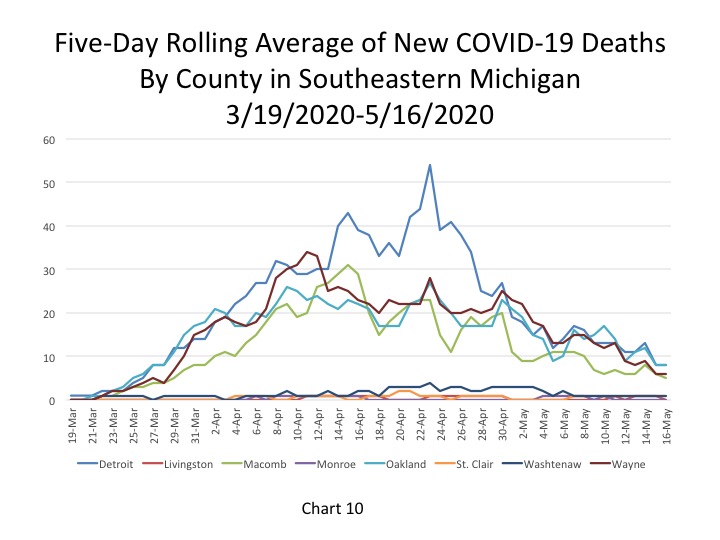
In Chart 9 we see that the number of daily statewide deaths decreased slightly to 40 on May 16. Chart 10 shows how the number of deaths in Southeastern Michigan has been decreasing, however the region still makes up majority of the deaths in the State. On May 16, of the 40 new deaths reported 29 were reported out of Southeastern Michigan. Detroit and Oakland County each reported 8 daily COVID deaths, both of which reported the same number of deaths the day prior. Both Oakland County and Detroit also reported the highest number of daily deaths on May 16, as they did the day before. These numbers are based on 5-day rolling averages.
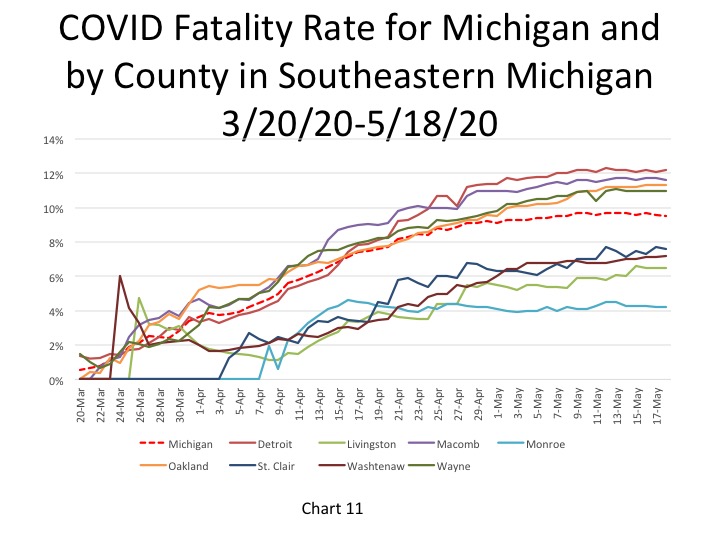
The fatality rate chart below shows that the rates in Southeastern Michigan and across the State are starting to level off. On May 18 Detroit reported a fatality rate of 12.2 percent. Detroit has been reporting a fatality rate between 12-12.2 percent since May 10. The State reported a fatality rate of 9.5 percent; the last time this rate was reported was May 7.
One reason we may be seeing such high fatality rates in Michigan is due to the low testing rates. When only having-presumably-a lower of number confirmed COVID cases than is actually likely due to the limited availability of tests, the fatality rate appears higher because the base comparison is smaller than it might be.
The number of average daily COVID deaths in Michigan continues to decline, but we once again saw a spike in the number of new COVID cases. These recent spikes in daily death numbers have been a result of increased testing and backlogged data in Michigan’s correctional facilities. Although this data comes from one specific sector it does leave the question as to how many cases have been underreported in Michigan.