Throughout this series on data for felony offenders sentenced in Southeastern Michigan we’ve focused on the percentage of offenders sentenced to prison, jail, a combination of jail and probation, or probation. This post allows us to further examine what trends there may be in sentencing in each of the seven counties. This data was provided by the Michigan Department of Corrections and focuses on years 2011 and 2017; the data prior to 2011 was reported differently and therefor not included.
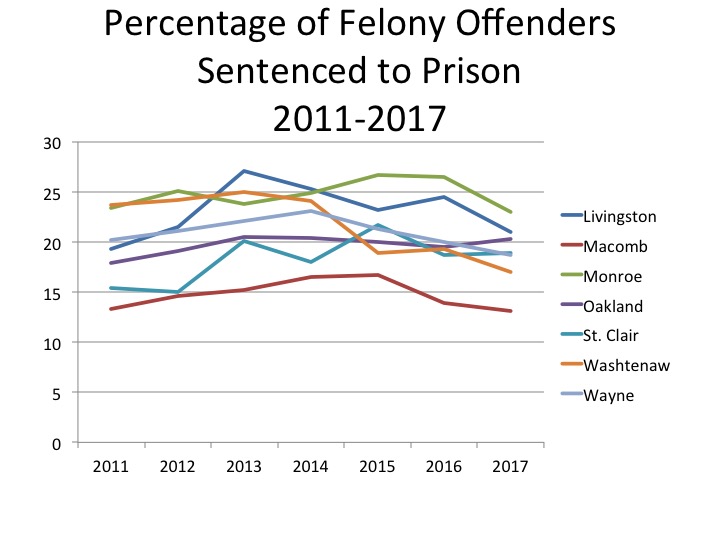
The first chart below shows how Macomb County has consistently had the lowest percentage of felony offenders sentenced to prison since 2011, and that percentage has been decreasing in recent years. Similar to Macomb County, most of the other counties in the region have recently experienced a decrease in the percentage of felony offenders sentenced to prison. Washtenaw County experienced the largest decrease in felony offenders sentenced to prison between 2011 and 2017; that percentage decreased from 23.7 percent to 18 percent. In that same time frame Oakland and St. Clair counties both experienced increases in the percentage of felony offenders sentenced to prison. For Oakland County the percentage increased from 19 percent to 20.1 percent and for St. Clair County the percentage increased from 15.4 percent to 18.7 percent.
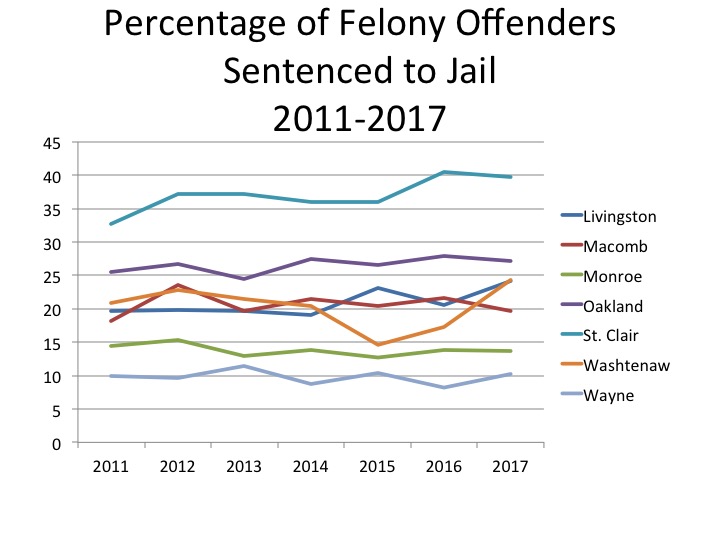
The chart below shows the percentage of felony offenders sentenced to jail in Southeastern Michigan between 2011 and 2017. Consistently in this time frame, St. Clair County sentenced the highest percentage of offenders to jail and Wayne County sentenced the lowest percentage of offenders. In St. Clair County there has been a slow increase in the percentage of offenders sentenced to jail, from 32.7 percent in 2011 to 39.7 percent in 2017. There has also been an increase in the percentage of offenders sentenced to jail in Livingston County between 2011 and 2017; there was an increase from 20.8 percent to 24.3 percent. None of the counties have seen an overall decrease in the percentage off felony offenders sentenced to jail since 2011, with the exception of Monroe County. In 2011 14.4 percent of felony offenders were sentenced to jail in Monroe County and in 2017 that number decreased to 13.7 percent.
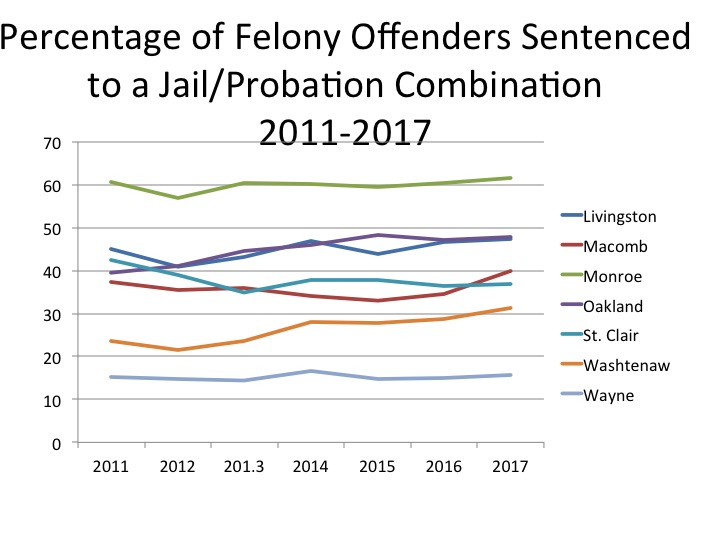
The chart below shows that Monroe County has consistently had the highest percentage of felony offenders sentenced to a jail/probation combination since 2011. The chart also shows that Washtenaw and Oakland counties have been increasing the percentage of felony offenders they’ve sentenced to a jail/probation combination. In 2011, 23.6 percent of felony offenders in Washtenaw County were sentenced to the jail/probation combination and by 2017 that number increased to 31.3 percent. For Oakland County, 39.5 percent of the felony offender population was sentenced to a jail/probation combination and by 2017 that number increased to 47.8 percent.
Wayne County consistently sentenced the lowest percentage of offenders to the jail/probation combination between 2011 and 2017.
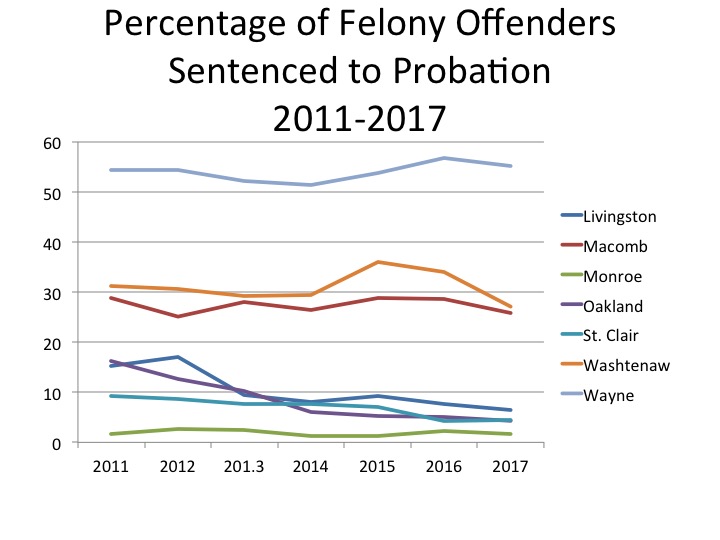
The probation chart below shows several patterns, the first being that Wayne County has consistently sentenced the highest percentage of felony offenders to probation since 2011. Not only has Wayne County consistently sentenced the highest percentage of offenders to probation, but this sentencing form also has the largest difference between the county with the highest sentencing percentage (Wayne) and the lowest (Monroe County).
Oakland County experienced the largest decrease in the percentage of offenders sentenced to probation between 2011 and 2017. In 2011, 16.3 percent of felony offenders were sentenced probation and by 2017 that number decreased to 4.5 percent. Livingston County also experienced a decrease, from 16.3 percent to 6.4 percent. Macomb, St. Clair and Washtenaw counties also experienced minor decreases in the percentage of felony offenders sentenced to probation.
Overall, this post highlights •A decrease in the percentage of felony offenders sentenced to probation; •A general decrease in the percentage of felony offenders sentenced to prison; •General increases in the percentage of felony offenders sentenced to jail and a jail/probation combination.
Additionally, these charts highlight the trends counties tend to adhere to in sentencing. This is helpful in understanding what counties’ criminal justice priorities are and where the may money to fund the criminal justice system in each county is flowing.
Finally, this post highlights that counties follow strikingly different strategies relative to corrections, demonstrating how the criminal justice system in this state is fragmented.