- The unemployment rate across the state remained stagnant while the rate in the city of Detroit decreased (monthly);
- Regionally, Washtenaw County had the lowest unemployment rate;
- The number of employed Detroit residents dipped, but increased on an annual basis, (monthly);
- The Purchasing Manager’s Index for Southeastern Michigan remains strong, and is expected to grow in 2017(monthly);
- The Commodity Price Index remained at 50 (monthly);
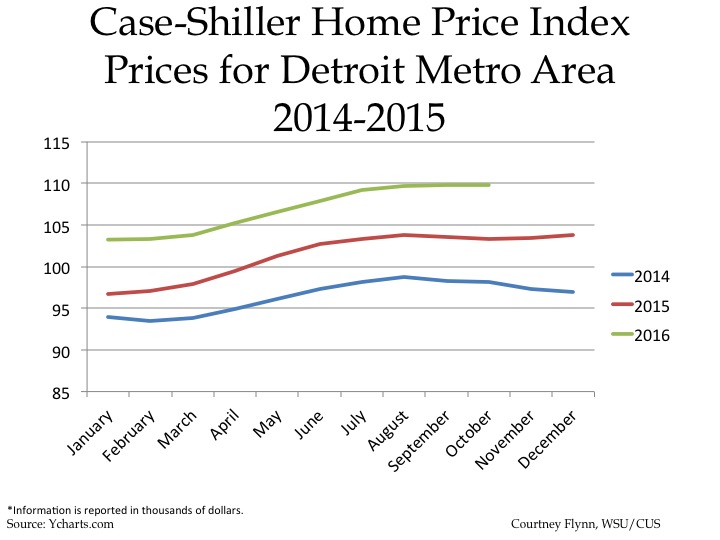
- The Standard and Poor’s Case-Shiller Home Price Index for the Detroit Metropolitan Statistical Area shows home prices continue to increase monthly and annually.
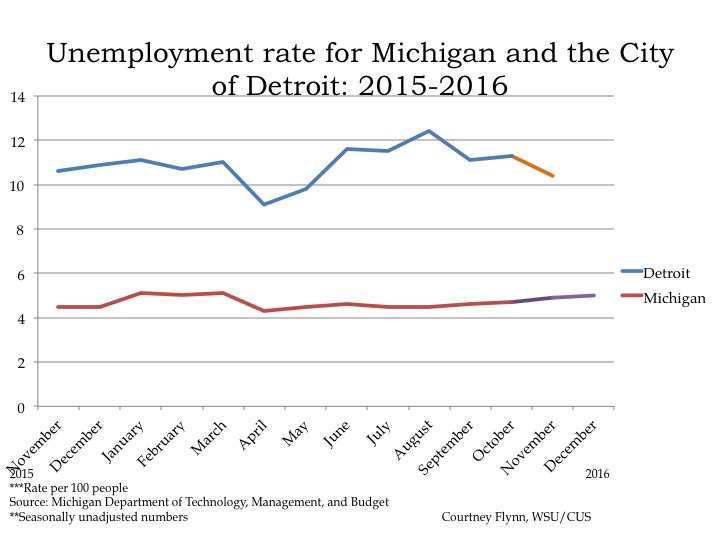
According to the most recent data provided by the Michigan Department of Technology, Management and Budget, the unemployment rate for the State of Michigan slightly increased to 5 in December of 2016 from 4.9 the previous month. Unemployment in the City of Detroit decreased though, from to 11.3 in October to 10.4 in November (December data was not yet available). The November unemployment rate for Detroit in 2016 was 0.2 points lower than it was in November of 2015.
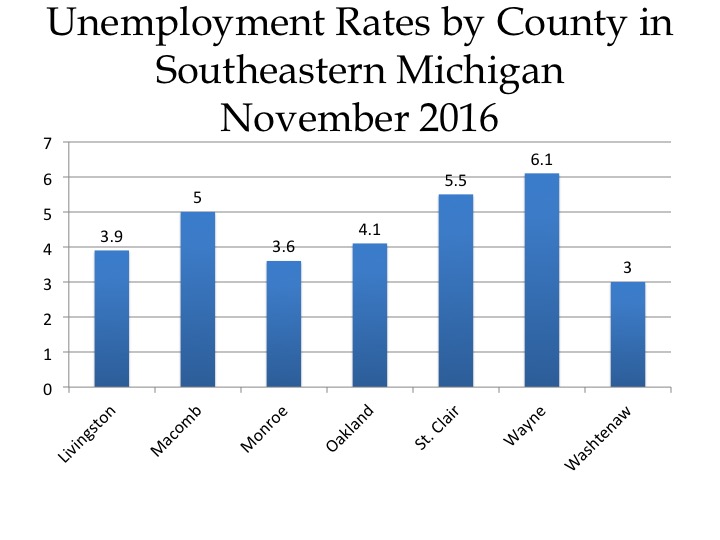
The chart above displays the unemployment rates for each of the seven counties in Southeastern Michigan for November of 2016. Wayne County had the highest rate at 6.1 while Washtenaw County had the lowest at 3. Not only did Washtenaw County have the lowest rate in the region, but it also had the lowest rate in the state (Ottawa County in Michigan also had a 3 point unemployment rate). Second to Wayne County, in the region, came St. Clair County with an unemployment rate of 5.5
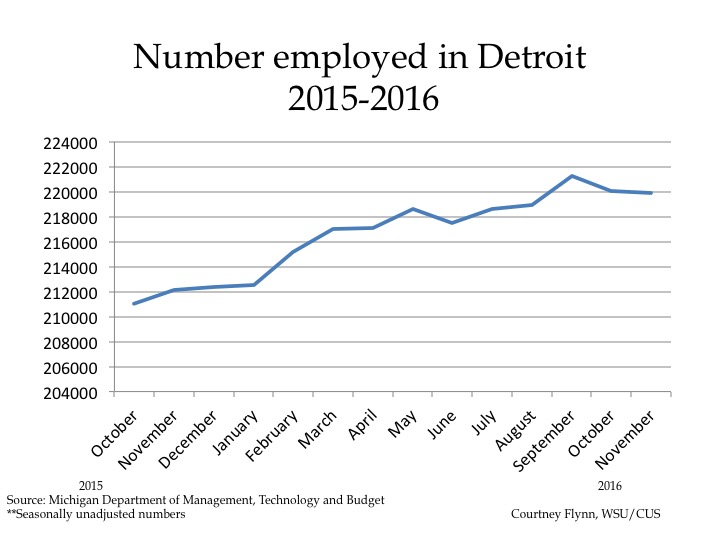
In November of 2016 the number of employed Detroit residents decrease to 219,867, a small drop from the 220,033 employment number in October. Between November of 2016 and November of 2015 there was a total increase of 7,759 employed Detroit residents, according to the Michigan Department of Technology, Management and Budget.
Between October and November the labor force in Detroit decreased by about 2,700. In October the labor force was reported to be 248,042 and in November it was reported to be 245,328.
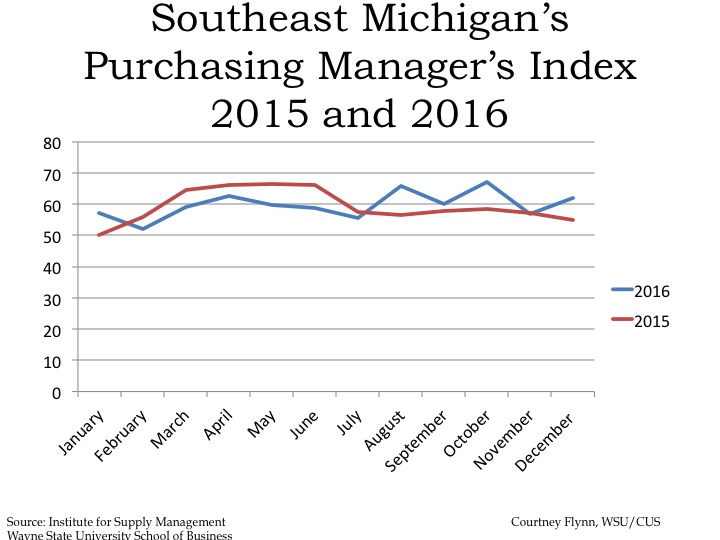
The Purchasing Manger’s Index (PMI) is a composite index derived from five indicators of economic activity: new orders, production, employment, supplier deliveries, and inventories. A PMI above 50 indicates the economy is expanding.
According to the most recent data released on Southeast Michigan’s Manager’s Index, the PMI for December 2016 was 61.9, an increase of 4.8 points from the prior month. The December 2016 PMI was an increase of 6.1 from the previous year. The PMI is considered to be strong, and expected to continue to grow into 2017, according to the Southeast Michigan’s Manager’s Index. This growth is expected, in part, because of an increased production index and growth in the labor market.
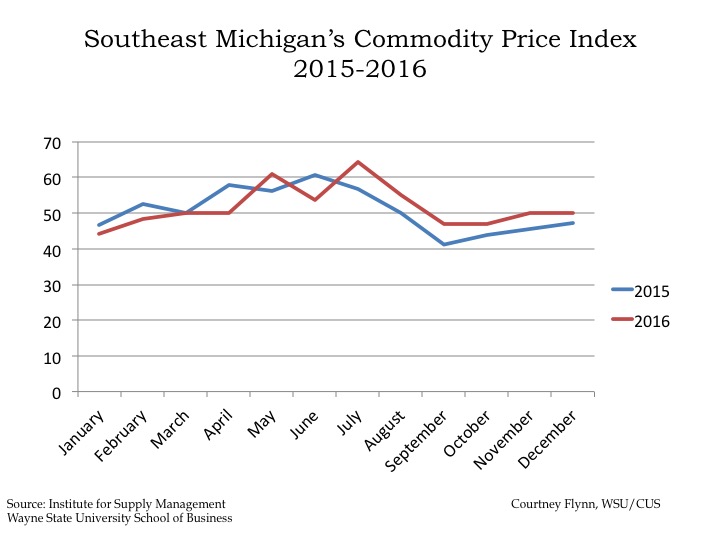
The December 2016 Commodity Price Index remained unchanged at 50 points between November and December. However, it increased 2.8 points from December of 2015. The three month average for the Commodity Price Index was 49.