According to the 2024 March of Dimes Report Card for Michigan, the preterm birth rate for the State of Michigan improved between 2022 and 2023 but worsened in the City of Detroit and Macomb, Washtenaw and Wayne counties. “Preterm birth” refers to infants who are born prior to 37 weeks of gestation. As shown in the image below, Detroit received an F grade and had the worst rate of the 100 U.S. cities with the most live births at 15.6 percent in 2023.

Earlier data provided by the Michigan Department of Health and Human Services through 2021, also shows that preterm births for Detroit and Macomb, Washtenaw and Wayne counties has been increasing in recent years. However, since 2000, the percent of preterm births in five of the counties in the region has increased. This earlier data shows that preterm births in Detroit were recorded at 12.9 percent in 2021. Detroit has consistently had the highest percentage of preterm births in the region, and the state. And, as noted above, Detroit had the worst preterm rate of the 100 U.S. cities with the most live births at 15.6 percent in 2023.
Oakland and Wayne (excluding Detroit) counties also experienced slight decreases in the percentage of preterm births between 2000 and 2021.
Among birthing people, the most common factors associated with preterm births are smoking, hypertension, diabetes and an unhealthy weight. Environmental pollution resulting in poor air quality, climate change impacts such as extreme heat, and exposure to contaminants in drinking water have also been linked to increased preterm births. Leaking underground storage tanks (USTs), introduced in a previous post, can be a significant source for pollutants such as volatile organic compounds (VOCs) spreading through the soil and impacting drinking water sources.
Researchers affiliated with the WSU Center for Leadership in Environmental Awareness (CLEAR) are studying the impacts of VOCs on preterm birth, testing the hypothesis that VOCs traveling through the soil may be related to VOC levels in homes. The CLEAR project teams are investigating the levels of VOC contamination in the air in homes, in plants and their water sources and in the soil, establishing innovative monitoring and remediation strategies, modeling the effects of VOC exposure on zebrafish and placental mammals to unveil ways to reduce preterm births in humans, and measuring the association of VOCs with preterm births in the human population in Detroit.
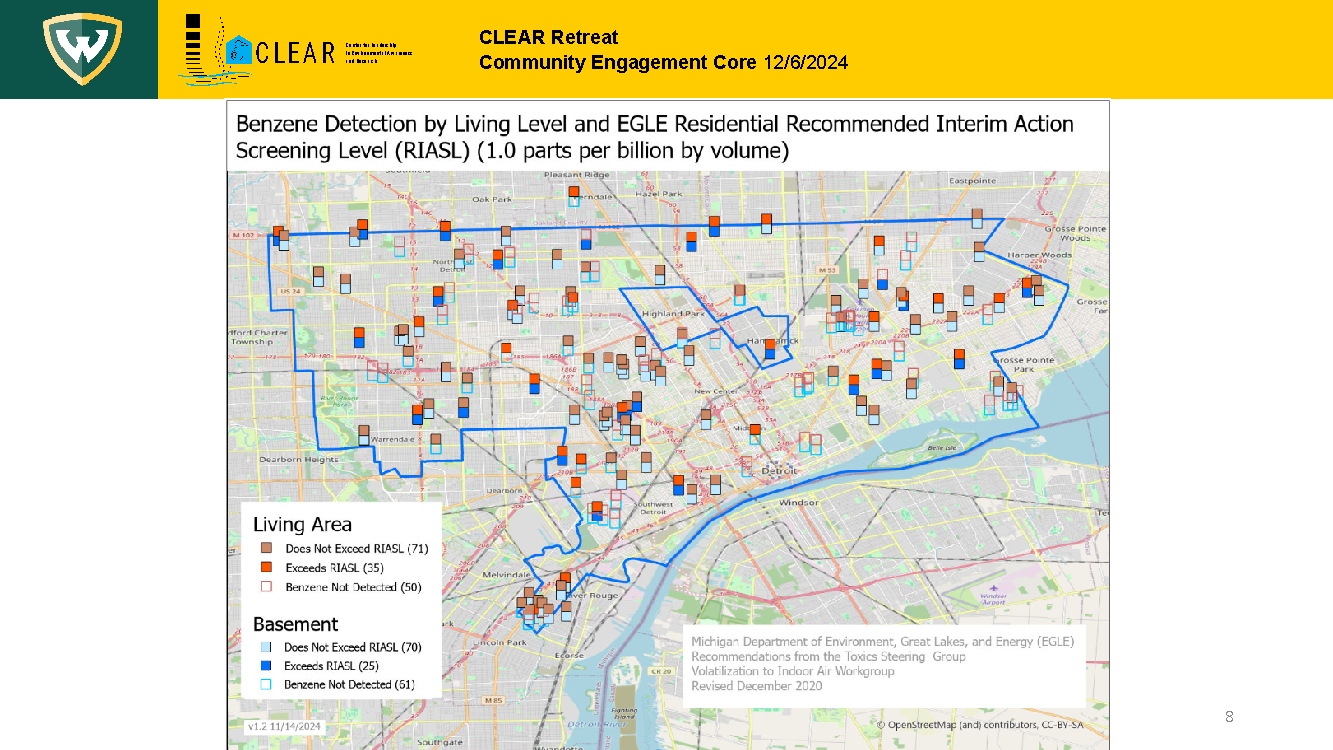
The map below presents preliminary evidence of VOCs, in particular, benzene in homes in Detroit, based on testing by CLEAR. Benzene is a colorless chemical that is often a liquid or, at room temperature, a gas. It smells sweet, but it can be a human carcinogen when people are exposed over the long-term. Over the short term it can cause nausea, dizziness and headaches. It is also one of the chemicals that CLEAR is assessing relative to preterm births. Benzene, as a vapor, can intrude into homes from underground. Smoking can also produce benzene in a home.
Another research team at WSU) is currently investigating the possible indirect link between exposure to PFAS, resulting bacterial infections, and preterm birth. According to a synopsis of the Wayne State University PFAS-Pre-term Birth Study, the forthcoming research will focus on the “placenta as a major target of PFAS toxicity.” The placenta is a maternal organ that provides nutrients from the mother’s blood and passes them to the baby’s blood through the umbilical cord. The Wayne State Study will examine different regions of the placenta to see which cell types are affected by the PFAS.
Due in part to this research, the risks associated with human exposure to VOCs and PFAS contamination have been made more public in recent years. However, many remain unaware of the potential hazards posed by leaking underground storage tanks (USTs) on water quality, and thus on human health (Marcus, 2021)
According to a 2021 study conducted by Vanderbilt University professor Michelle Marcus focused on sites in Pennsylvania, Florida, and New Jersey, exposure to a leaking UST while pregnant increased the probability of preterm births by between 7 and 8 percent. Marcus also found that the probability of exposure dropped by 16.5 percent after the Environmental Protection Agency (EPA) developed regulations mandating that owners of USTs protect against spills, overfilling, and corrosion.
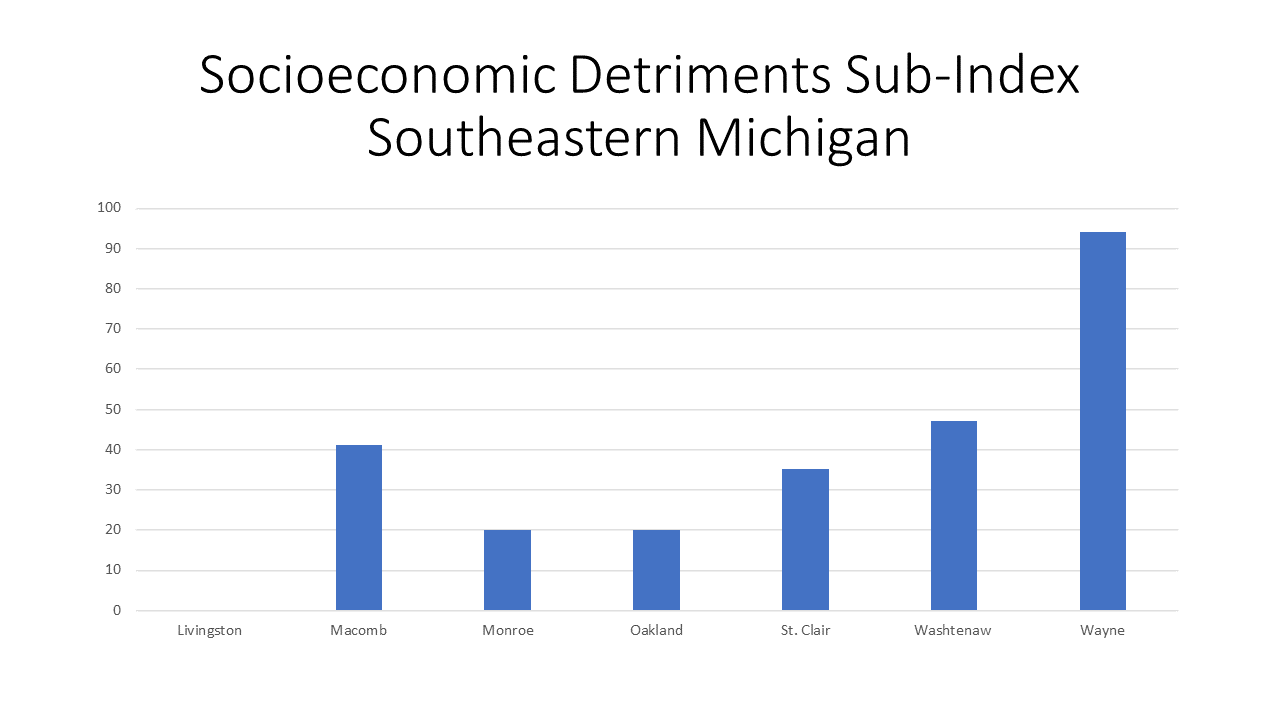
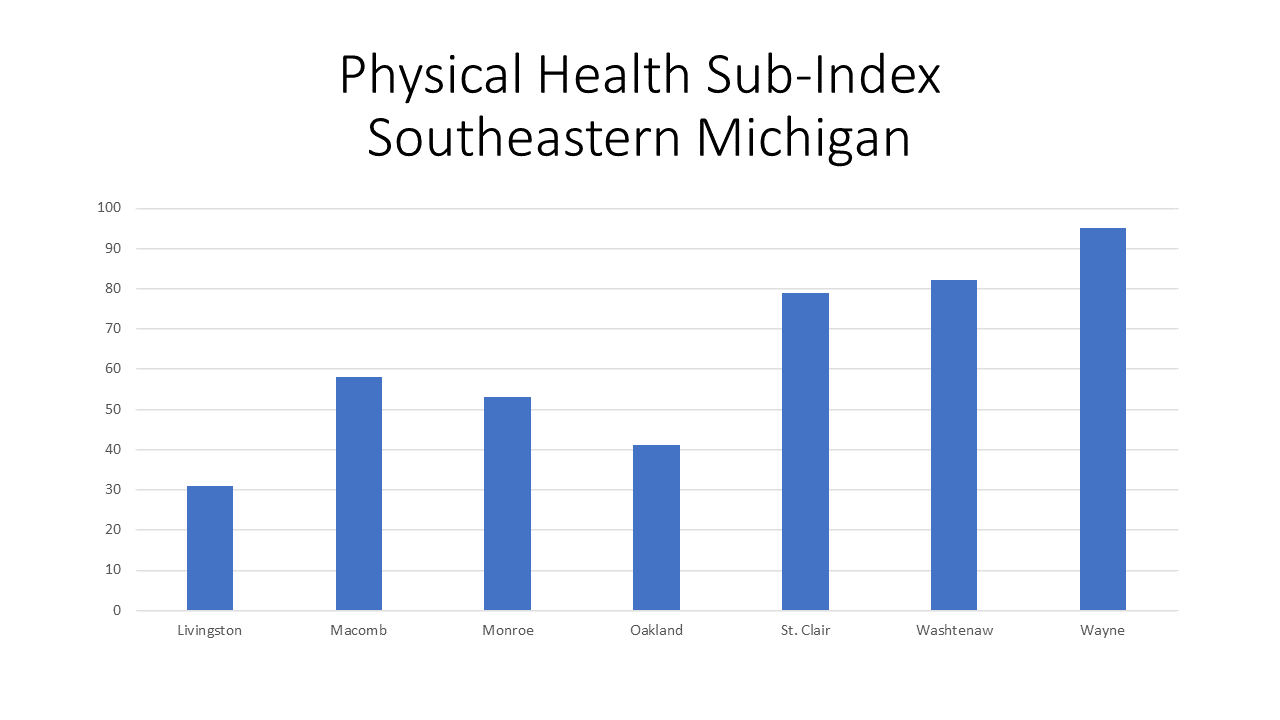
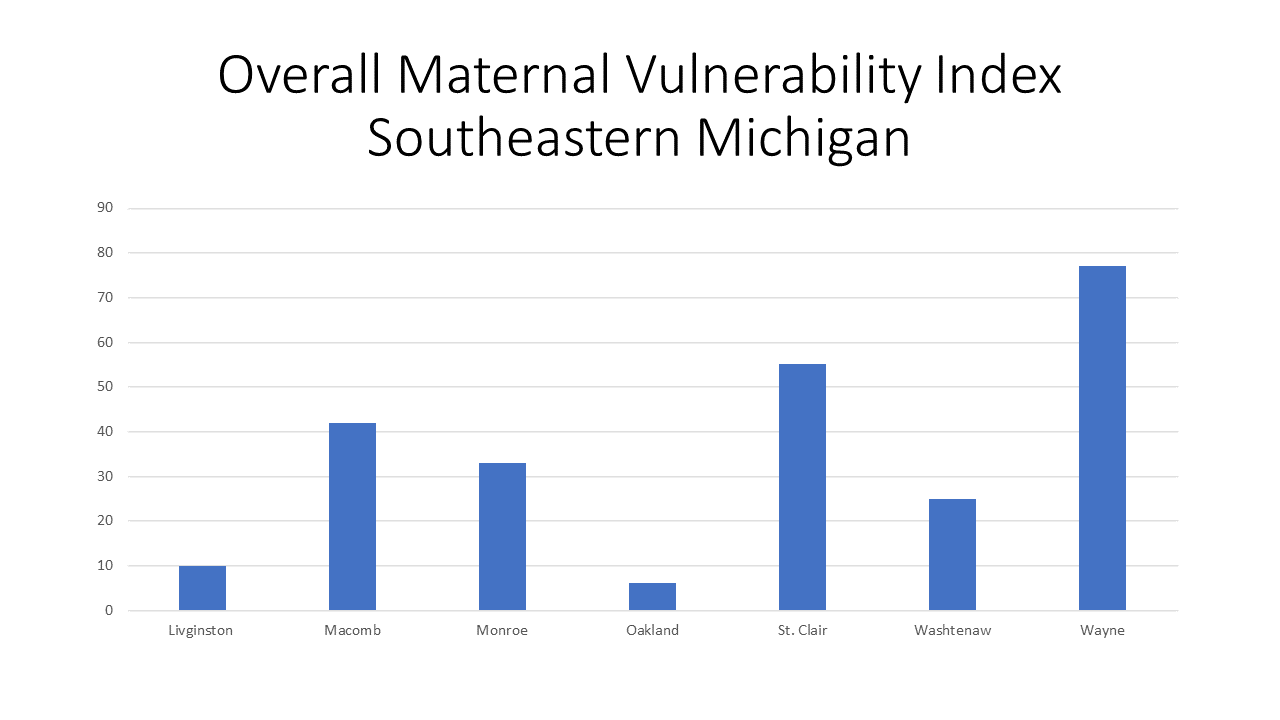
Both individual and environmental factors associated with preterm births are likely more severe for those with greater levels of social vulnerability. Communities at or above the 90th percentile for density of active USTs and releases are considered “disadvantaged,” according to the federal government’s Climate and Economic Justice Screening Tool. The Southeast Michigan Council of Governments (SEMCOG) provides an interactive map of these areas, which are concentrated primarily in Detroit and other urbanized census tracts in the metropolitan area.
Continued study is needed to determine just how much of a factor leaking USTs might play in Detroit’s high preterm birth rate. Going forward, this will first require that leaks and releases be identified in the most vulnerable census tracts and that this information be disseminated to nearby residents. Marcus (2021) found in her study that birthing people living closest to USTs were more likely to be younger, non-white, and less educated. The EPA has developed guidelines for states on how to tailor engagement with residents about leaking USTs, but local governments with closer ties to neighborhoods should also communicate about the risks of exposure.
Academic References
Marcus, M. (2021). Going beneath the surface: Petroleum pollution, regulation, and health. American Economic Journal: Applied Economics, 13 (1), 1–37. https://doi.org/10.1257/app.20190130