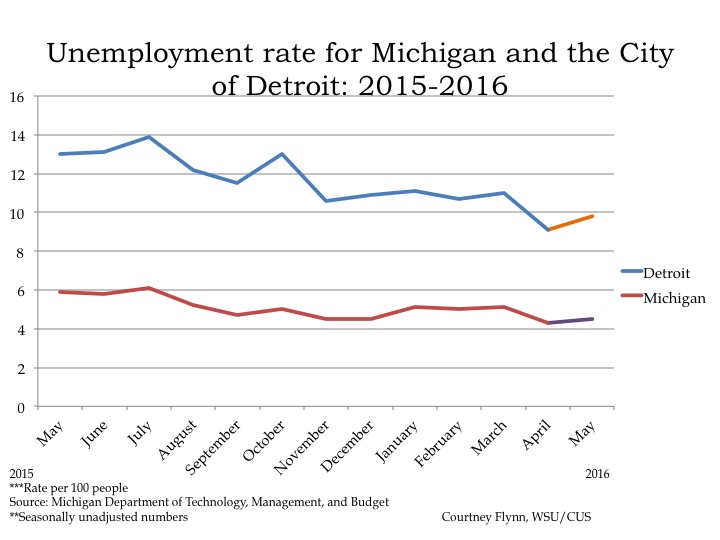
- The State and City of Detroit’s unemployment rates decreased at the monthly and annual levels;
- Regionally, August 2018 unemployment rates are lower than the prior year, with the exception of Macomb and Wayne counties;
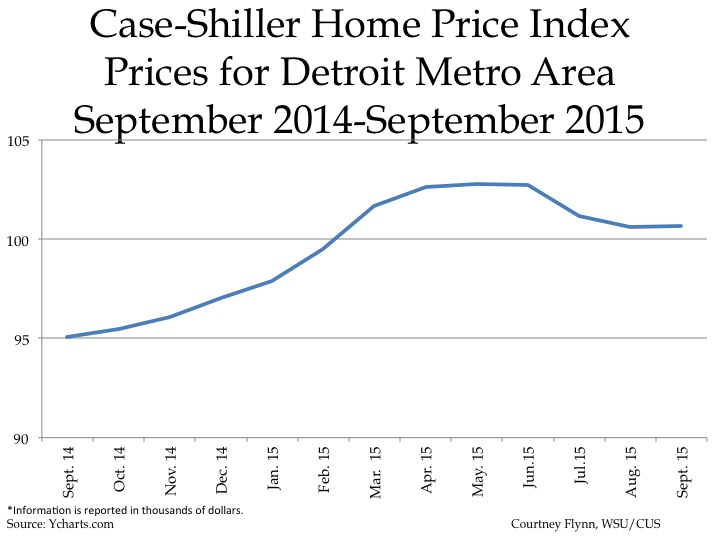
- Housing prices continue to rise in Metro-Detroit.
- New building permits being pulled regionally decreasing
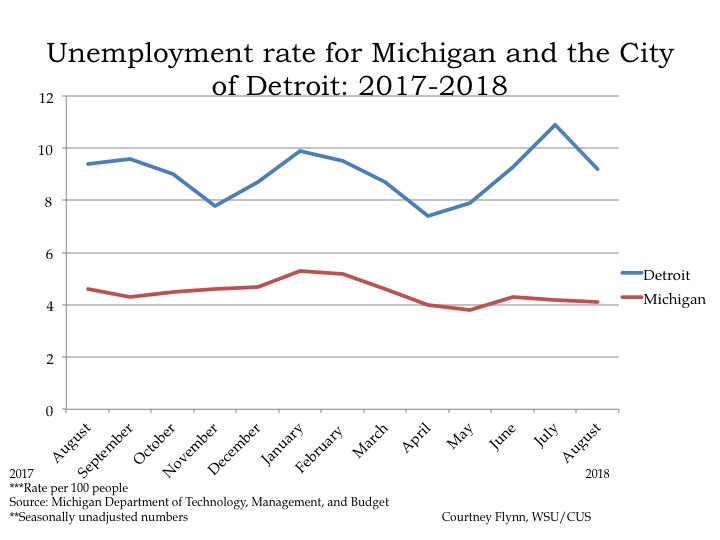
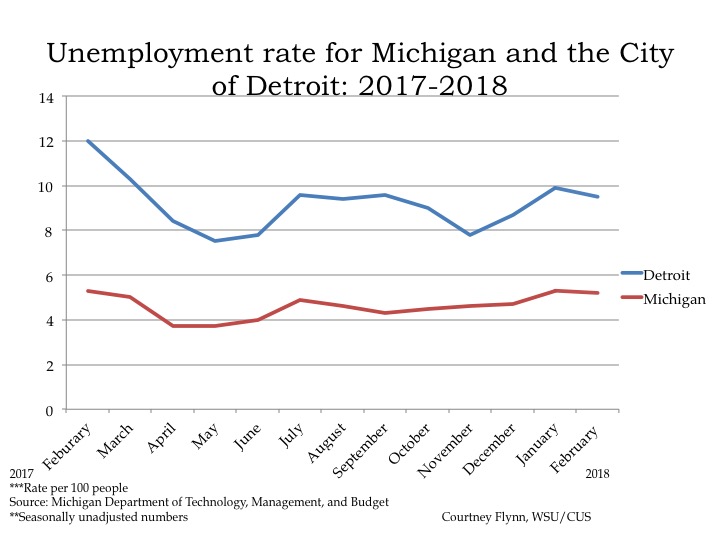
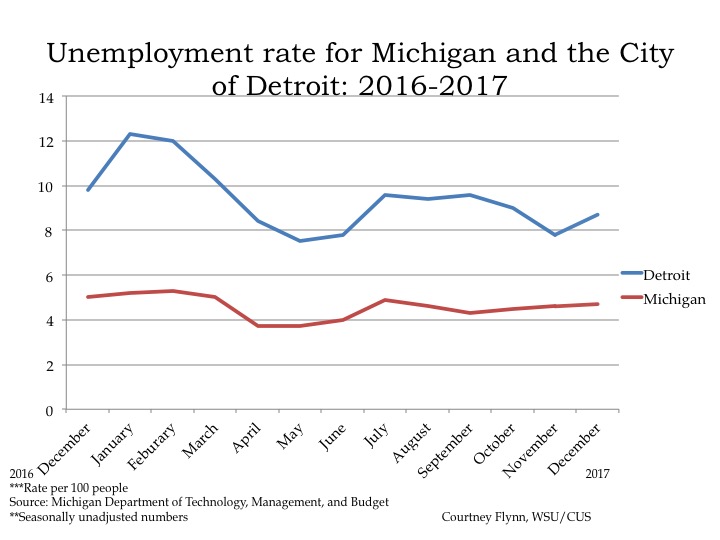
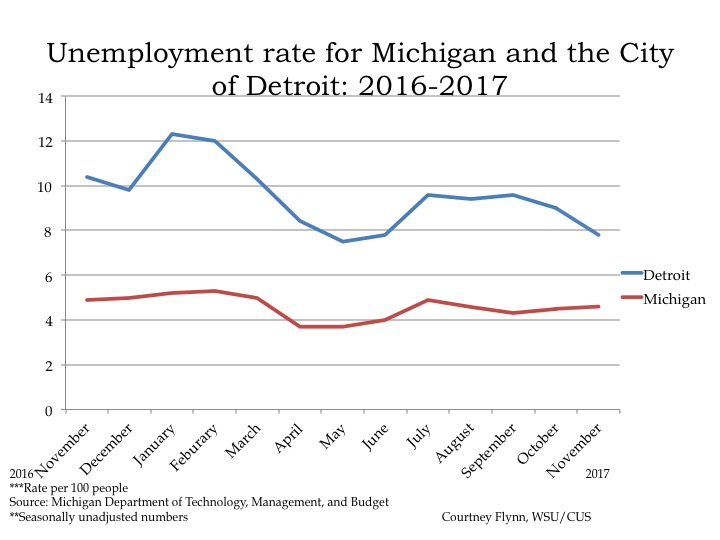
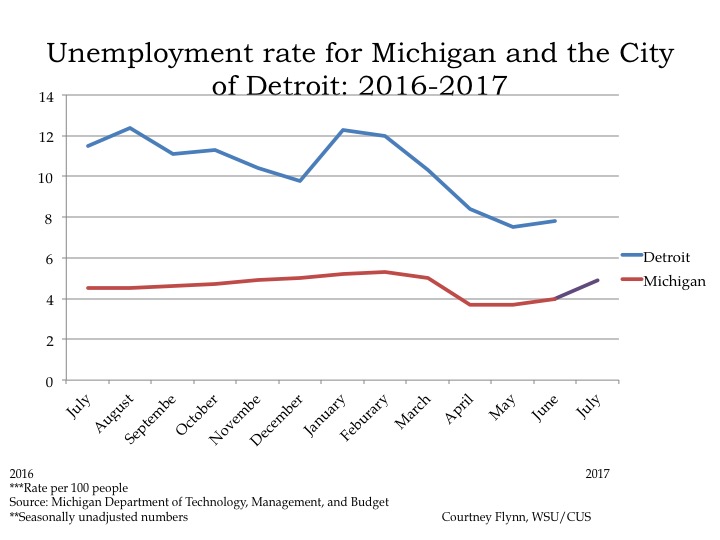
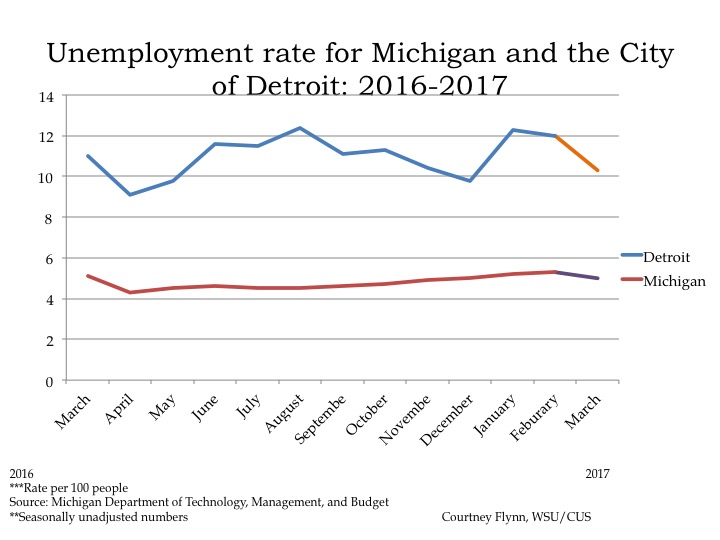
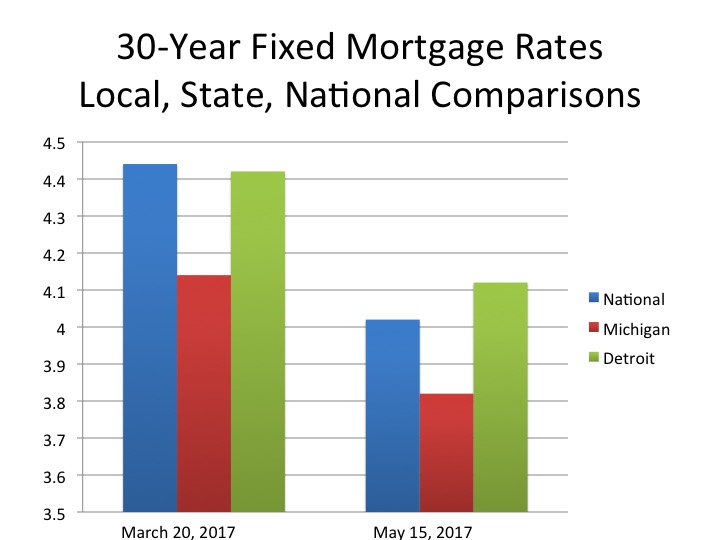
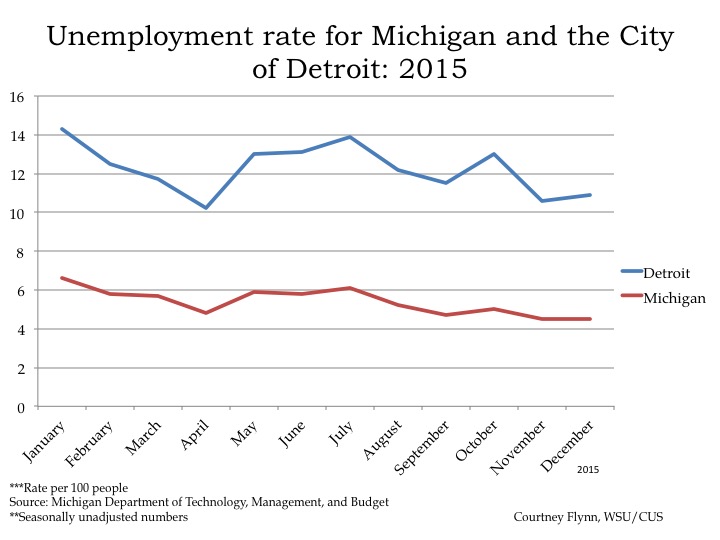
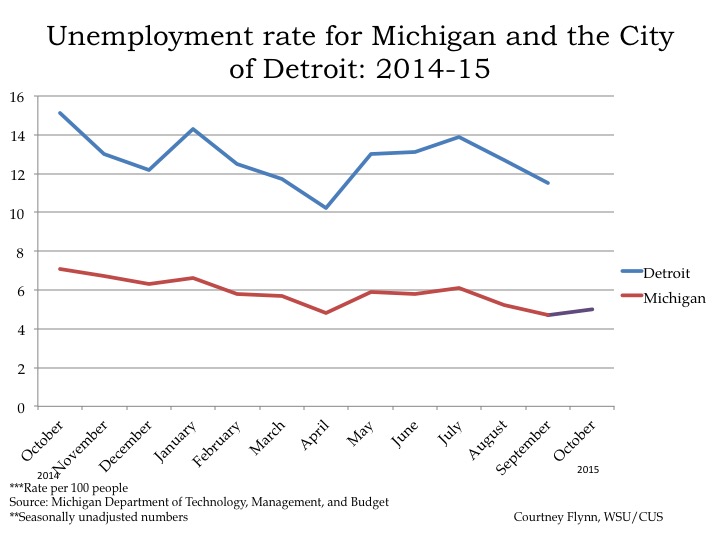
In August of 2018 the unemployment rate for the State of Michigan was 4.1, a small decrease from the July unemployment rate of 4.2, according to the most recent data provided by the Michigan Department of Technology, Management and Budget. The State unemployment rate for August of 2017 was 0.5 points above what it was in August of 2018.
The Detroit rate was 0.2 points lower in August of 2018 than in August of 2017. Also, the August 2018 unemployment rate for Detroit was 1.7 points lower than what it was the previous month (July 2017).
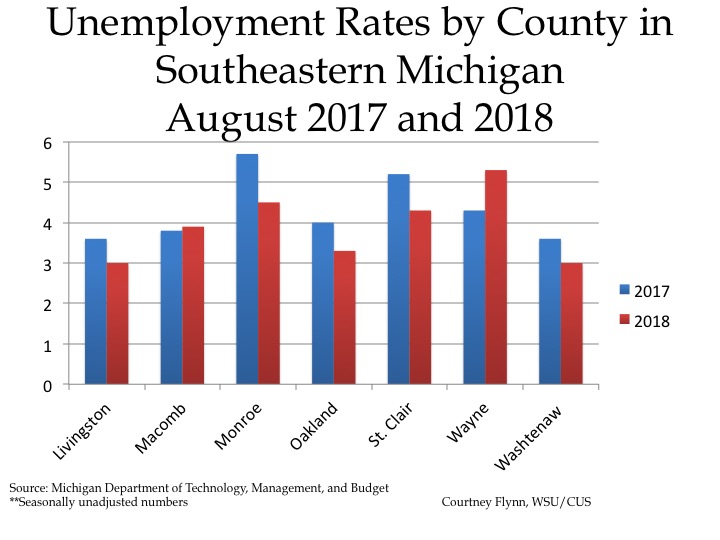
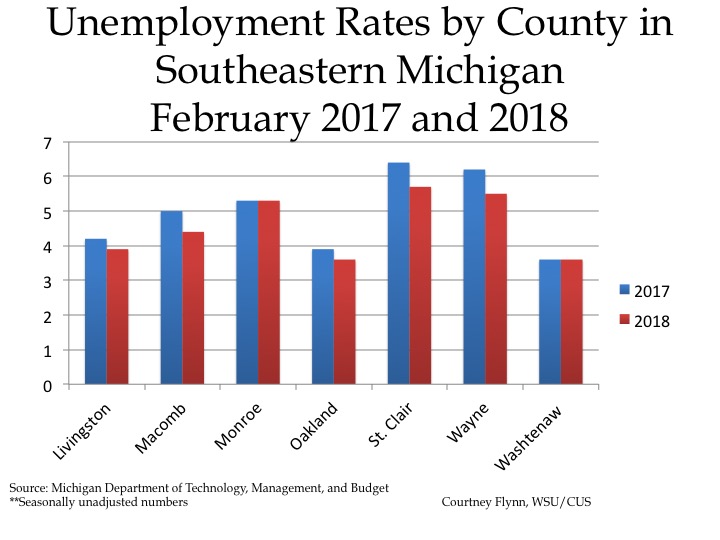
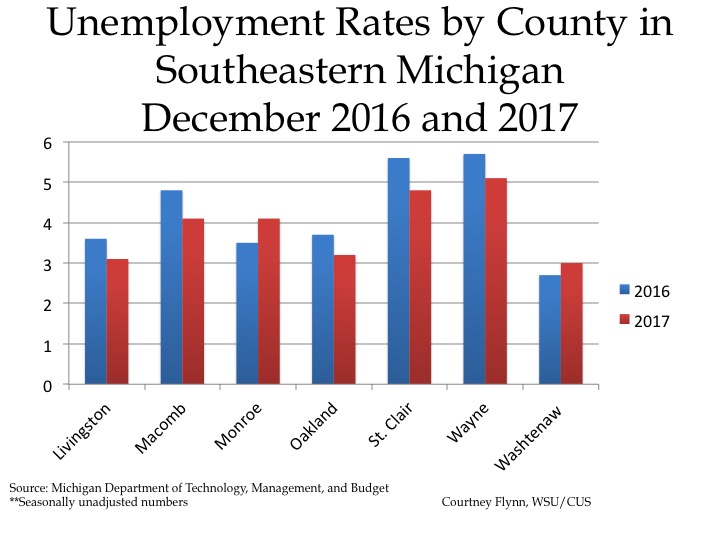
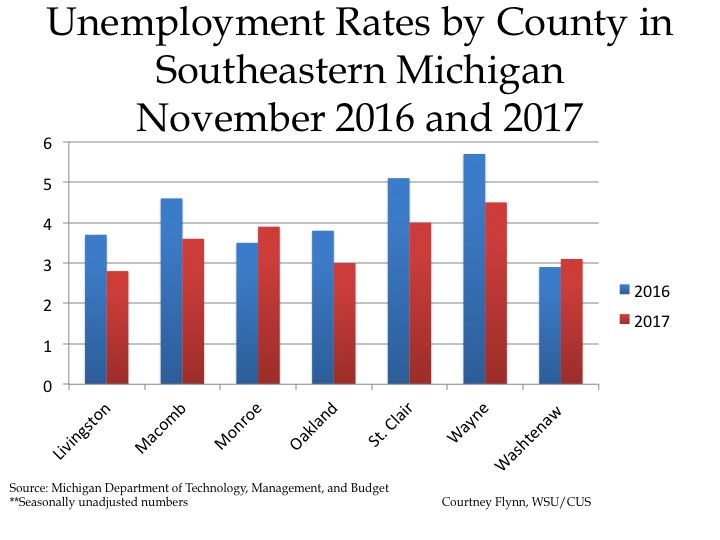
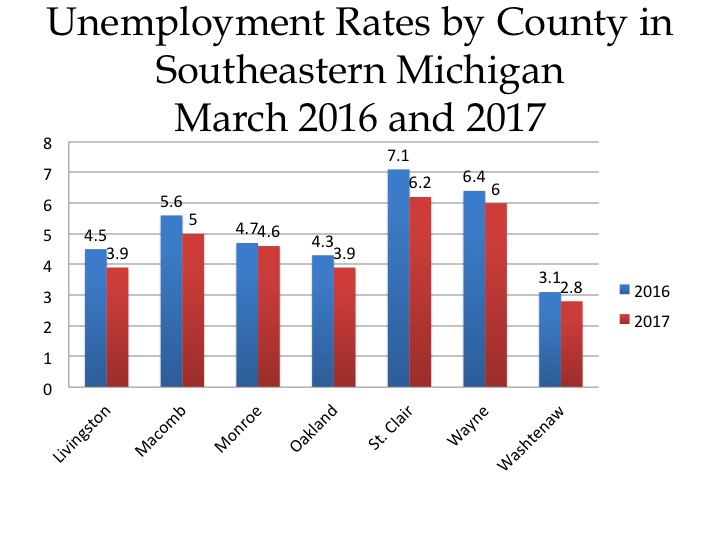
The chart above displays the unemployment rates for each of the seven counties in Southeastern Michigan for August of 2017 and 2018. In August of 2018 Wayne County had the highest unemployment rate at 5.3, with Monroe County having the second highest regional unemployment rate 4.5. These two counties were the only two in the region to have unemployment rates at or above 4.5 in August of 2018. Conversely, Oakland, Washtenaw and Livingston counties all had unemployment rates at or below 3.5 in August of 2018.
Regionally, Livingston County had the lowest unemployment rate in August of 2018 at 3. Livingston County also had the lowest unemployment rate in August of 2017 at 3.6 while Monroe County had the highest unemployment rate in August of 2017 at 5.7.
When comparing 2017 and 2018, Wayne and Macomb counties are the only two where the unemployment rate was higher in 2018 than in 2017. For Macomb County, in August of 2017 the unemployment rate was 3.9 and for 2018 it was 3.8. For Wayne County there was also a 1.0 difference, from 4.3 in 2017 up to 5.3 in 2018.
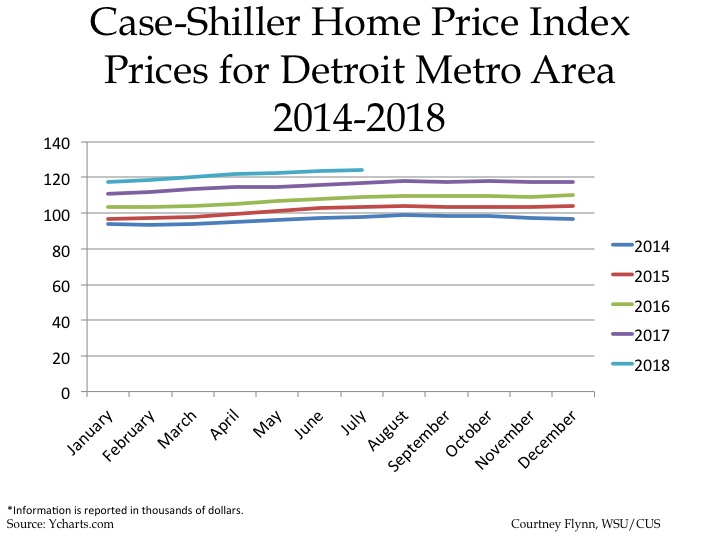
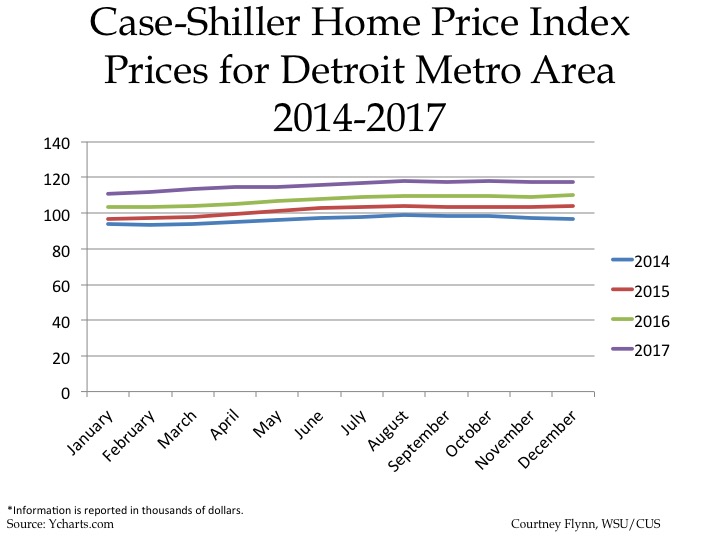
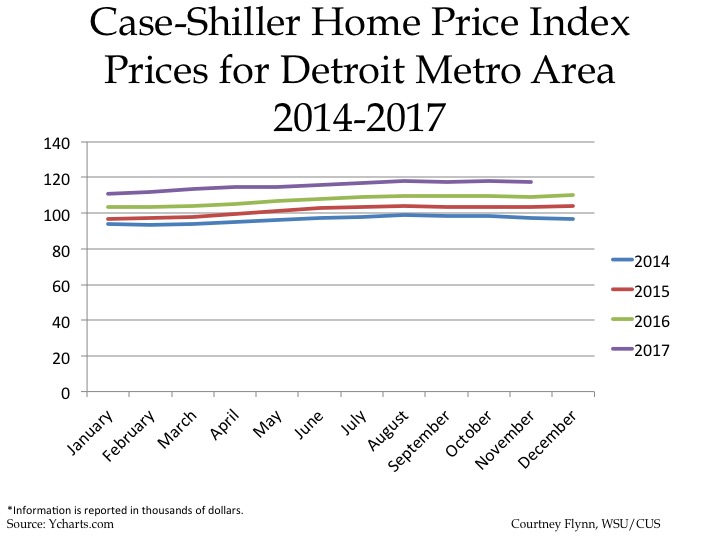
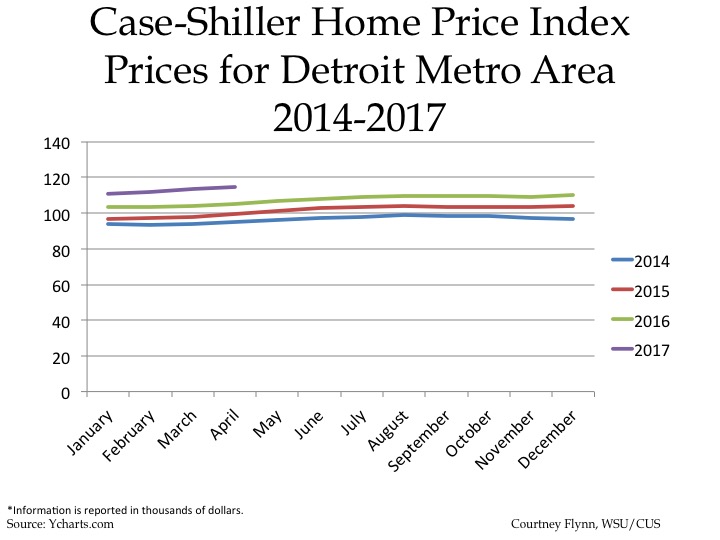
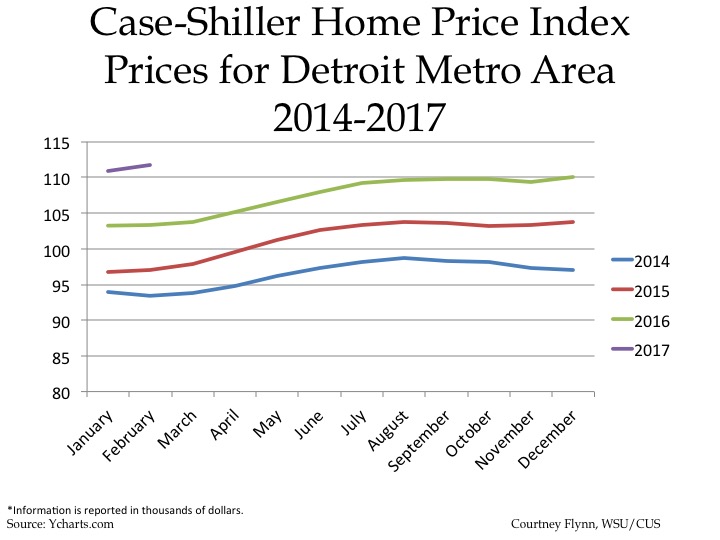
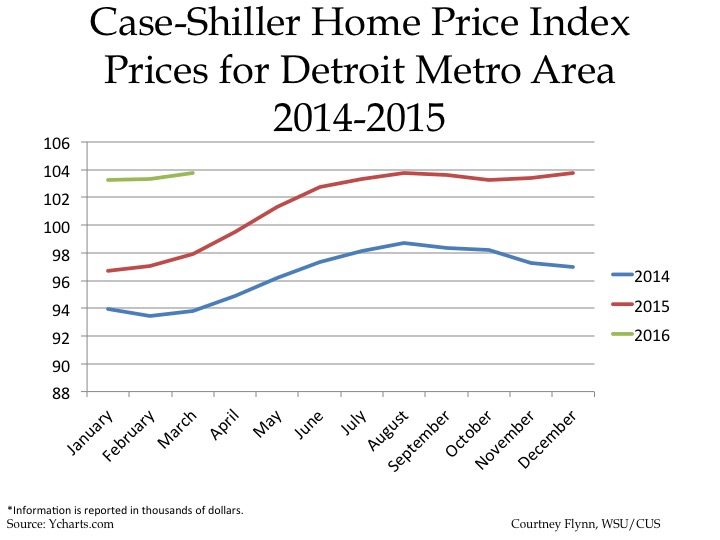
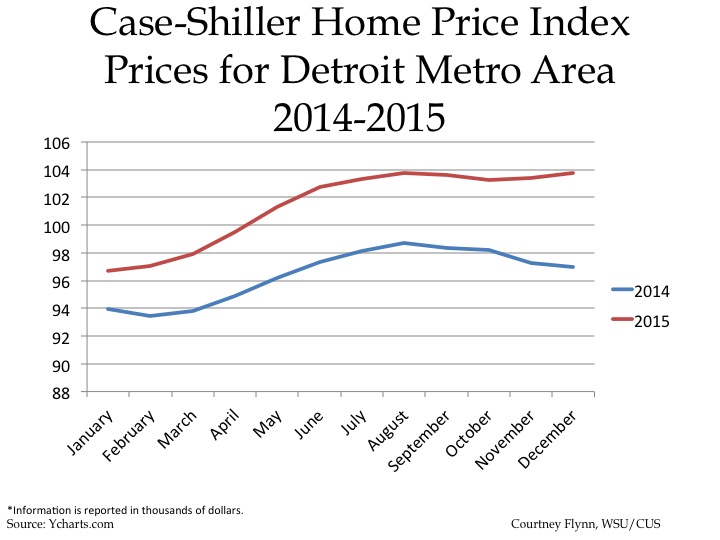
The above chart shows the Standard and Poor’s Case-Shiller Home Price Index for the Detroit Metropolitan Statistical Area. The index includes the price for homes that have sold but does not include the price of new home construction, condos, or homes that have been remodeled.
According to the index, the average price of single-family dwellings sold in Metro Detroit was $124,240 in July 2018; this was $510 higher than the average family dwelling price in June. The July 2018 price was an increase of $7,160 from July of 2017 and an increase of $15,070 from July of 2016, an increase of $20,900 from July of 2016 and increase of $26,110 from July of 2014.
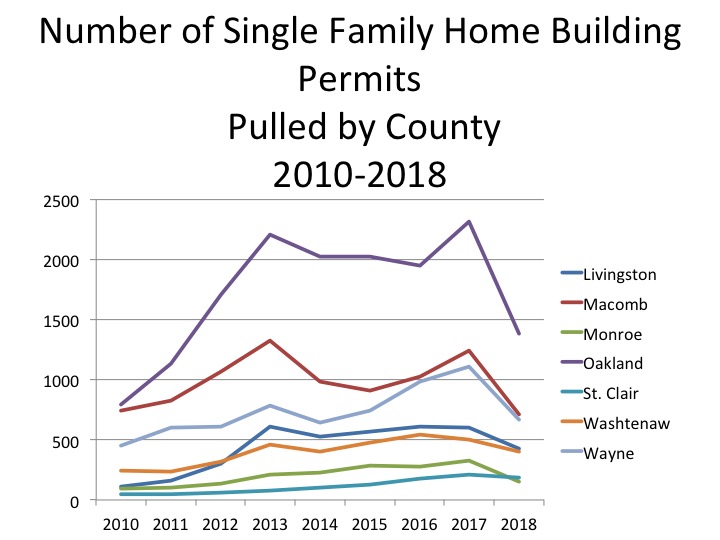
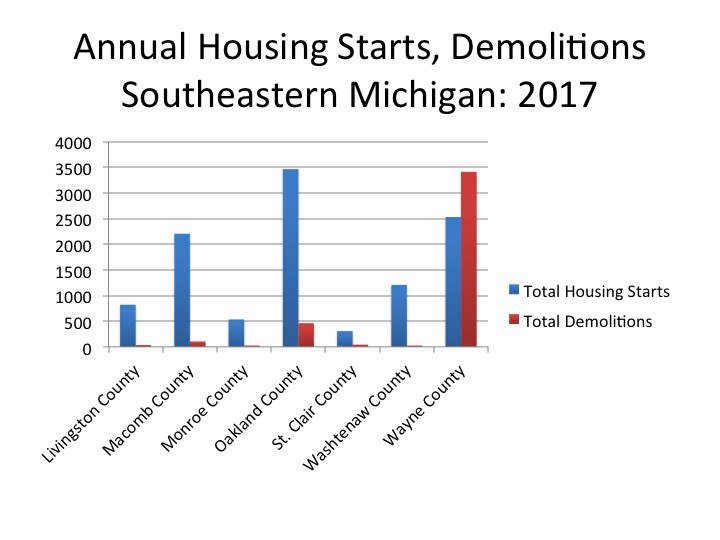
While home prices have been growing in Southeastern Michigan, a recent Detroit News article detailed how construction is slowing down, largely in part due to land and labor shortages and the associated costs. Also according to the article, August housing permits for single-family home construction decreased by 1.8 percent statewide compared to this time last year. This 1.8 percent increase was nearly the same as it was at this time last year (from 2016 to 2017), but for 2016 that annual increase was about 10 percent, according to the article.
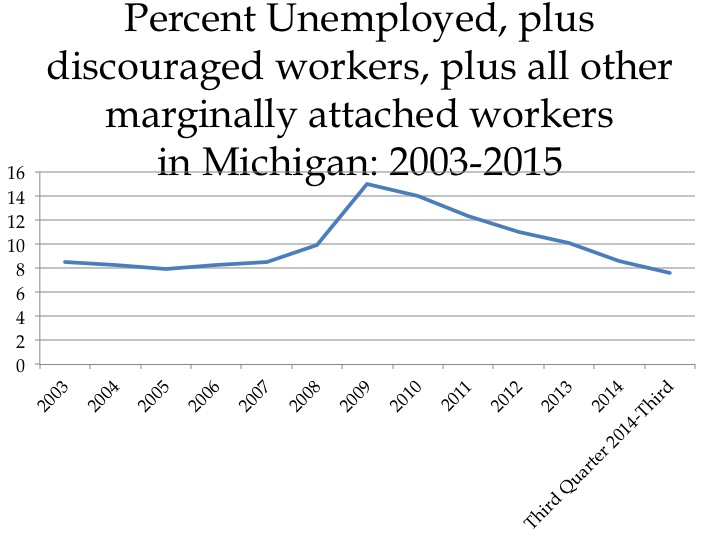
The chart below highlights how around 2011 the number of single family home building permits issued in each county in the region began to increase, spiking in about 2013. Then, more recently, Oakland, Wayne, Monroe and St. Clair counties experienced another increase in the number of permits pulled in 2017. However, the 2018 numbers, which are not complete for the year, do indicate that year end numbers will not compare with 2017. With only three months left in the year, and construction season slowing down for winter, it is likely many, if not all the counties in the region will not increase the annual number of building permits pulled over 2017.
Despite some regional housing growth, the Detroit News article indicated that affordable single family homes, particularly ones geared toward first-time buyers, are lacking in inventory in the region.