Proposed Michigan Water Affordability Bill Meets Opposition

Access to clean water and the ability to afford it is boiling over to a new proposal to help households with their water bills. Recently, Democratic lawmakers in the Michigan House of Representatives and the State Senate introduced bills that, if passed, would create a statewide affordability fund for low-income residents to access. The fund would be created by charging a $2 monthly fee to water customers across the state.

This proposal, discussed in detail below, is now drawing fire from Macomb County leaders and Republicans who say it will primarily benefit Detroiters.

 According to a bill analysis by the Senate Fiscal Agency (SFA), the estimated amount collected in the proposed water affordability fund, assuming  all 2.5 million retail water meters in Michigan were subject to the $2 per month funding factor fee would be $90 million. When the fund reaches $90 million, 3 percent of the monies, or $2.7 million, could be allocated for administrative costs associated with the program. The remainder of that assumed initial balance, $87.3 million, would be available for:

  • Actual administrative costs of the water providers, which would be limited to 15 percent of the balance in the Fund which after 18 months could be estimated at $13.1 million;
  • Payment or advancement to providers for income-based bill discounts; income-based bill caps, or income-based rates;
  • Arrearage payments;
  • Water loss mitigation programs.

Those eligible to benefit from this program would be customers who had a household income of up to 200 percent of the Federal Poverty Guidelines or who was eligible for certain assistance programs. Eligible customers for this program, which would be housed under the Michigan Department of Health and Human Services, would not pay more than 3 percent of their household income on a water bill.

This program has been lauded by some and opposed by others. In recent weeks, Detroit Mayor Mike Duggan, the Oakland County Board of Commissioners, Oakland County Executive David Coulter, Royal Oak, Harper Woods and Warren officials, Oakland County Water Resource Commissioner Jim Nash and Wayne County Deputy County Executive Assad I. Turfe have come out in support of the bills to create this fund. Area organizations, such as the United Way of Southeastern Michigan, Clean Water Action, the Sierra Club Michigan Chapter and American Waterworks Association, have also come out in support of the proposed bills. Supporters of these bills have discussed how water affordability is a human right, and these programs will allow that human right to continue for thousands of households.

Macomb County Public Works Commissioner Candice Miller is the most vocal official against the bills, stating it would only increase water bills for customers and that there already is access to water affordability programs. She says it will primarily benefit Detroiters. Seventeen Macomb County communities agree with Miller and have passed resolutions opposing the bills that could create the statewide water affordability programs. Those 17 communities are:

  • Armada (Village)
  • Bruce Township
  • Center Line
  • Chesterfield Township
  • Clinton Township
  • Fraser
  • Harrison Township
  • Memphis
  • Mount Clemens
  • Lenox Township
  • Macomb Township
  • New Haven
  • Roseville
  • Shelby Township
  • St. Clair Shores
  • Sterling Heights
  • Washington Township

The Macomb County Board of Commissioners also voted to take a stance against the bills, and ultimately the proposed fund.

According to Miller, water affordability programs, such as the Water Residential Assistance Program (WRAP) administered by the Great Lakes Water Authority (GLWA) are not fully used as is. The counter argument to this is that programs such as WRAP offer short-term support for those in need of assistance and other programs, such as the Detroit Water and Sewerage Department’s Lifeline Plan, have a one-off funding mechanism (ARPA) funds, and more sustainable funding mechanisms are needed. Additionally, there is no statewide assistance program, rather there are various affordability programs depending on the water provider and the location of the ratepayer. There are worries though that the proposed state affordable water fund would primarily support Detroit residents, according to a January, 2024 C&G News article.

According to the proposed bills, eligible customers are households whose income does not exceed 200 percent of the Federal poverty guidelines or who meets any of the following requirements:

  • Has received assistance from a State Emergency Relief Program within the past year.
  • Receives food assistance under the Federal Supplemental Nutrition Assistance Program (SNAP) administered by State.
  • Receives medical assistance administered under the Act. Receives assistance under the Michigan Energy Assistance Program.
  • Receives assistance under the Special Supplemental Nutrition Program for Women, Infants, And Children (WIC). Receives supplemental security income
  • Receives assistance under the Weatherization Assistance Program.

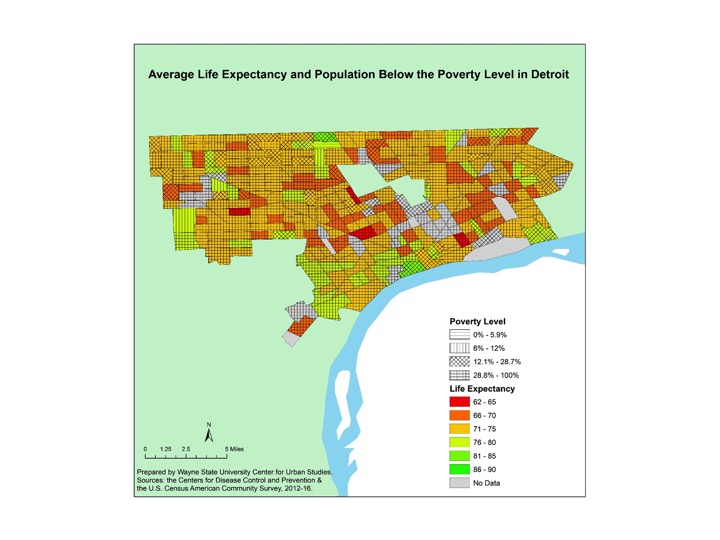
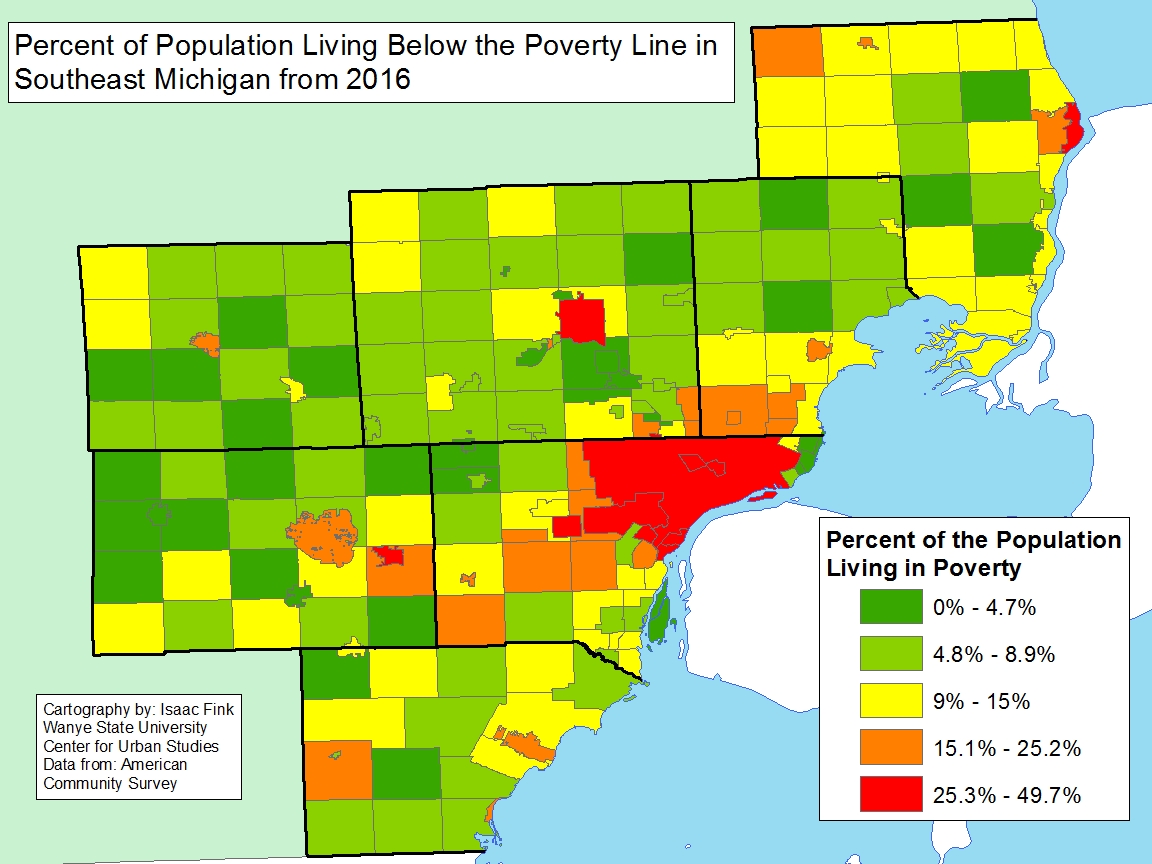
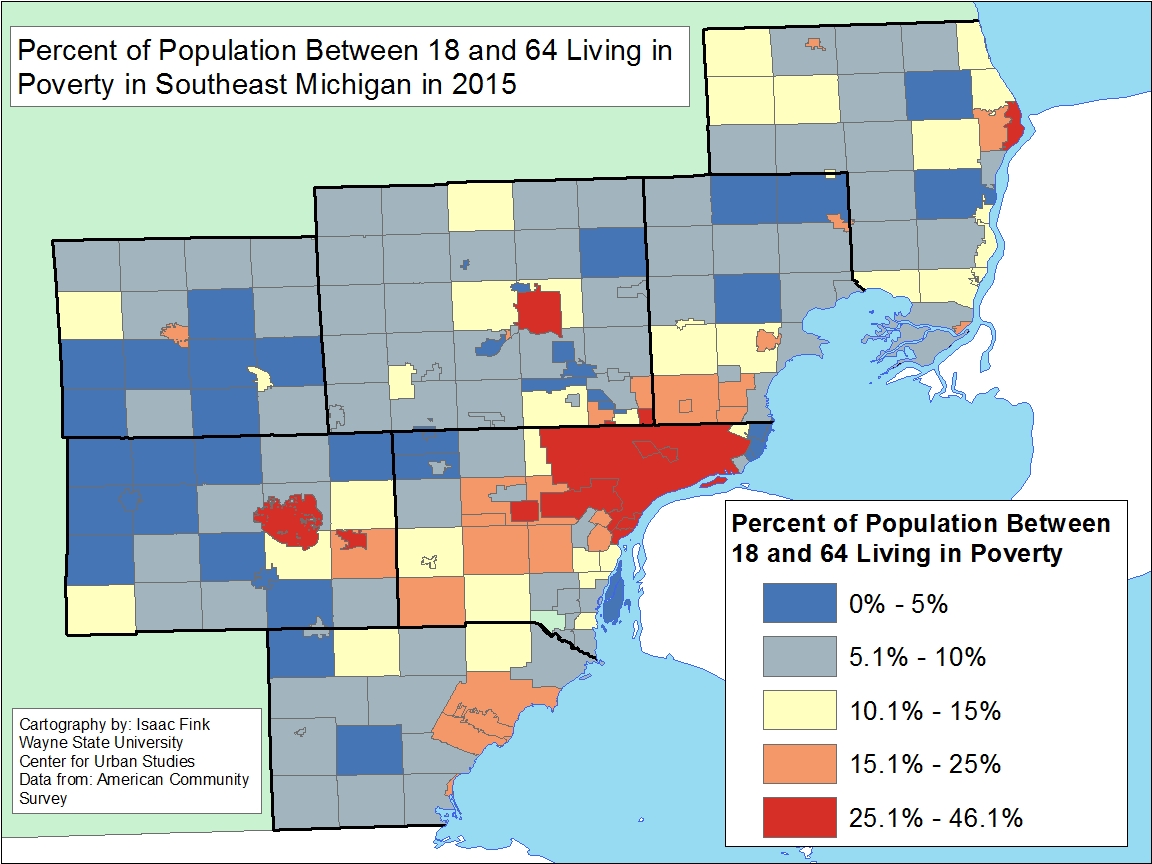
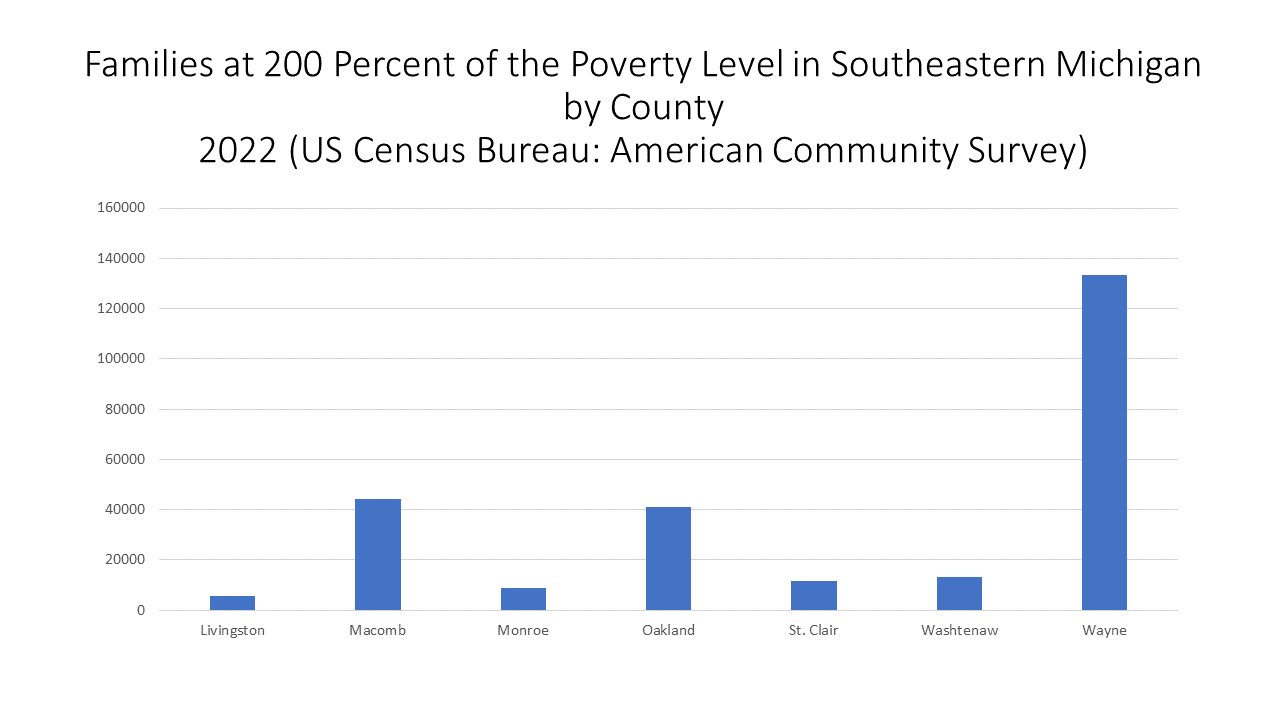
According to the Michigan Department of Health and Human Services, in 2020 more than 317,000 Michigan households were behind on their water bills and facing shutoffs. Furthermore, if looking at eligibility requirements as set out by the proposed bills, there were 309,101 families in Southeastern Michigan who were living at least 200 percent of the poverty level and 190,113 households with Supplemental Security Income (SSI), cash public assistance income, or Food Stamps/SNAP benefits in 2022, according to the US Census Bureau.

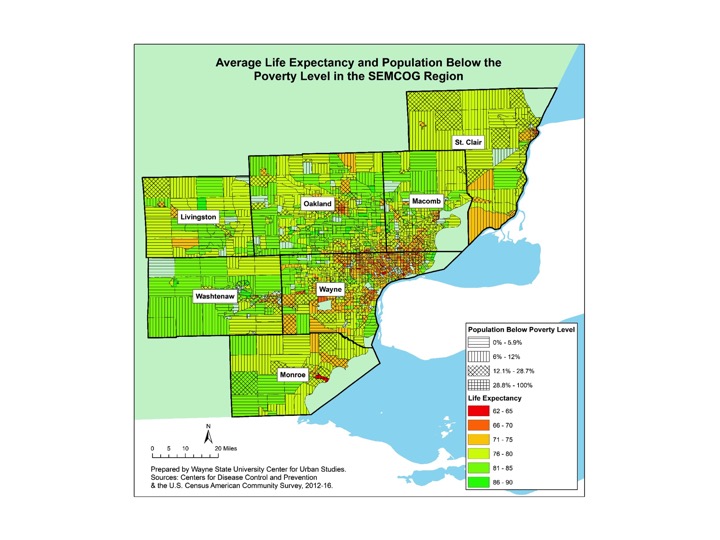
According to the Census data, Wayne County had the highest number of families living at least 200 percent below the poverty level at 133,492, followed by Macomb County at 44,218 and Oakland County at 41,037. Looking at the total number of families in Southeastern Michigan who live at least 200 percent below the poverty level, minus Wayne County, there are 124,568. In total, there are 258,060 families living 200 percent below the poverty line in Southeastern Michigan and 48 percent of those families live in either Livingston, Macomb, Monroe, Oakland, St. Clair or Washtenaw counties. Furthermore, with there being 309,101 total families in Michigan that live 200 percent below the poverty line, Wayne County families account for less than half that total.

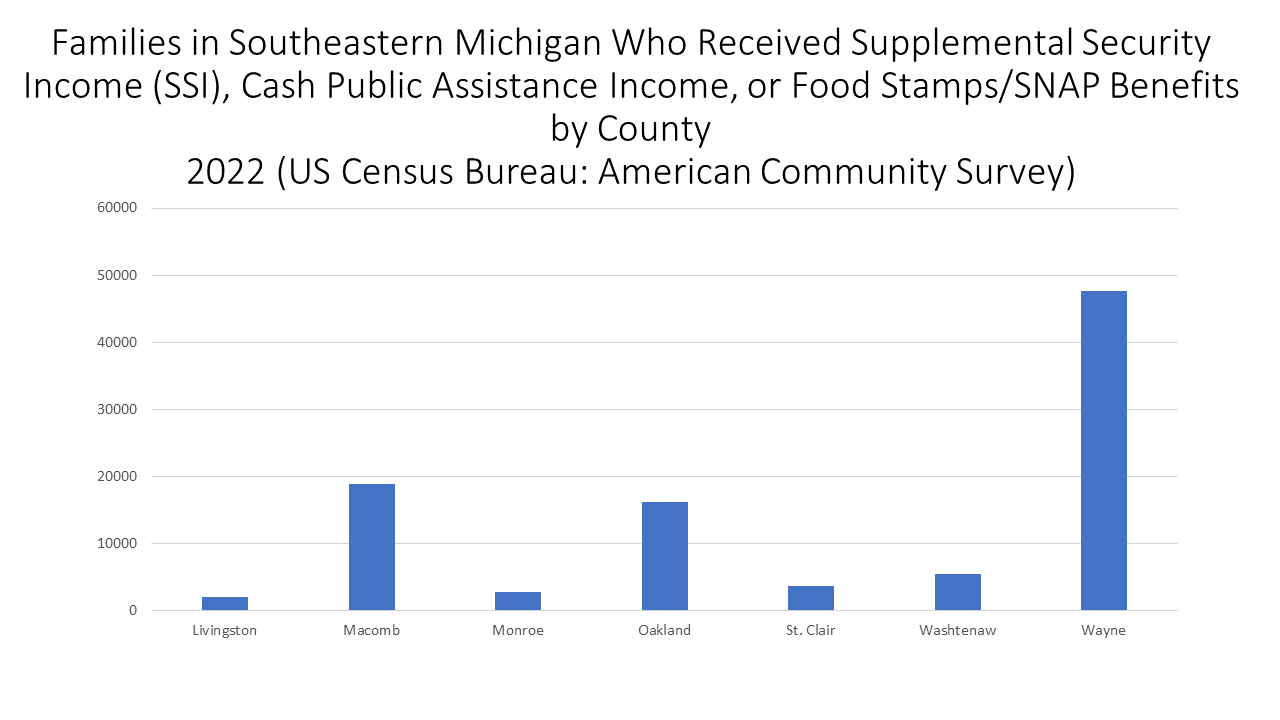
When looking at the number of families who received Supplemental Security Income (SSI), cash public assistance income, or Food Stamps/SNAP benefits in 2022 it was Wayne County that had the highest number of households, by far, at 47,646. Macomb County had the second highest number of households at 18,792 and Oakland County had the third highest number of households at 16,100. In Michigan in 2022 there were 190,113 families who received some type of assistance and Southeastern Michigan families make up 50 percent of that number.

So, while those who oppose the proposed bills claim the funds from the statewide water bill support program would primarily be filtered to Detroiters, the data shown above tells a different story.

The numbers certainly show there are families who are likely in need of utility bill support and $24 a year per household could go a long way for many. However, annually that number can increase by up to 10 percent to a maximum of $3 per retail water meter per month, according to the Senate Fiscal Agency bill analysis. If these bills are to become law and the program is created there needs to be strong program support, ensuring those in need and eligible for the program are aware of the benefit and have assistance in applying for the benefits. The monies, if charged to ratepayers, need to be used to support those in need throughout the state and ensure access to clean and fresh water.

Southeast Michigan Children in Poverty

Those in poverty often experience food insecurity, including children. With schools across the State of Michigan closed for the next several weeks due to the threat of the coronavirus disease (COVID-19) it is important to understand which school districts have students at a higher risk of food insecurity while school is out.

Those in poverty often experience food insecurity, including children. With schools across the State of Michigan closed for the next several weeks due to the threat of the coronavirus disease (COVID-19) it is important to understand which school districts have students at a higher risk of food insecurity while school is out.

Poverty Affects Life Expectancy in Detroit, Region

There is a huge variation in life expectancies in Southeastern Michigan, from an average of 62 years in the lowest Census Tract to a high in 85.9 in the highest tract. Moreover life expectancy is closely and negatively related to poverty. The correlation between life expectancy and poverty is -0.713 (sig. 0.01), meaning that there is moderately strong tendency for the length of life to decline as poverty increases in a tract. Or, put simply, poor people die sooner, a lot sooner. Both the maps and chart below present the relationship between shorter life expectancy and poverty or conversely lower levels of poverty in a tract and higher average life expectancy. At the same time, the majority of the areas in Southeastern Michigan have 20 percent or fewer of families living below the poverty line, along with average life expectancies between about 75 and 85 years of age. For reference, the average life expectancy in the United States is about 79 years of age and the federal poverty level for a family of four is $24,300. In 2017 12.7 percent of the U.S. population was living in poverty.

For the City of Detroit there is an average life expectancy across tracts is 71 to 75 years of age, although there are several Census Tracts where the average life expectancy is well below 70. Most of the Census Tracts in Detroit, especially those with lower life expectancies, have more than 28 percent of the population living at or below the poverty line. Specifically, there are three Census Tracts in Detroit where the average life expectancy is between 62 and 65 and the percentage of the population living below the poverty line ranges from about 29-100 percent (the highest threshold in the Detroit map below). While Detroit demonstrates the correlation between higher than average poverty rates and lower life expectancy, there are certain parts of the region where the life expectancy is about on par with the national average (78.8 years of age) but the percentage of the population live in poverty is at or below the national poverty rate (12.7 percent). These examples occur in the mainly the rural areas of the region, such as parts of St. Clair, Livingston and Monroe counties. In general though, radiating out beyond Detroit and the inner-ring suburbs, poverty levels decrease, and the average life expectancy increases. For example, in nearly all of western Washtenaw County the average life expectancy ranges from 81-85 with the poverty levels being at or below 12 percent.

As has been attributed in some of the specific examples noted above, there is a moderately high negative correlation between the percentage of the population living at or below the poverty line and the average life expectancy of Census Tracts in Southeastern Michigan. When looking at the median poverty levels of the region with the life expectancies there is a -0.713 P value, which is statistically significant at the .01 level. What this means is that as the percent in poverty increases, there is a tendency for average life expectancy to decrease.

Overall, these maps show that throughout Southeastern Michigan there is a wide range in life expectancy and poverty levels, with outer ring suburbs faring better and more urban areas, such as Detroit, and some rural areas faring worse. While we see here that poverty does relate to average life expectancy rates, other factors that may also affect average life expectancy include access to health care and educational attainment. The correlation between these factors and the average life expectancy will be explored in the next two posts.

Southeastern Michigan Poverty Levels Drop Slightly

Throughout Southeastern Michigan, majority of the communities in the region experienced a decrease in the percentage of residents living below the poverty level between 2015 to 2016, according to data from the U.S. Census Bureau. In 2016, a family of four was considered to be living at the poverty level with an annual income of $24,250, according to the U.S. Department of Health and Human Services; this was the same for 2015.

Southeastern Michigan was -0.2 percent. However, Summerfield Township in Monroe County experienced a 7 percent increase in the percentage of residents living below the poverty level between 2015 and 2016. In 2015, 9 percent of residents in Summerfield Township lived below the poverty level and in 2016, 16 percent of residents lived below the poverty level. Of the 28 municipalities (out of 213 in Southeastern Michigan) where there was a 1 percent or higher increase in the poverty level between 2015 and 2016, the majority were located in the rural suburbs of the region.


The municipality with the largest percentage decrease in residents living in poverty was Port Huron Township in St. Clair County at -5 percent. In 2015, 23 percent of the residents in Port Huron Township lived below the poverty level and by 2016 that decreased to 18 percent.

While there was an overall average decrease in the percentage of residents living in poverty between 2015 to 2016, the two cities with the highest overall percentage of residents living below the poverty level experienced an increase. In 2016, about 50 percent of the residents in Hamtramck lived below the poverty level; this was a 2.4 percent increase from 2015. In 2016, Highland Park had about 47 percent of its residents living below the poverty level, which was an increase of 2.5 percent.


Detroit

In 2016, about 39 percent of residents in Detroit lived below the poverty level, which was a decrease of 1 percent from 2015. A closer look at the Census tracts in Detroit though show that poverty levels did not decrease across the board. One Census tract specifically, which is located along the Detroit River in Southwest Detroit, experienced a 49 percent increase in the percentage of residents living below the poverty level. In addition to that Census tract, several others surrounding it also experienced poverty level increases up to 19 percent.

When looking at the Census tracts east of Hamtramck, with the exception of seven, all experienced a decrease in the percentage of residents living below the poverty level. It was this area of the City of Detroit that had the fewest number of Census tracts with percentage increases in the poverty level but also had among the highest poverty levels in 2016. It was just west of Highland Park though that had the most number of Census tracts with poverty levels below 35 percent in 2016.

Overall, the most recent poverty data released by the U.S. Census Bureau does show that poverty levels are decreasing, but not a rapid rate. The data also shows that there were 19 municipalities in the region with 20 percent or more of residents living below the poverty level. While this was a decrease from the 23 municipalities with the same statistic in 2015, the numbers still tell a story that Southeastern Michigan isn’t climbing out of poverty rapidly. We will need many years of broad based economic growth to reduce poverty levels substantially.

Detroit Childhood Poverty Increases 23 Percent Since 2000

Childhood poverty in Detroit has increased about 23 percent since 2000 and about 10 percent since 2010, according to data from the U.S. Census Bureau. In 2015 it was reported that the percentage of children under the age of 18 living in poverty in Detroit was 57.1 percent. This is compared to 46.9 in 2010 and 33.9 in 2000.

According to the U.S. Department of Health and Human Services, the poverty threshold for an individual in 2015 was an annual earning of $11,770 and for a family of four it was $24,250.  In 2010 the poverty threshold for an individual was $10,830 and for a family of four it was $22,050. In 2000 the poverty threshold for an individual was $8,350 for a family of four was $17,050.

2015

In 2015, there were 29 Census tracts where between 76 and 98 percent of children were living in poverty. Of these Census tracts, 14 were located east of Hamtramck, with four located along Gratiot Avenue (the southern portion). On the western side of the City of Detroit, there were five Census tracts with between 76 and 98 percent of children were living in poverty along Grand River Avenue. Also, there were seven Census tracts with between 76 and 98 percent of children living in poverty west of Livernois Avenue.

2010

In 2010 the percentage of children living in poverty in Detroit was 47 percent. The majority of the Census tracts west of Livernois Avenue had less than 56 percent of children living in poverty. There were 29 Census tracts where more than 72 percent of children were living in poverty and 25 of those were located east of Livernois Avenue.

2000

In 2000, 34 percent of children were living in poverty; this was the lowest percentage among the three years being compared in this post. A look at the map shows that majority of the Census tracts on the west side of the City had less than 31 percent of children living in poverty. Just west of Livernois Avenue is where majority of the Census tracts with more than 42 percent of children living in poverty were located. In total, there were 19 Census tracts where 53 percent or more of children lived in poverty in 2000.

Child Poverty Percent Change 2000-15

Between 2000 and 2015 there was a 23 percent increase in the percentage of children living in poverty in Detroit. A large part of that increase came from 36 Census tracts where there were percentage increases between 43 and 79 percent of children living in poverty. A handful of these Census tracts were located along Grand River Avenue. One of those Census tracts was the same as one of the 2015 Census tracts with the highest percentage of children living in poverty. In addition to large percentage increases in areas along the Grand River and Gratiot corridors, there were also two clusters of Census tracts in Detroit where there were increases between 43 and 79 percent of children living in poverty. One cluster was in the eastern portion of the City in the Denby neighborhood area, and the other was in the eastern portion of the City in the Brightmoor/Cody area. While majority of the Census tracts in the City experienced percentage increases in the percent of children living in poverty between 2000 and 2015, there were a number of Census tracts that experienced percentage decreases. While there weren’t large clusters experiencing such decreases, many of these Census tracts were located in the central area of Detroit.

Child Poverty Percent Change 2010-15

Between 2010 and 2015 there was a 10 percent increase in the percentage of children living in poverty. The map shows there were fewer Census tracts that experienced the highest tier of percentage increases for children living in poverty for the 2010-15 time frame than the 2000-15 time frame. In total, there

were 26 Census tracts where there was between a 40 and 85 percent increase in the percentage of children living in poverty in Detroit. Of these Census tracts, four were located along Grand River Avenue and another three were located along Gratiot Avenue.. On the opposite side of the spectrum, there were about 30 Census tracts with decreases between 21 and 69 percent in the percentage of children living in poverty. There were about 10 more Census tracts in the 2010-15 time frame than the 2000-15 time that experienced the highest tier in percentage decreases in the percentage of children living in poverty.

This deep dive into the percentage of children living in poverty in Detroit in 2015, and how those percentages have changed since 2000 and 2010, shows that poverty in the City is increasing across most neighborhoods, though the pace and breadth of increases has slowed since 2010. Our previous posts show that regionally childhood poverty is increasing at a faster rate than overall poverty levels, and Detroit is no exception to this. In our last post we suggested the need for job development and training in Detroit neighborhoods to allow individuals-particularly young adults-to have greater opportunities to participate in the labor force. Such opportunities for Detroit residents would also be an avenue to decrease the rate of childhood poverty.

Poverty, Unemployment Rates Higher for Young Adults in Detroit than City’s Overall Rates

In the City of Detroit the percentage of young adults (categorized as 16 to 34-year-olds in this post) living at or below the poverty level in 2015 was 42 percent, with the labor force participation rate for that same age group being 64 percent and the unemployment rate being 35 percent. Two out of three of these rates were above those for the City of Detroit overall. In 2015 the percent of all Detroit residents (including children) living below the poverty level was 40 percent, the labor force participation rate was 63 percent and the unemployment rate was 13.2 percent.

While the trend for these above mentioned rates for the young adult population was to be above the overall rates for the City, a deeper look at the rates showed they varied across Census Tracts in the City. For example, Census Tracts with the highest percentage of young adults living in poverty were along Grand River on the West Side and along Gratiot on the east side of the City. On the east side of the City, majority of the Census Tracts had between 50 and 90 percent of young adults living at or below the poverty level. Fortunately some of these same Census Tracts had among the lowest populations of young adults living there, with several having between 46 and 452 young adult residents residing in each Census Tract.

In the northeastern portion of the City, there were about a dozen Census Tracts with among the highest number of young adults living there, with numbers ranging between 667 and 1,742. These Census Tracts also had some of the highest labor force participation rates, as did a pocket in the western portion of the City of Detroit, along with several other pockets throughout the City. The tracts with the low labor force participation rates (29-48 percent) were frequently the same ones that had the highest percentage of young adults living at or below the poverty level; these Census Tracts are just east of Hamtramck. An individual is considered part of the labor force if they have a job or are actively seeking one. The labor force participation rate is the percentage of adults who are members of the labor force.

Two of these Census Tracts just east of Hamtramck also had among the highest unemployment rates for young adults, ranging between 59 and 89 percent. Overall in the City there were only 20 Census Tracts where between 59 and 89 percent of young adults were unemployed. Again, some of the tracts arrayed along Grand River on the west and Gratiot on the east had very high unemployment rates.

There are some tracts where high poverty, labor participation and unemployment rates overlap, but this is not the case for a majority of the Census tracts. At the same time the data tend to indicate a larger percentage of young adults are unemployed and, thus, living in poverty than the overall Detroit population. Clearly, getting more young adults employed must be a very high priority, and given that the national rate of unemployment is approaching 4 percent, there should be opportunities to connect these young adults to the labor market. Clearly it should be a priority to target job development and training programs to areas near Central High School along Grand River, as well as along Gratiot and in the Osborn and Demby areas.

Strong Correlations Exist For High Education Levels and High Incomes Throughout Most of Southeastern Michigan

In our last post we showed there is an area of overlapping high median incomes and high educational attainment running through Washtenaw County, western Wayne County, southern Oakland County and western Macomb County with nearly the opposite—lower median income and lower educational attainment–south of that in the region. In this post, we discuss explicitly the correlation between the levels of education examined in the last post (less than high school education, high school education, associate’s degree or some college education, bachelor’s degree, and graduate/professional degrees) and median incomes. The correlations are calculated for medians and percentages of municipalities across the region.

A correlation is statistical technique that can be used to describe the relationship between two variables. The correlation coefficient, often expressed as ‘r,’ is a numerical value that is always between +1 and -1. When r is closer to +1, it implies a positive correlation; as one variable increases, the other does as well. When r is closer to -1, it implies an inverse correlation; as one variable increases the other decreases. When the value of r is closer to 0 the implication is that there is no relationship between the two sets of data.

Educational Attainment Correlation Value
Achieved less than a high school diploma -0.74
Achieved only a high school diploma -0.71
Achieved some college or an associate’s degree -0.57
Achieved only a bachelor’s degree 0.75
Achieved a graduate or professional degree 0.77


Looking first across the region incomes tend to be lower for those municipalities with a higher percentage of people who do not have a high school degree, with a correlation of -0.74. This tends to indicate that less education leads to lower incomes. At the same time, it could mean that people with lower incomes have less of chance of completing their education. For those with a high school diploma the effect was slightly smaller, with a correlation of -0.71, and similarly for those with some college or an associate’s degree the correlation was -0.57.

For those at the upper end of education distribution the opposite holds true—there is a positive correlation between higher educational levels and higher incomes. Across Southeast Michigan for the municipalities with a higher percentage of people with a bachelor’s degree, incomes tend to be higher, with a correlation of 0.75. The relationship between income and educational attainment is even stronger for those who have attained graduate or professional degree, with a correlation of 0.77.

Next we examined these relationships at the county level—for all municipalities in a county. Of the seven counties in the region, Wayne County had the strongest correlations of (0.91) in relation to those with bachelor’s degrees and the median income. For those with graduate or professional degrees in Wayne County the correlation was 0.90 percent.  Monroe County had the weakest correlation value between those with bachelor’s degrees and the median income, with a correlation value of 0.22; it also had the weakest correlation between income and those with graduate or /professional degrees, with a correlation value of at -0.13 percent. Such values for Monroe County indicate that the relationship between higher levels of education attainment and higher median incomes are weakened or reversed in that largely rural setting. For several of the other counties, the correlation between these variables was much greater. In addition to Monroe County having a weak relationship between median income and those with a bachelor’s degree, there was also a weak relationship between those same two variables for St. Clair and, surprisingly, Washtenaw counties. For Washtenaw, it may occur because there are many students with higher education who are still pursuing degrees and have relatively lower incomes.

At the other end of the education spectrum, there exist a strong tendency for lower incomes to be associated with lower levels of education. Each county has either a moderate to strong correlation between incomes and lower levels of education. Monroe County again had the lowest correlations between median income and educational attainment for attainment, this time for less than a high school education and up to a high school education.

Overall, these analyses show a range of correlations across counties between higher median incomes and higher levels of educational attainment, some high and positive, others weak. Monroe County stands out as the only county one where there was a weak correlation between median income and all levels of educational attainment. It could be speculated this is because it is a more rural county and much of the work there relates to agriculture, work that is often learned at home within families.  In southeastern Michigan as a whole, there are relatively strong positive and inverse correlations between incomes and education attainment. There is a positive correlation between those who have achieved a graduate or professional degree and incomes–people with higher education tend to have higher incomes.  There is an inverse relationship between those who have not achieved a high school diploma and incomes–those with less education tend to have lower incomes.

Median Income, Educational Attainment Highlight Segregated Classes in Southeastern Michigan

Using Census data, this post examines the visual correspondence between income and educational attainment across the region. It clearly portrays the continuing association between these two critical variables with one region of high income and high educational achievement arching across the region from Washtenaw County, through Western Wayne County and up through Oakland County and western Macomb County. South of this is a region of lower income and educational attainment with a few islands of higher income and achievement. In all, this represents a strong and largely consolidated portrait of segregated classes in this region.

In Southeastern Michigan the City of Highland Park had the lowest median income at $17,250, with 33 percent of the adult population only having a high school diploma. In terms of educational attainment in Highland Park, those who had some college education or an associate’s degree represented the highest percentage of residents, as opposed to the other categories (less than high school, high school education, bachelor’s degree, graduate or professional degree). On the opposite end of the spectrum, the City of Bloomfield Hills had the highest median income at about $173,000, with the largest percent of its adult population having a graduate or professional degree (38%). Such trends are not unique to Highland Park or Bloomfield Hills.

Above the maps show what the median income of each community is with an overlay that shows what the percentage of educational attainment is at five different levels. These levels are: graduate degree, bachelor’s degree, associate’s degree or some college, high school diploma or an equivalency and less than a high school diploma. The overall purpose of each map is to present an image on how educational attainment and at each level may, or may not, relate to the median income.

When looking at the maps above we see that the communities that have more than 18 percent of its adult population with graduate or professional degrees tend have median incomes above $77,000. In total, there were only 10 communities, out of 46, where more than 18 percent of its adult population had graduate or professional degrees but the median income was below $77,000. Of those 10 communities, the City of Ypsilanti had the lowest median income at about $31,000 and 18 percent of its adult population had a graduate or professional degree. The community with the highest percentage of adult residents with a graduate or professional degree  is Ann Arbor, where both the University of Michigan and the University of Michigan Hospital are located. The median income for Ann Arbor in 2015 was $103,000. There was no community in Southeastern Michigan where more than 30 percent of the adults had a graduate or professional degree and had a median income below $95,000.

On the opposite side of the spectrum, there are 154 communities in Southeastern Michigan where 10 percent or more of the adult population had less than a high school education in 2015. The City of Hamtramck had the highest percentage of adults without a high school education at about 31 percent; the City’s median income was about $23,000. There are nine communities in the region where 20 percent or more of the population had less than a high school education. Of those nine communities, with the exception of Lincoln Park, none had a median income above $33,000. The median income in Lincoln Park was $41,000 in 2015. The City of Detroit is included in that list of nine communities, with a median income of about $26,000 and about 22 percent of its adult population having less than a high school education. Additionally, in Detroit, about 32 percent of the adult population had a high school education, and about 32 percent had some college education or an associate’s degree.

The percentage of Detroit residents with a bachelor’s degree was far lower than any of the statistics mentioned above. In Detroit, about 8 percent of residents had a bachelor’s degree in 2015. In terms of the percentage of residents throughout Southeastern Michigan with a bachelor’s degree, the average percentage was 18 percent and the median income was about $66,000.

Regionally, the community with the highest percentage of residents with a bachelor’s degree was the Village of Grosse Point at about 62 percent; the city had a median income of about $139,000. The City of River Rouge had the lowest percentage of adults with a bachelor’s degree at about 4 percent; it had a median income of approximately $26,000. In total, there were 46 communities in Southeastern Michigan where less than 10 percent of the population had a bachelor’s degree. Exeter Township, located in Livingston County, had the highest median income of the 46 communities that had less than 10 percent of its adult residents with a bachelor’s degree. The median income in Exeter Township was about $68,000.

Overall, this post shows that there is a correlation between median incomes and educational attainment, a deeper conversation that we will dive into next week. The maps and the data show that it is the communities with the higher percentage of residents with a bachelor’s degree and/or a graduate degree that have amongst the highest median incomes.

Higher Percentage of Children in Poverty in Southeastern Michigan than Adults

In Southeastern Michigan there is a greater percentage of children under the age of 18 living in poverty in several communities than there is adults living in the same circumstances. Not only is this the case in the region, but also, the percentage of children living in poverty has increased at a more rapid rate since 2000 than it has for those between the ages of 18-64 and for those above the age of 65. This is sad state of affairs.

All data presented here is provided by the U.S. Census Bureau and according to the U.S. Department of Health and Human Services, the poverty threshold for an individual in 2015 was an annual earning of $11,770 and for a family of four it was $24,250.  In 2010 the poverty threshold for an individual was $10,830 and for a family of four it was $22,050. In 2000 the poverty threshold for an individual was $8,350 for a family of four was $17,050.

In the year 2000 the following five municipalities had the highest percentage of children under the age of 18 living in poverty:

  • Highland Park: 45 percent
  • Hamtramck: 36.4 percent
  • Ecorse: 34.9 percent
  • Detroit: 33.9 percent
  • River Rouge: 30.9 percent

In 2010 the municipalities with the highest percentage of children population living in poverty shifted to the following:

  • Highland Park: 58.5 percent
  • Hamtramck: 58.5 percent
  • Ecorse: 51.9 percent
  • Detroit: 46.9 percent
  • Memphis: 46 percent

By 2015 the percentage of children living in poverty had increased still further throughout the region, as can particularly be seen by the top five communities with the highest percentage of children living in poverty. These communities were:

  • Highland Park: 63.8 percent
  • Hamtramck: 62. Percent
  • Detroit: 57.1 percent
  • Inkster: 56.7 percent
  • River Rouge: 54.4 percent


Percent in Poverty Level Changes 2000-2010

Between 2000 and 2010 the LaSalle Township experienced the highest percentage increase of children residing in poverty at 28.4 percent. LaSalle, being a more rural suburban community in Southeastern Michigan, was not the only community with such characteristics to find itself atop the list with the highest percentage increases. Of the 46 communities that experienced more than a 10 percent increases in the percentage of children living in poverty between 2000 and 2010, 11 were inner-ring suburbs.  Detroit experienced a 13 percent increase in the percentage of children living in poverty between 2000 and 2010; Highland Park experienced a 12.8 percent increase and Hamtramck experienced a 22 percent increase. Overall, there were only 39 communities that experienced either no increase in the percentage of children residing in poverty or a decline in the percentage.

When comparing the increase in the percentage of children living in poverty between 2000 and 2010 we see that for both adults between the ages of 18-64 and those over the age of 65, neither group experienced an increase above 17 percent. For children under the age of 18, there were 12 communities where the increase in the percentage of children living in poverty was above 17 percent.

Percent in Poverty Level Changes 2010-2015

Between 2010 and 2015 there were 32 communities in Southeastern Michigan where there was more than a 10 percent increase in percentage of children living in poverty. Of these communities, the top five were nearly all more rural, suburban communities. These communities were:

  • Richmond (city): 35.2 percent
  • Belleville: 24 percent
  • St. Clair: 23.3 percent
  • Melvindale: 23.2 percent
  • Sumpter Township: 21.7 percent

Percent in Poverty Level Changes 2000-2015

Between 2000 and 2015 there were 64 communities in Southeastern Michigan that experienced over a 10 percent increase in the percentage of children living in poverty since 2000 and 173 communities that experienced an increase above 0.01 percent. The top five communities with the largest increases were:

  • Richmond (city): 31.6 percent
  • Inkster: 28.6 percent
  • Royal Oak Township: 28 percent
  • Sumpter Township: 27.6 percent
  • Eastpointe: 26 percent

During this time span we do see that there is a greater number of inner-ring suburbs that experienced increases above 10 percent than there were during the 2000 to 2010 time frame. However, as the map shows above, the suburbs were not protected from the, in some cases drastic, increases in the percentage of children living in poverty.  And, just as the increases were drastic for several communities throughout Southeastern Michigan, they were also far greater than the percentage increases of adults between the ages of 18-64 and those above 65 living poverty during the same time period. For those between the ages of 18-64 the highest percentage increase of those living in poverty was River Rouge at 21 percent. For those above the age of 65 the City of Hamtramck experienced the largest increase at 13.5 percent.

Overall, the data presented in this post conveys two strong messages: Southeastern Michigan has a greater percentage of children living in poverty than adults and the elderly, and the percentage of children living in poverty has been increasing at a faster rate than the adults living in the region. Additionally, the data presented in this post again shows the theme that poverty levels aren’t only increasing in the region’s urban areas, but also in the suburbs and more rural areas.

Southeastern Michigan’s Poverty Levels Have Increased Since 2000

This post explores how the percentage of residents between the ages of 18-64 living in poverty has increased throughout Southeastern Michigan since 2000 and 2015. The bottom line here is that the substantial majority of communities saw increases, some of them substantial, in poverty over the years 2000 through 2015. Only 10 saw decreases.

All data is provided by the U.S. Census Bureau and the U.S. Department of Health and Human Services. In 2000 the poverty threshold for an individual was $8,350, and for a family of four it was $17,050. In 2010 the poverty threshold for an individual was $10,830, and for a family of four it was $22,050. The poverty threshold for an individual in 2015 was an annual earning of $11,770, and for a family of four it was $24,250.

According to data from the U.S. Census Bureau, the City of Highland Park had the highest percentage of individuals between the ages of 18-64 living in poverty in the years 2000, 2010 and 2015. Between each of the years the percentage has continued to grow. In 2000, the Census reported that 35 percent of the adult population between the ages of 18-64 was living in poverty in Highland Park. In 2010 that number increased to 42 percent and by 2015, 46.1 percent of the adult population between the ages of 18-64 in Highland Park was living in poverty. Just as Highland Park remained at the top of the list for the percentage of individuals between the ages of 18-64 living in poverty, the top five Southeastern Michigan communities with the highest poverty levels didn’t shift much from year-to-year. The data are displayed below.

2000

  • Highland Park: 35%
  • Detroit : 23%
  • Hamtramck: 23%
  • Ypsilanti: 20%
  • River Rouge: 20%

2010:

  • Highland Park: 42%
  • River Rouge: 36%
  • Hamtramck: 35%
  • Detroit: 31%
  • Royal Oak Township: 28%

2015:

  • Highland Park: 46%
  • Hamtramck: 41%
  • River Rouge: 41%
  • Detroit: 38%
  • Ypsilanti: 34%

Percent in Poverty Level Changes 2000-2010

When viewing how poverty levels have increased over time, the data shows that between the years 2000 and 2010 the City of Memphis (on the border of St. Clair and Macomb Counties) had the highest percentage increase of individuals between the ages of 18-64 living in poverty at about 17 percent. River Rouge and Hamtramck followed in the number two and three spots with percentage increases at 16 and 12, respectively. Highland Park experienced an increase at 7 percent while Detroit experienced an 8 percent increase.

Percent in Poverty Level Changes 2000-2015

Expanding the range of dates from 2000 through 2015, River Rouge, Hamtramck and Port Huron Township had the highest increases in the percentage of individuals between the ages of 18-64 in poverty between 2000 and 2015. For River Rouge that increase was 21 percent; Hamtramck had a 19 percent increase, and Port Huron Township had a 19 percent increase. In Detroit the percentage increase for individuals in poverty between the ages of 18-64 was 15 percent, and in Highland Park it was 11 percent.

In total, of the 213 communities in Southeastern Michigan for which long-term poverty data was available there were only 10 that experienced a decrease in the percentage of individuals between the ages of 18-64 living in poverty between 2000 and 2015. On the opposite side of the spectrum, there were 27 communities where the percentage increase of individuals in poverty was at 10 percent or above; less than 10 of those communities were outside the direct Detroit suburbs.

Percent in Poverty Level Changes 2010-2015

Finally, we examine the change in the percentage of individuals between the ages of 18-64 in poverty between the years 2010 and 2015 the data shows that the highest increases occurred in the more rural areas of the region. For individuals between the ages of 18 and 64 the city of Richmond had the highest percentage increase of residents living in poverty at 13 percent. Ypsilanti and the City of Yale both had 12 percent increases. London Township and Port Huron Township were the only other two communities in Southeastern Michigan where the percentage increase of the individuals between the ages of 18-64 was above 10 percent. The City of Detroit experienced a 7 percent increase and Highland Park experienced a 3 percent increase in the percentage of individuals between the ages of 18-64 who lived in poverty between the years 2010 and 2015.

Between 2010 and 2015 there were 58 communities in Southeastern Michigan where the percentage of individuals living in poverty decreased. The City of Unadilla had the largest decrease at 9 percent. None of the communities that experienced a decrease in the percentage of individuals between the ages of 18-64 were an inner-ring suburb of Detroit. The communities with decreases in poverty levels around 5 percent and above were located on the more outer edges of the region.

While the data shows that poverty levels have continued to increase for majority of the communities across the region, there are signs that the growth of poverty levels are decreasing. Between 2010 and 2015 there was a smaller number of communities who experienced an increase in poverty levels than between 2000-2010 or 2000 to 2015. The data comparing 2010 and 2015 levels also shows the percentage of poverty levels decreasing above 6 percent in certain communities, a statistic that was not achieved in the 2000 to 2010 comparisons and the 2000 to 2015 comparisons. However, the data does indicate that long-term poverty level growth appears to have been primarily concentrated in Detroit and its inner-suburbs. The more recent poverty data though (2010-15) shows that higher poverty levels are also being seen in the more rural areas.

Next week we will view how poverty levels are affecting the elderly population.