How Detroit is Tackling Rental Code Enforcement, Lead Remediation

The City of Detroit recognizes that lead poisoning prevention is multi-faceted, which is why an Interagency Lead Poisoning Prevention Task Force was created earlier this year, the same time the codes rental properties in the City were tightened. The task force will eventually align future rental code enforcement target ZIP codes with the zip codes where there is a high prevalence of elevated blood lead levels in children. Currently though, the rental code compliance program overseen by the Buildings, Safety, Engineering and Environmental Department (BSEED) is focusing zip codes that do not have among the highest percentage of children 6 years of age and younger with lead poisoning.

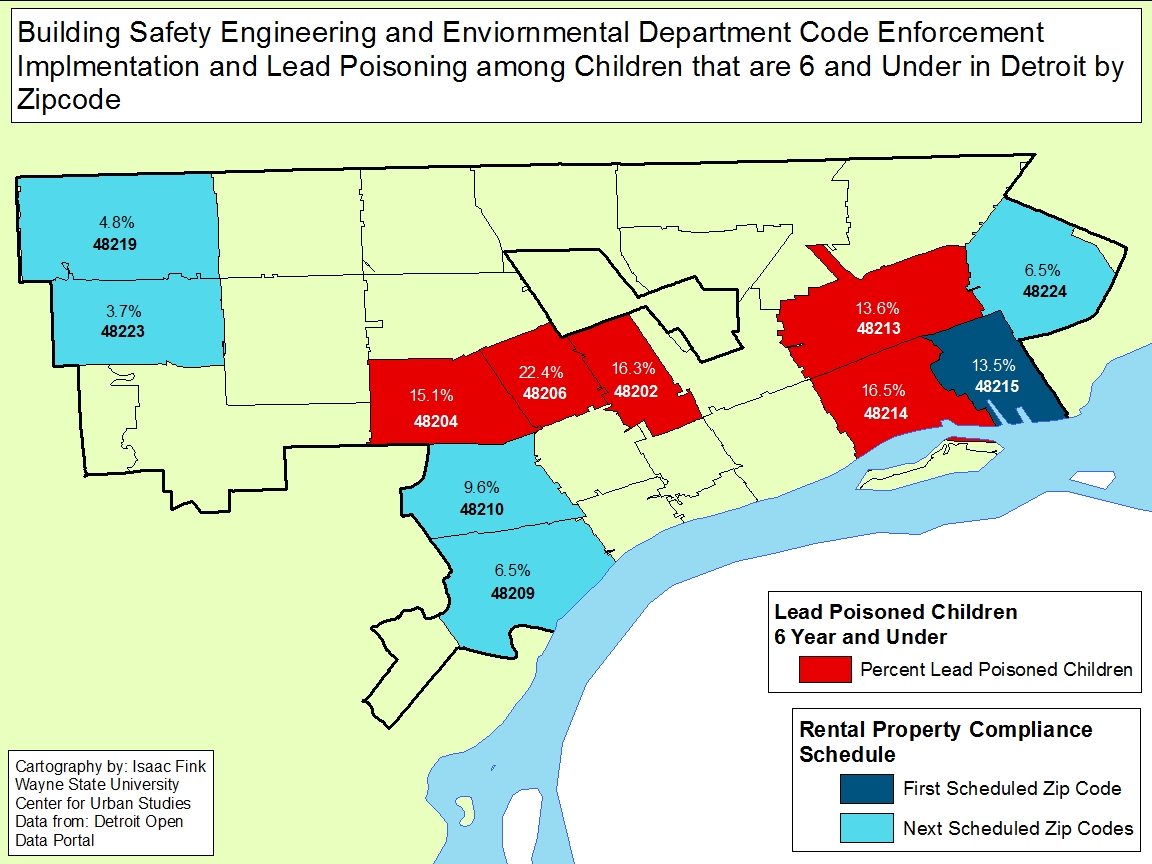
The zip codes BSEED is currently enforcing compliance on are: 48215, 48224, 48223, 48219, 48209 and 48210. These six zip codes are the first priorities of the City’s new, stricter rental code ordinance that seeks to ensure all rental properties are properly registered, up to code and have obtained a certificate of compliance. One aspect of the new ordinance is that all rental properties, despite the length of their certificate of occupation, must have annual lead hazard inspections. According to the ordinance, the annual assessment can be waived only if the property owner has taken more long term or permanent measures to abate the lead.


While this ordinance does make lead assessments and abatements a priority for all rental properties, the zip codes identified to have among the highest percentage of children 6 years of age and younger are not included on the initial and current compliance schedule, which is available here (link to BSEED). According to the City of Detroit, the 48210 zip code is to be launched into the new compliance program on Aug. 1, 2018 and is scheduled to have all rental properties in compliance with the new ordinance by Feb 1, 2019. This is certainly a step in the right direction, however, the zip codes with among highest percentage of children with lead poisoning have yet to be placed on the compliance list. The City of Detroit does state though that all rental properties in the City must be in compliance with the new ordinance by the end of 2020.


The zip codes where recent data shows there is the highest prevalence of elevated blood lead levels in Detroit’s children are: 48202, 48204, 48206, 48213 and 48214. According to the City of Detroit Health Department, these zip codes will be included in the new rental property compliance program, but all also be part of the Lead Poisoning Prevention Pilot Program, which is being spearheaded by the Interagency Lead Poisoning Prevention Task Force. As part of this pilot program, there will be door-to-door outreach in the identified zip codes. This outreach will provide occupants, particularly those with children or who are pregnant, with information on how to identify potential lead hazards and protect themselves from the risks. Lead testing will also be provided through this program.

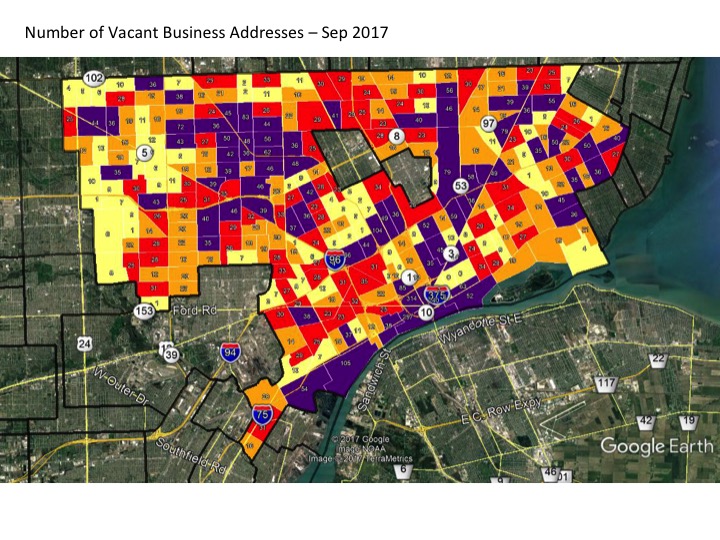
As the information above shows, the City of Detroit has taken steps through both rental code enforcement and direct outreach facilitated through the Health Department. However, direct coordination between the initial enforcement phase of the new rental property compliance ordinance and the Interagency Lead Poisoning Prevention Task Force has yet to fully materialize. The map below highlights just this. The zip codes in red are the ones the City has identified as having the prevalence of elevated blood lead levels in children. The zip codes in blue are the ones that have been identified for the most immediate rounds of registration and compliance for the new rental code.

The information provided in the map below is from the City of Detroit’s website.

Metro-Detroit Business Indicators Show Increase in Vacancies

This post focuses in on key business climate indicators in the Detroit Metro area. We examine retail rental rates, the changes in these rates, vacancy rates for both retail and industrial property, and employment by sector.


The two charts above describe the per square foot cost of retail rental space, and the change in that cost throughout the Detroit metropolitan region. In the first quarter of 2017 the City of Troy had the highest retail rental costs per square foot at $22.45, according to Marcus and Millichap. Troy also had a 10 percent increase from the first quarter of 2016. While the City of Troy did experience one of the larger retail rental cost increases over the last year, it was the Downriver area that experienced the largest increase. Between the first quarter of 2016 and the first quarter of 2017 there was a 14 percent rental cost increase in the Downriver area. By the first quarter of 2017 retail rental space cost $11.71 per square foot in Downriver; this was the lowest cost in the region.

Overall, the average retail rental cost per square foot in the Metro region was $12.94.

With retail rental costs the highest in the Troy area it is no surprise that that area in the region had the lowest vacancy rate at 2 percent during the first quarter of 2017, according to Marcus and Millichap. On the opposite side of the spectrum, Southfield had the highest retail vacancy rate at 12.1 percent; the cost of retail rental space per square foot in Southfield during the first quarter of 2017 was $13.39.

The overall retail space vacancy rate in the Metro region during the first quarter of 2017 was 6.8 percent.

Compared to retail space vacancies (6.8%), overall there were lower industrial vacancy rates (an average of just over 2%) throughout the region. The Royal Oak/Southfield area had the highest vacancy rate in the first quarter of 2017 at 5.5 percent while the Eastern section of the Metro region had the lowest rate at 1.7 percent, closely followed by the Troy area and Washtenaw. The highest industrial vacancies were in the Royal Oak-Southfield area.

In June of 2017, according to the data from the U.S. Postal Service, there were 7,932 total vacant business addresses in the City of Detroit; this number is a 324 vacancy increase from June of 2016. Overall, the business address vacancy rate in the City of Detroit was 27.5 percent in June of 2017; there were a total of 28,844 reported business addresses. The maps above show by Census Tract where the highest and lowest business address vacancies were by both number and percentage. In total, as shown in the first map, the Southwest Detroit region along the Detroit River had the highest number of business address vacancies. The Census Tract with the highest number of vacancies was located in that area; there were a reported 314 business vacancies in one Census Tract.

In addition to the Southwest Detroit cluster of high business address vacancies there was also a cluster just west of Highland Park and another cluster along M-53. While these clusters did not have as high of business vacancy numbers as Southwest Detroit, in several cases, Census Tracts in these clusters had higher percentages of business vacancy rates. For example, in a Census Tract just east of M-53, there was a business address vacancy rate of about 59 percent; this was the highest percentage in the City of Detroit in June of 2017.

Overall, this data shows that business vacancies are increasing overall in the City, but the higher percentage of vacancies tend to be located in business and industrial districts outside of Downtown Detroit.

According to information from the Bureau of Labor Statistics (BLS) , during the first quarter of 2017 Wayne County had the highest average weekly wages at $1,266 while St. Clair County had the lowest at $854.

The BLS does not include Washtenaw and Monroe counties in their Metro-Detroit Economic Summary updates, which is why they are not included in the chart above.

According to the BLS, the professional and business sector in the Metro-Detroit region had the highest number of employees at 408,800 while the information sector had the lowest number of employees at 28,300. The trade, transportation and utilities sector had the second highest number of employees at 367,700. The manufacturing industry had 249,400 employees, and the government sector had 173,900 employees.

Detroit’s housing costs increasing faster than incomes

Throughout Southeastern Michigan monthly housing costs for renters are increasing generally faster than their monthly household incomes, which in many cases are actually declining, according to data from the American Community Survey. Even in areas where the renters’ incomes improvements exceeded the change in overall regional housing costs between 2010 and 2013, monthly housing costs continued to increase at a rapid pace. There were areas in the region though, particularly Oakland County, where monthly housing cost increases stayed below the monthly household income increases. However, Detroit’s overall housing costs generally increased at a faster pace than the monthly income changes (largely declines) of residents.

Slide03


Slide04

Between 2010 and 2013 all Oakland County communities experienced an increase in household income while many communities throughout the rest of Southeastern Michigan continued to experience a decrease in their household income. St. Clair County had the most communities where the household income decreased more than 9 percent (three-Columbus, Ira and Kimball townships) between 2010 and 2013; the only other county where a community had such an income decrease was Washtenaw with Bridgewater Township.

When just looking at renter’s income change between 2010 and 2013 we see that there were fewer households that experienced an income decrease and more that saw their incomes increase.

According to Governing.com, Michigan is one of three states that suffers from housing affordability burdens, particularly in the rental realm. Incomes may be increasing throughout the state, but for renters earning minimum wage, those small increases often equate to the increases in monthly housing costs, especially as demand for rental units remains high.

Slide06

RentMoreHHI (1)
Slide08

Despite renters throughout the region experiencing income increases, these increases were not equal to or more than their housing costs in several communities. In St. Clair County all of the communities experienced housing cost changes above those of the renters’ monthly income. This was not unique to just St. Clair County though. Rather every county in the region, with the exception of Livingston and Oakland, had renters whose income changes weren’t keeping up with their housing cost increases. With increases in Oakland County’s renters’ income outpacing their monthly housing cost increases this could mean a number of things, including: rental prices are not increasing as quickly as places such as Detroit or Warren because demand is lower; these renters’ incomes are growing as the economy stabilizes (for places like Ferndale, Royal Oak and Rochester we see their income increases are above that of non-renters) while in areas like Detroit the median household income is lower, income growth can’t keep up with cost of housing increases.

A series of five maps drilling down into the City of Detroit (presented below) shows that pockets of the city experienced household income growth between 2010 and 2013. While there was some overlap between overall income growth and renters’ income growth, this wasn’t true for every Census Tract. One area where there was such a difference was just east of Hamtramck. Here we see that Census Tract experienced overall income growth between 2010 and 2013 but the renters there did not see their incomes increase. Renters in that area also experienced monthly housing cost increases that exceeded their income changes. In this area of the city, homeownership also appears to be more prevalent than in other areas of the city.

Throughout other parts of the city we see that the majority of Census Tracts experienced an increase in renters’ household income between 2010 and 2013. But, the increases in monthly housing cost offset most income increases. This could indicate a shift toward gentrification in some areas as long-term, lower-income renters cannot afford increasing monthly housing costs as demand for rental units in Detroit continues to grow. With a current vacancy rate of 5 percent and a desire for many suburbanites to live in areas such as Downtown, Midtown and Corktown, housing costs in the city continue to grow, according to the MetroTimes (link). It is these areas where renters experienced income growth well above the overall changes in the City of Detroit. Not every Census Tract in these neighborhoods though had renters with income changes above the overall change experienced by the city as whole.

Slide11

Slide12

Slide13

Slide14

Slide15

Detroit rental units