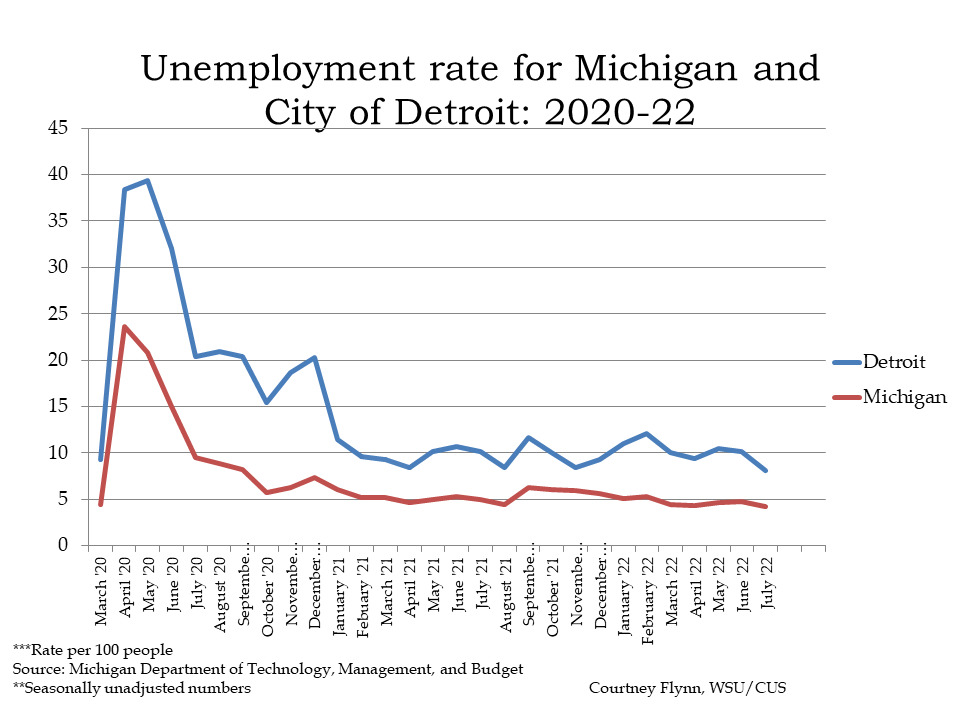
Michigan’s unemployment rate continues to remain stable and below 5 percent, a trend that has occurred since June of 2022. In January of 2024, the State of Michigan’s unemployment rate was 4 percent. While this a good sign, Michigan Labor Market Information Director Wayne Rourke was recently quoted in a Michigan Public Radio article saying that the job market in Michigan is beginning to cool off. He did add though that the job market is still good.
In Detroit, the 2023-2028 Economic Outlook produced as part of the City of Detroit-University Economic Analysis Partnership between U of M, the City of Detroit, Michigan State University and Wayne State University, shows even more optimism. According to report, payroll jobs are expected to increase by 3,000 in 2023 and by 8,900 from now until 2028. Such growth will is expected to decrease Detroit’s unemployment rate to 7.2 percent in 2028. Detroit’s unemployment rate was 8.2 percent in January of 2024, which was a slight increase from where it was in November and December of 2023.

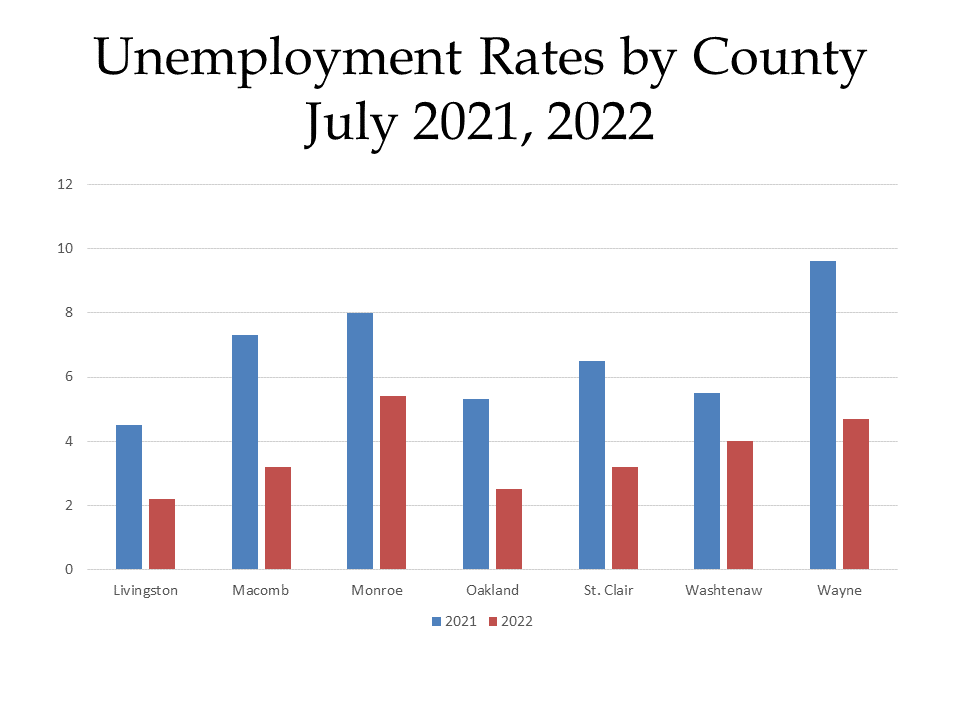
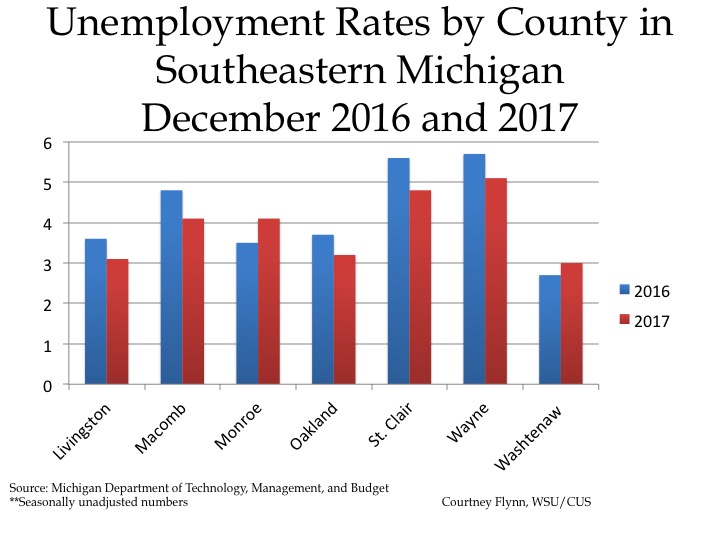
When comparing the unemployment rates of the seven counties in Southeastern Michigan between January of 2023 and January of 2024 we again see signs of economic optimism, with unemployment rates being down or remaining stable for all seven counties. Monroe County had the largest decrease in its unemployment rate between January 2023 and January 2024 at 0.7 percent; it also had the highest unemployment rate in January of 2023 at 4.9 percent. In January of 2024, Wayne County had the highest unemployment rate at 4.7 percent, which is what it was the year before too. Washtenaw County had the lowest unemployment at 2.9 percent in January of 2024.

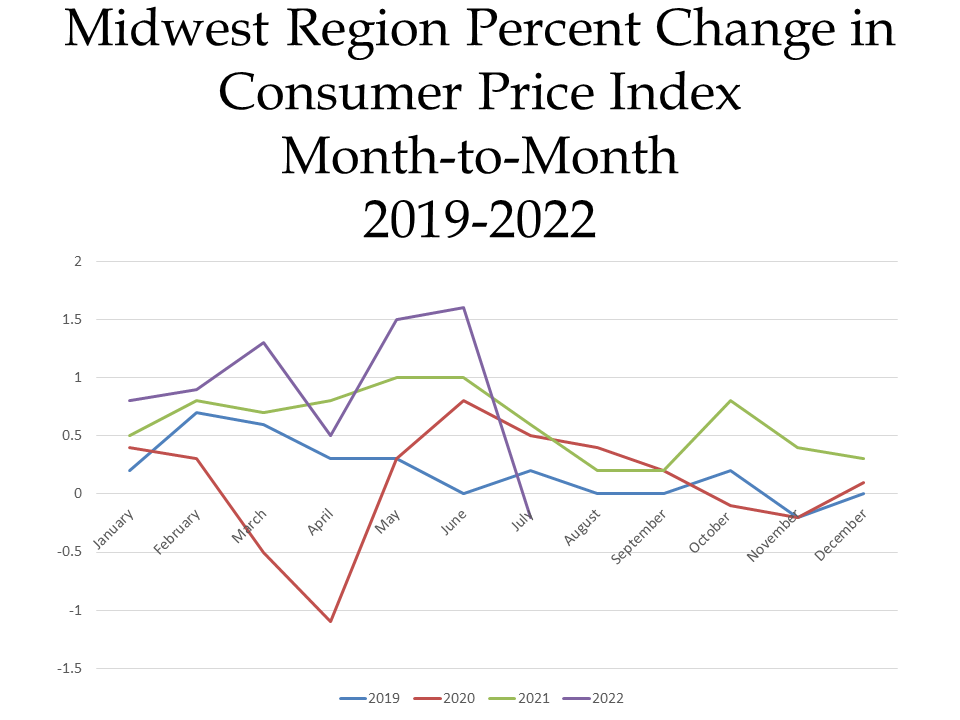
The charts below show the percent changes in the Consumer Price Index (CPI) on a month-to-month basis and a year-to-year basis for each month in years 2019, 2020, 2021, 2022, 2023 and 2024 in the Midwest Region. The CPI is a measure that examines the weighted average of prices of consumer goods and services, such as transportation, food, energy, housing and medical care. It is calculated by taking price changes for each item in the predetermined group of goods and averaging them.
The first chart below highlights how the CPI changed on a month-to-month basis between 2019 and 2024. Currently in 2024, the region’s prices were up 0.6 percent in the month of February. The highlights for the change include:
•Overall food prices remained unchanged, but the price of meat, fish, poultry and eggs increase 0.5 percent.
•The energy index increased by 4 percent over the month, due almost entirely to an increased price in gasoline (8 percent). There was a 1.5 percent increase in natural gas services too though.
•Rent (+0.4 percent) and apparel (+ 3.1 percent) also contributed to the increase in the month-to-month CPI increase. This increase was slightly offset by the 0.9 percent decrease in medical care services though.
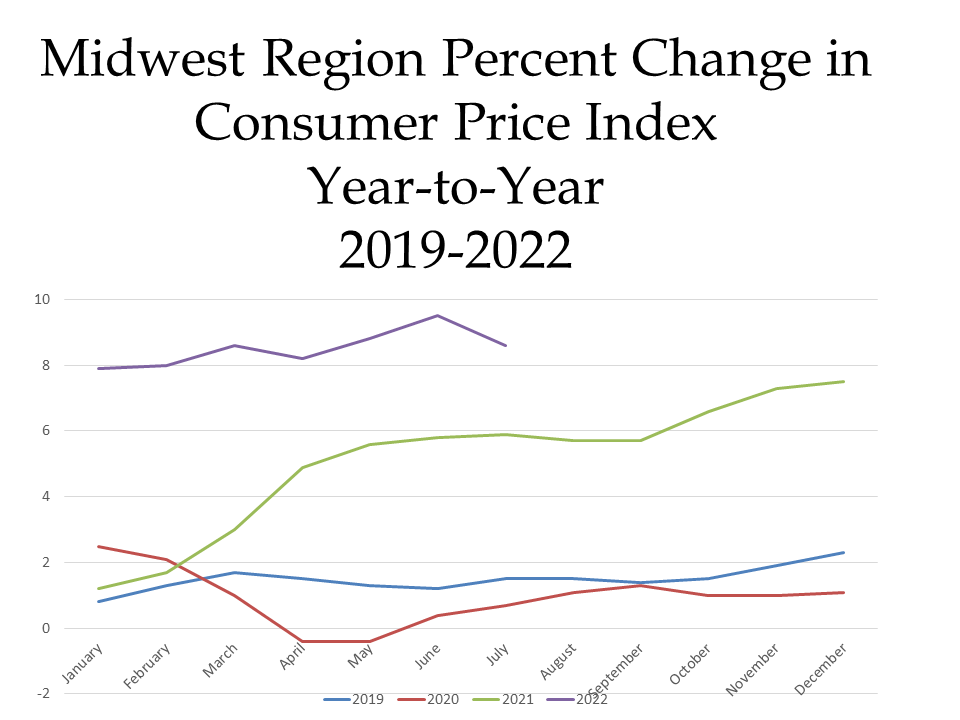
When examining the second chart, which shows how prices changed on a year-to-year basis, we see how the CPI advanced by 2.8 percent from the last year.
In January of 2024 the CPI was reported to be 2.8 percent above what it was the year prior, meaning consumer prices continue to rise. Contributing factors to the continued increase in the CPI include
•Food prices increasing 2.2 percent over the last year, with “away from home” food prices increasing 3.9 percent
•The cost of electricity decreased by 5.1 percent, with the 11.3 percent decline in the price of natural gas slightly offsetting the 4.5 percent increase in prices paid for electricity.
•Owners’ equivalent rent of residences increasing 6.5 percent and rent of primary residence increasing 6.3 percent.


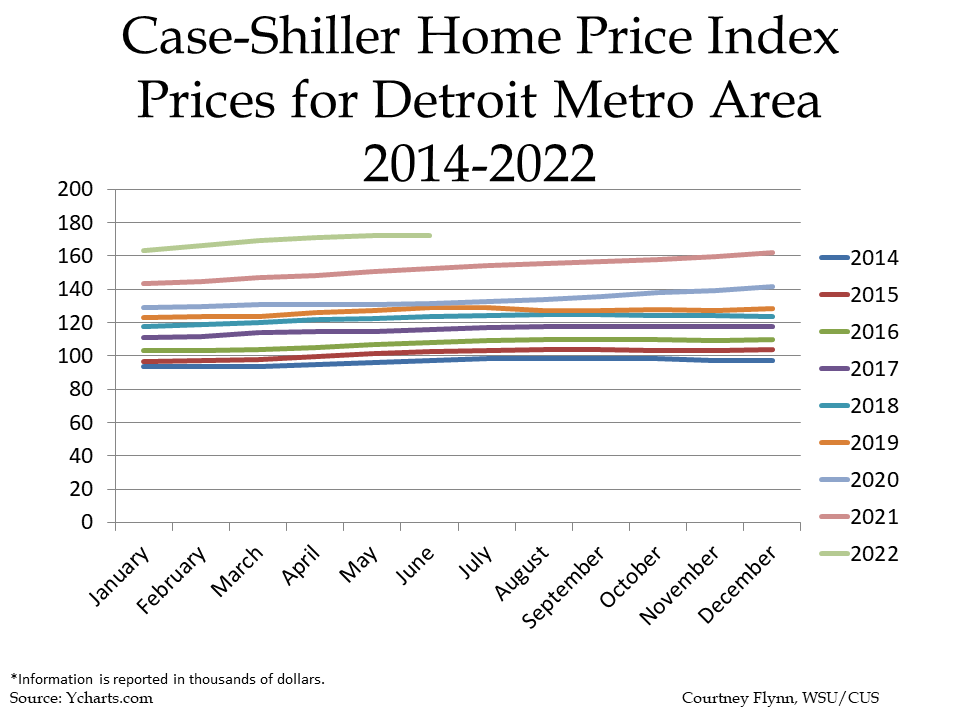
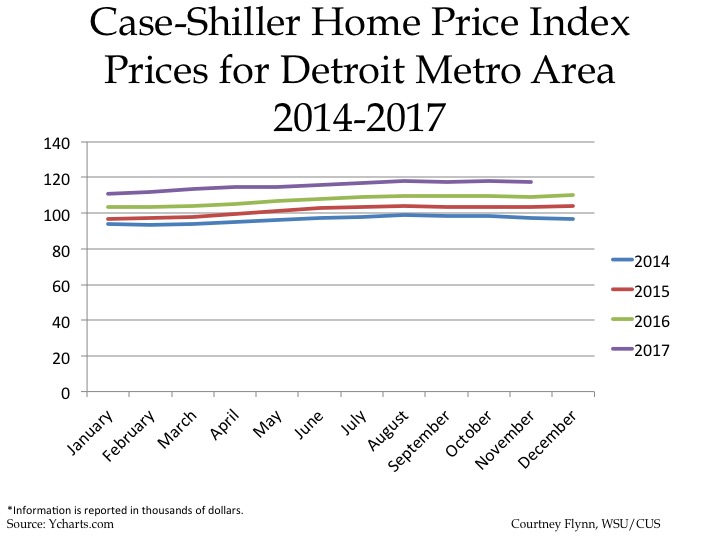
Home prices in Metro-Detroit for 2023 again set a record. In December of 2023, the average price of a single-family dwelling sold in December of 2023 was $182,890, according to the Case Shiller Index. In January of 2023, the average price of single-family dwellings sold was $168,300, which is a $14,590 difference from what the average prices were at the end of the year. While average home prices during the first six months of 2023 remained on par with what they were in 2022, the data shows that price began to increase again in latter part of the year.
Between December of 2023 and 2022 the average price of a single-family dwelling increased $13,400; between December of 2023 and 2020 the price increased $41,230 and between December of 2023 and 2014 the average price has increased $85,900.


With the cost of home prices increasing, it also appears the number of building permits being pulled in Southeast Michigan have been declining overall since 2021. The number of single-family dwelling building permits pulled in March of 2021 was the peak between then and now. At that time, 618 single-family dwelling building permits were pulled. The highest number of single-family dwelling building permits pulled in 2023 was 494 (March, 2023). While Michigan Gov. Gretchen Whitmer said in her 2024 State of the State address that we need more housing to decrease the cost to purchase/rent a home, building is actually declining.
According to a February 2024 Detroit Free Press article, some reasons for the decline in building new single-family dwelling units are the cost to build, modest statewide population growth and a shortage of skilled trade workers. Also, increased costs to build a home means those homes cost more to purchase, which is also proving to be difficult in today’s economy.