More Underfunded Retiree Healthcare Plans than Pension Plans in Southeastern Michigan

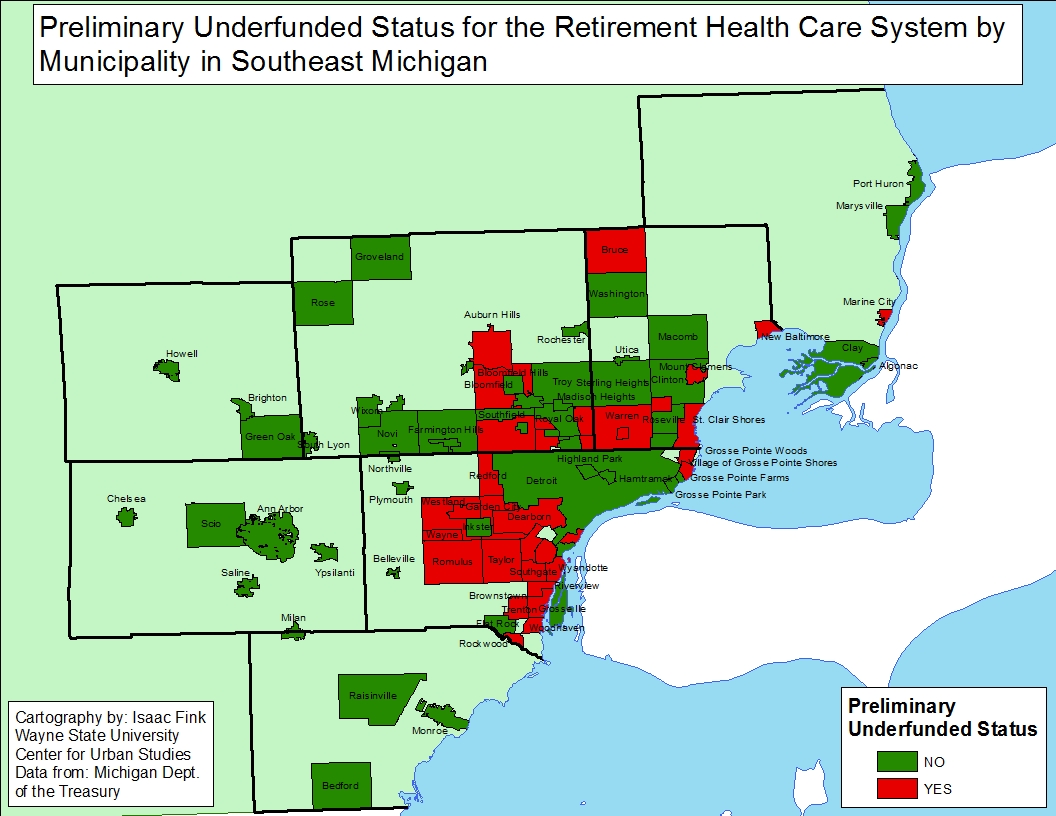
In Southeastern Michigan more government entities were found to have underfunded retiree healthcare plans than the number of government entities with underfunded pension plans. According to the data provided by the Michigan Department of Treasury there were 50 underfunded retiree healthcare systems of the 183 government entities that had provided their financial information to the State as of June 9, 2018. A government entity’s retiree healthcare plan is deemed underfunded by the State if it is less than 40 percent funded and has an annual contribution greater than 12 percent of government funds.

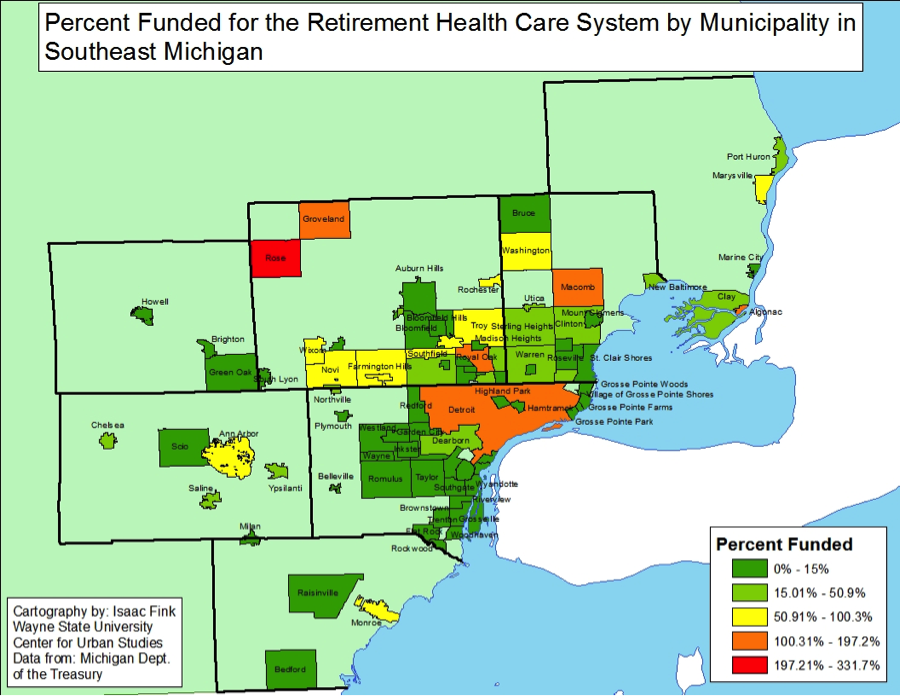
Of the municipalities that were deemed funded by the State, Rose Township had the highest funding percentage for municipalities at 331 percent. Other municipalities with retiree healthcare funding above 100 percent are:

Municipalities

  • Rose Township: 331%
  • Groveland Township: 197%
  • Algonac: 163%
  • Oakland County: 127%
  • Detroit: 121%
  • Macomb Township: 114%
  • Royal Oak: 107%
  • Pontiac (Police and Fire): 105%
  • Milford: 104%
  • Farmington Hills: 100%

Special Districts

  • West Bloomfield Public Township Public Library: 147%
  • Brighton Area Fire Authority: 109%

While there was about a dozen different Southeastern Michigan government entities with more than 100 percent of the retiree healthcare plans funded, there were also 37 entities that had 0 percent of the retiree healthcare plan funded. However, not all of these entities were deemed underfunded, rather only 18 were. Not all government entities that fell below the 40 percent threshold were deemed underfunded due to the fact they were contributing less than 12 percent of their revenue to fund the plan. For example, the City of Brighton has 11 percent of its retiree healthcare funded, but according to the Michigan Department of Treasury, the city’s annual contribution to the plan is 10.4 percent of the City’s revenue. This is less than the 12 percent trigger point set by the State.

As with pension systems, funding retiree healthcare systems is vital not only to a government entity’s financial healthy, but also to retention and recruitment of employees.


More than 50 percent of Wayne County children on Medicaid

Medicaid and MI Child are two different programs that provide children in the state of Michigan with the opportunity to have health care coverage. Medicaid is a federal health care coverage program that provides services to about 43 million children nationally; it is jointly funded by the federal government and each state. In Michigan, a child is automatically referred to the Healthy Kids Medicaid Program (Michigan’s child Medicaid program) if their family’s annual income is at or below 150 percent of the Federal Poverty Level, according to the Michigan Department of Community Health.

MI Child is Michigan’s version of the Child Health Insurance Program (CHIP), a federal initiative created by Congress in 1997 that is offered to uninsured children, ages 19 and below, of working parents. This program is also jointly funded by the federal government and states but its match rate, according to Medicaid.gov is typically about 15 percent higher than Medicaid; according to the Michigan League for Public Policy funding for this program is currently at risk. According to the Michigan League for Public Policy, this program was created to provide children with quality healthcare when their family earns too much to qualify for Medicaid but cannot afford private coverage. To qualify for MI Child, the child must have no comprehensive health insurance and the parents must have a gross adjusted income between 160-212 percent of the Federal Poverty Level, according to the MI Child Manual. For a family of four to be eligible for MI Child, the annual income limit is $47,700, according to the Michigan Department of Community Health.

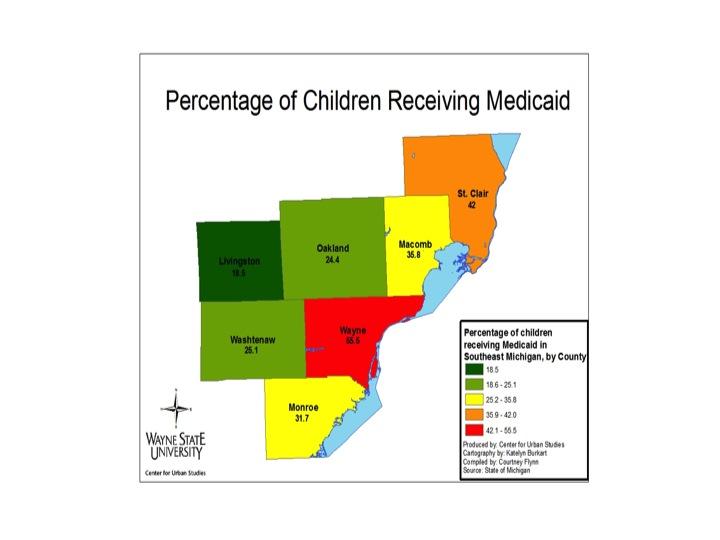
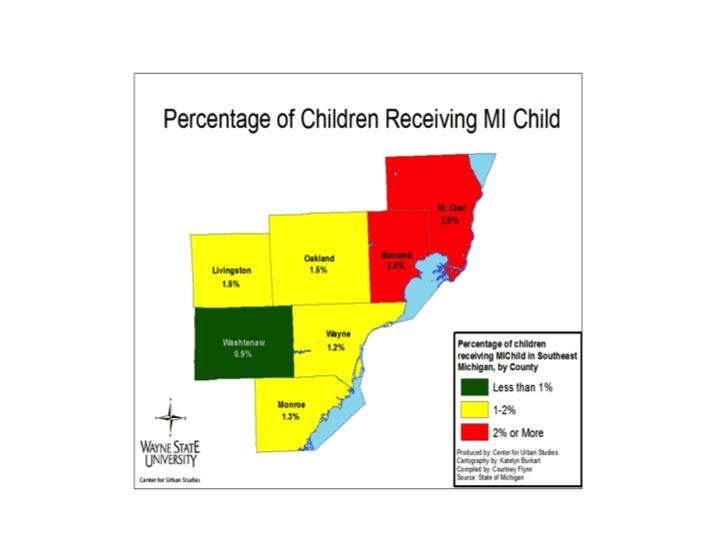
In the maps below we see that there is a higher percentage of children covered by Medicaid in Southeastern Michigan than on MI Child. Also, while Wayne County had the highest percentage of children on Medicaid, Macomb County had the highest percentage of children with MI Child as their health insurance coverage plan. Overall though, each county had a higher percentage of children with Medicaid coverage than with MI Child coverage. This means that among those who applied for government health care coverage for their child, there was a higher percentage of families with income levels at or below 160 percent of the Federal Poverty Level than families with a gross income level between 160-212 percent of the Federal Poverty Level.

In the seven county region of Southeast Michigan, Wayne County had the highest percentage of children with Medicaid coverage in 2013, according to the Michigan League for Public Policy. In total, 55.5 percent of children aged 19 and under in Wayne County received Medicaid coverage in 2013. This amounted to about 258,000 children. The county with the second highest percentage of children receiving Medicaid coverage in the region in 2013 was St. Clair (42 percent or approximately 16,250 children).

Livingston County had the lowest percentage of children receiving Medicaid coverage with 18.5 percent in 2013. That same year, 40.8 percent of Michigan children received Medicaid coverage.

As noted, MI Child is Michigan’s version of the CHIP initiated by Congress in 1997 to provide healthcare to children who don’t qualify for Medicaid but whose families cannot afford private insurance. In the region, the percentage of children with MI Child coverage is smaller than those with Medicaid. For example, Macomb County had the highest percentage of children with MI Child coverage in the region in 2013 at 2.4 percent. During the same time period, 35.8 percent of Macomb County children received Medicaid coverage. Of the counties examined, Washtenaw County had the lowest percentage of children aged 19 and under receiving MI Child coverage in 2013 at .9 percent.

Jobs in healthcare on the rise

A look at the information presented below shows the numbers of healthcare related jobs becoming available are on the rise. As this industry is expected to grow in the Detroit area (Lapeer, Monroe, Macomb, Oakland, St. Clair and Wayne counties) job loss in the manufacturing industry is expected to continue through 2018. Overall in the area there is expected to be about 112,000 more jobs added to the Detroit area labor market through 2018; this is a 5.5 percent growth.

All of the information presented on job growth and decline spans over 10 years, from 2008 to 2018.

Of the industry and occupation forecasts examined in this post, the industry forecasts are produced by the Michigan Department of Management, Technology and Budget.  The industry forecasts are based on historical job trends in the specific industry and the expected short-term, or long-term demand, in those sectors. These demands are determined by industry experts and the Michigan Department of Management, Technology and Budget. Once the industry projections are produced, information on occupational staffing patterns and the shifting trends in such occupational patterns are examined. The examination of these patterns is then used to generate the occupational forecasts.

According to the Michigan Department of Management, Technology and Budget, since a specific occupation is often found in many industries, the relative concentration of an occupation in high demand or low demand industries impacts the overall expected growth rate.  Technology factors are also used because the impact of technological change can decrease or increase future jobs in specific occupations.

growth1

growth2

The above charts show the top 10 jobs the Michigan Department of Technology, Management and Budget predicts will experience the highest percent of growth from 2008-2018 in the Detroit area. While the percentage of growth for the above occupations range from 48 to 26 percent, the raw numbers show the growth will not be that significant. For example, there is a projected 36.3 percent growth in the financial examiner occupation in the Detroit area through 2018. However, when looking at the raw numbers it shows that 36 percent growth is equivalent to 65 jobs over a 10 year span.

Occupations are defined as a set of activities or tasks that persons are paid to perform. Someone can have the same occupation as another person and not be employed in the same industry.

growth3

The above chart shows the expected top 10 growing occupations in the Detroit area through 2018, based on raw or absolute numbers. While three health related occupations are on the top 10 list based on percent of growth, they did not make this top 10 list on raw numbers. According to the Michigan Department of Technology, Management and Budget, healthcare practitioners and technical related occupations will experience the most growth with an expected 18,911 increase in jobs through 2018. There are four healthcare related occupations that are expected to add about 92,000 jobs in the Detroit area in the coming years. The two computer and technology occupations on the list are expected to add about 19,000 jobs.

growth4

growth5

While health and computer related fields are among the occupations suggested to experience growth through 2018, it is the manual labor based jobs that are suggested to decline, according to the Michigan Department of Technology, Management and Budget. The above two charts show the top 10 declining occupations in the Detroit area based on percent of decline. Drilling and boring occupations are expected to decline the most by percent through 2018. However, when looking at the raw numbers of the 10 occupations shown above, postal service sorters and processors are expected lose the most number of jobs.

growth6

When examining the top 10 occupations expected to experience the most job loss through 2018 based on raw numbers, most are related to manufacturing processes.  There is only one listed in the top 10 declining occupations based on percent decline. This occupation is the postal service sorters and processors. The Michigan Department of Technology, Management and Budget expects there to be a loss of 1,006 positions in this occupation through 2018. The production occupation is expected to experience the largest decline in jobs, based on raw numbers from 2008 to 2018. There is an estimated loss of 16,818 jobs.

growth8

growth9

Of the top 10 growing industries in the Detroit area, based on percent growth, three are healthcare related and one is technology related. When examining the raw numbers of the top 10 growing industries based on percent growth the healthcare and social assistance industry is expected to grow the most, by 47,421 jobs in the 10 year period.

An industry is a group of establishments that produces similar goods and services.

growth10

When just examining the raw numbers of expected job increases of the top growing industries in the Detroit area, the healthcare and social assistance industry is expected to experience the most amount of growth. This industry is expected to produce an additional 47,421 jobs through 2018.

Slide18

Slide19

When looking at the raw numbers of the industries presented in the above two charts, fabricated metal product manufacturing is expected to experience the largest decline with a loss of 4,144 jobs. Machine manufacturing came in closely behind with an expected loss of 3,836 jobs.

Slide21

When examining declining industries in the Detroit area, six of the top 10 declining industries, based on percent of decline, match those on the top 10 declining list based on just the raw numbers.  Of those six that match both lists, four industries are manufacturing based. Overall, the Michigan Department of Technology, Management and Budget is expecting a loss of 40,332 manufacturing related industry jobs in the Detroit area through 2018.

For further information on Michigan’s “Hot 50” jobs visit here.