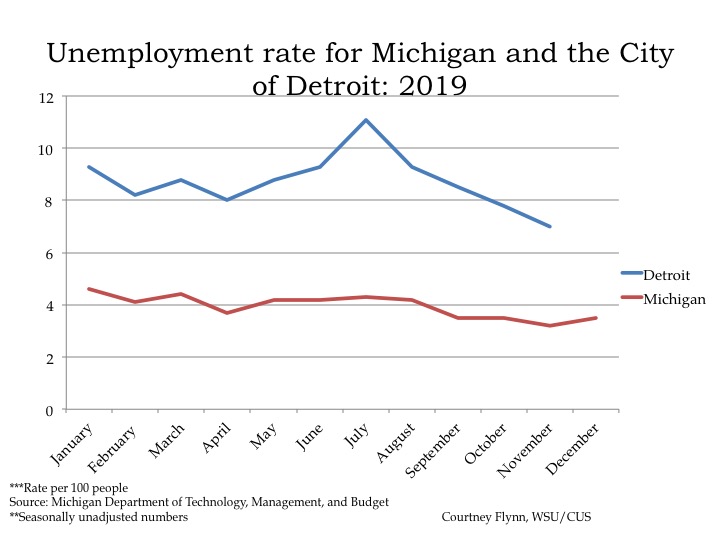
In December of 2019 the unemployment rate for the State of Michigan was 3.5, which is 0.6 percentage points lower than what it was in 2018 (4.1), according to the most recent data provided by the Michigan Department of Technology, Management and Budget. The State unemployment rate of 3.5 in December was the same as it was in September and October of 2019. However, it was 0.3 points higher than it was in the previous month.
December unemployment data at the local level is not yet available from the Michigan Department of Technology, Management and Budget, but the November 2019 unemployment rate for the City of Detroit was 7 percent, which is the lowest it was all year. The November unemployment rate was 0.8 percentage points lower than the October 2019 unemployment rate (7.8 percent) and also 0.8 percentage points lower than the November 2018 Detroit unemployment rate.
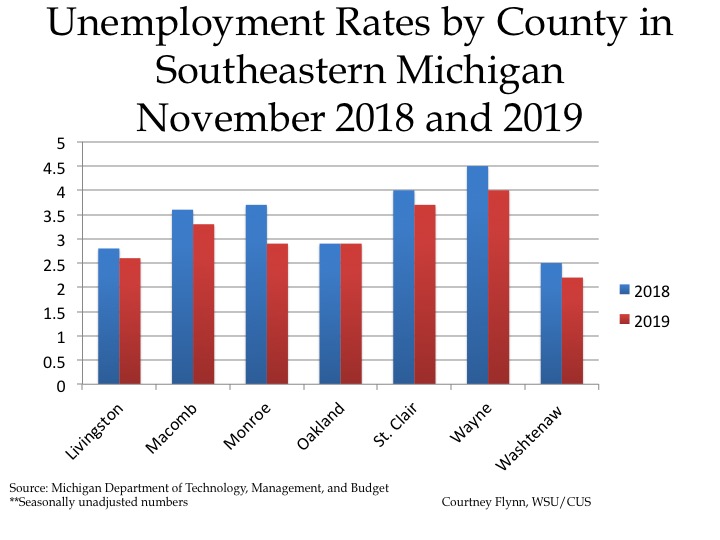
The chart above displays the unemployment rates for each of the seven counties in Southeastern Michigan for November of 2018 and 2019. In November of 2019 Wayne County had the highest unemployment rate at 4. Washtenaw County had the lowest unemployment rate at 2.2.
Between November of 2018 and 2019 each county in the region had a lower unemployment rate in 2019 than the previous year, with the exception of Oakland County. In both November of 2018 and 2019 Oakland County had an unemployment rate of 2.9. In that same time span Monroe County had the largest difference in unemployment rates. In November 2018 the Monroe County unemployment rate was 3.7 and in November 2019 the unemployment rate was 2.9.
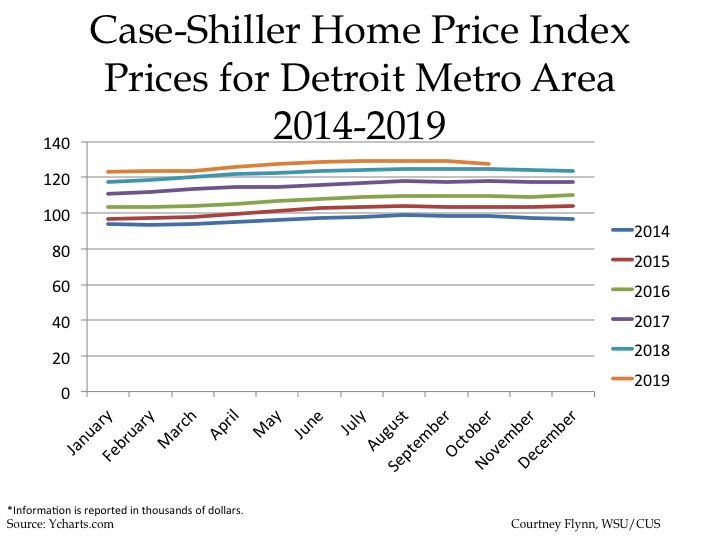
The above chart shows the Standard and Poor’s Case-Shiller Home Price Index for the Detroit Metropolitan Statistical Area. The index includes the price for homes that have sold but does not include the price of new home construction, condos, or homes that have been remodeled.
According to the index, the average price
of single-family dwellings sold in Metro Detroit was $129,250
in October
2019;
this was $1,540
lower
than the
average family dwelling price in September. The September 2019 price
was an increase of $3,170 from October
of 2018
and an increase of $9,860 from October
of 2017,
an increase of $17,920
from October
of 2016
and increase of $24,440
from October
of 2015
and, finally, an increase of
$29,490 from October
of 2014.