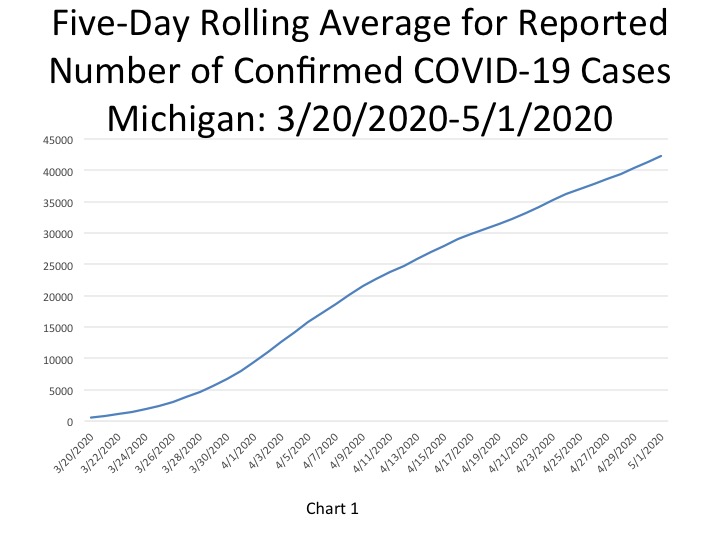
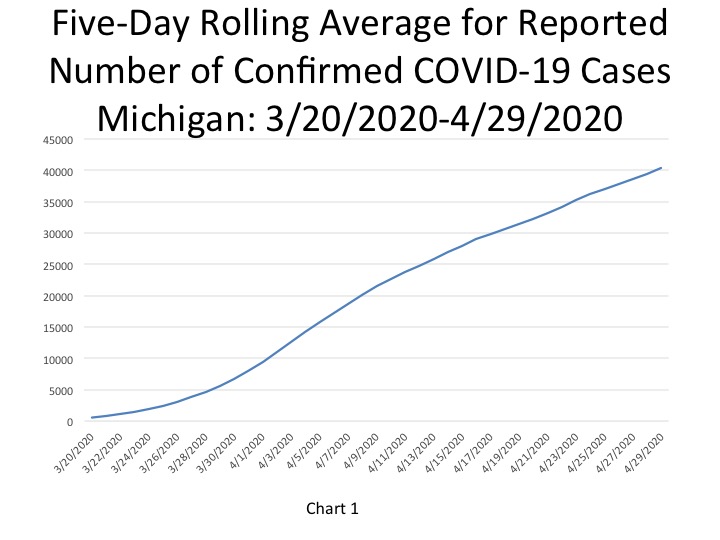
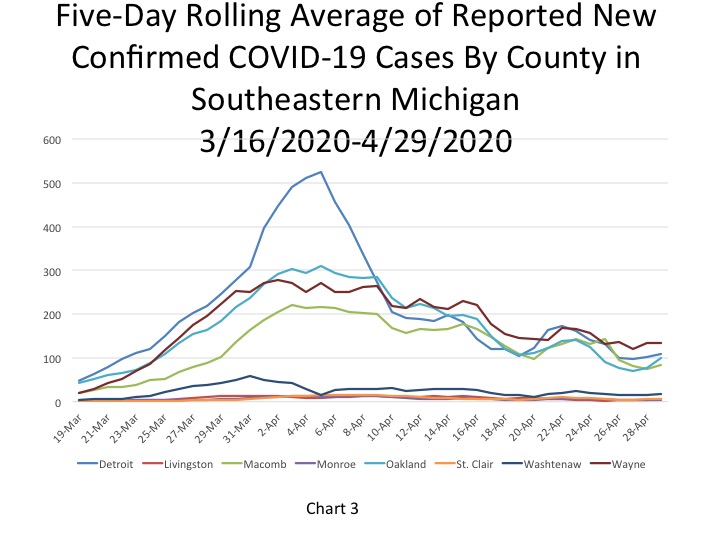
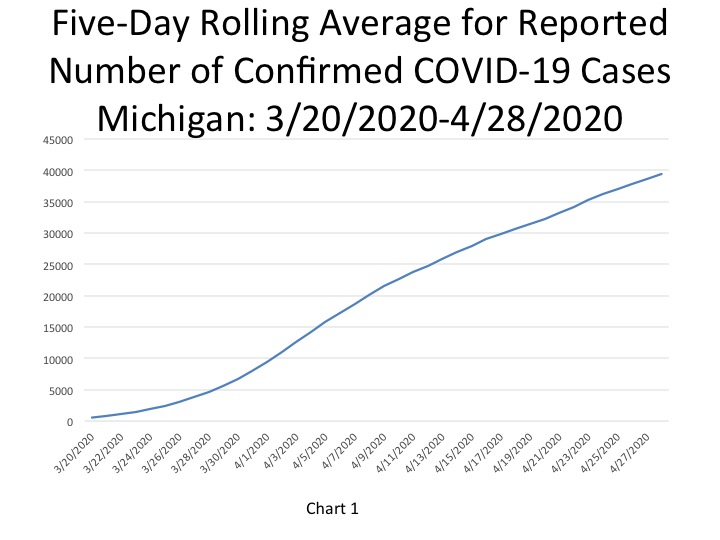
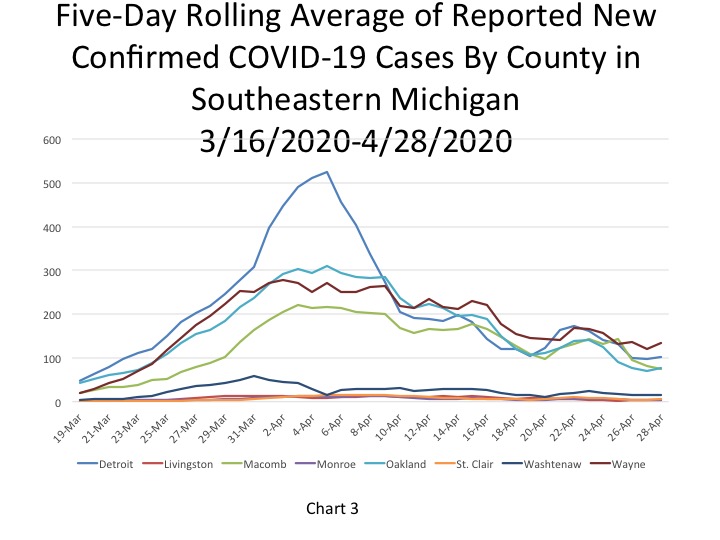
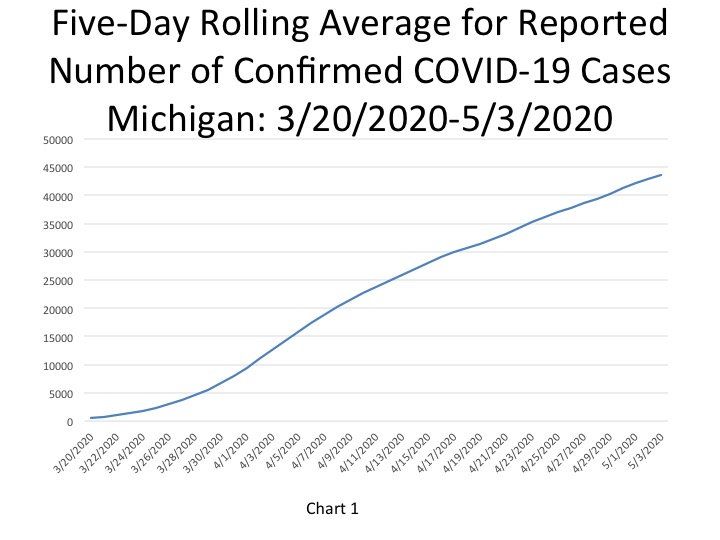
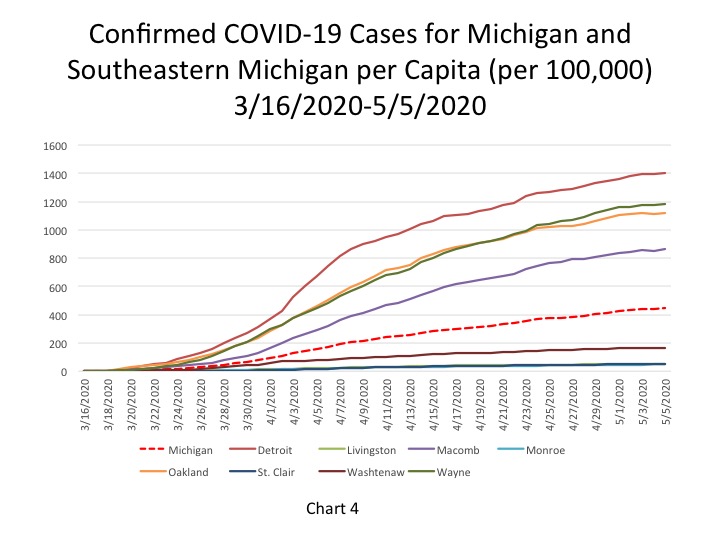
According to the State of Michigan, the total number of COVID cases in Michigan rose to 44,397, an increase of 447 cases from the previous day. This total was equivalent to 445 cases per 100,000 people (Chart 4) on May 5. The five-day rolling average for the total number of COVID cases (Chart 1) reflects a smoother curve and adjusts for fluctuations in testing and/or the quality of reporting or failure to report. That curve continues to increase, but the number of new COVID cases (Chart 3) identified each day has been slowly decreasing. Note that this five day rolling average causes these daily case and the daily death charts to lag two days behind.
It should be noted that the May 4 data from the State may not be complete. According to the State, there were software issues that kept some backlogged data from being uploaded on May 4. For some counties, total COVID cases reported on May 4 were less that what was reported on May 3. For such instances (Livingston, Macomb and Oakland counties) we kept the May 4 total COVID cases the same as May 3. Additionally, the data uploaded for May 5 contains 18 hours worth of data, as opposed to 24 hours, due to some of the early data being uploaded late on May 4.
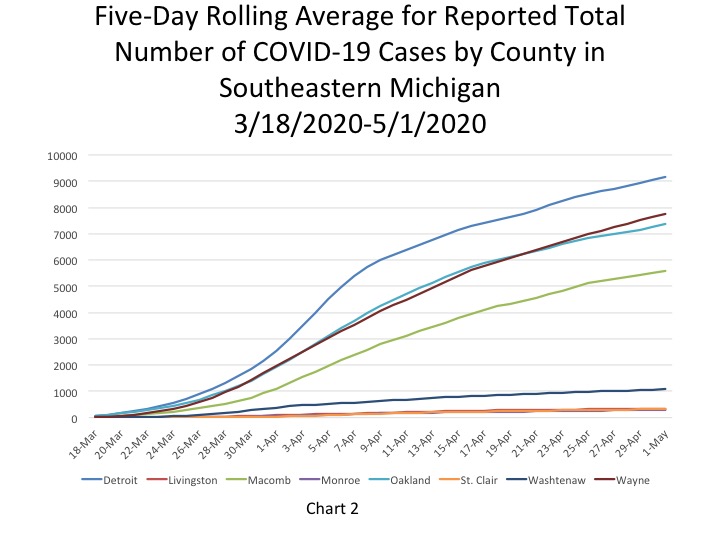
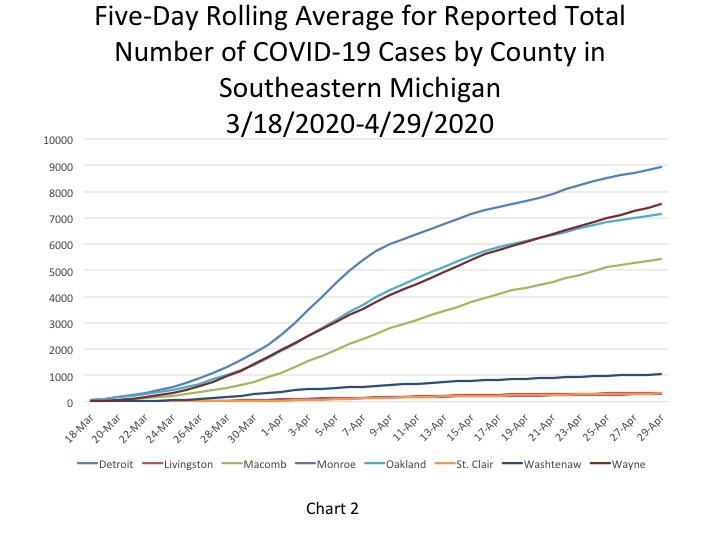
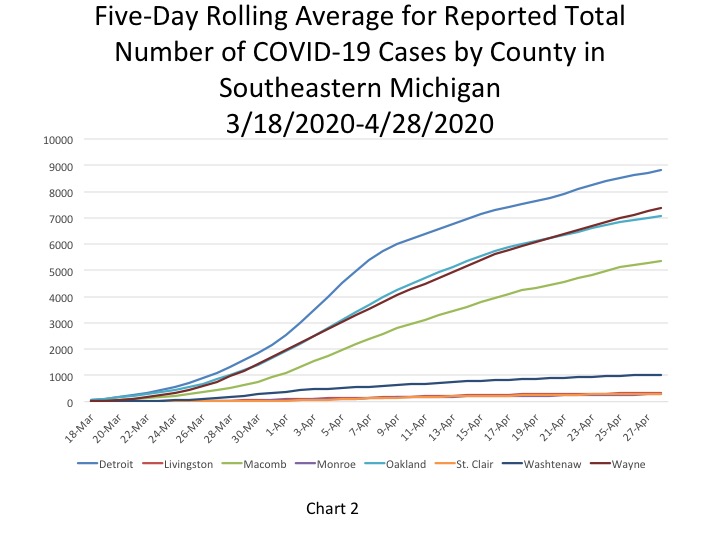
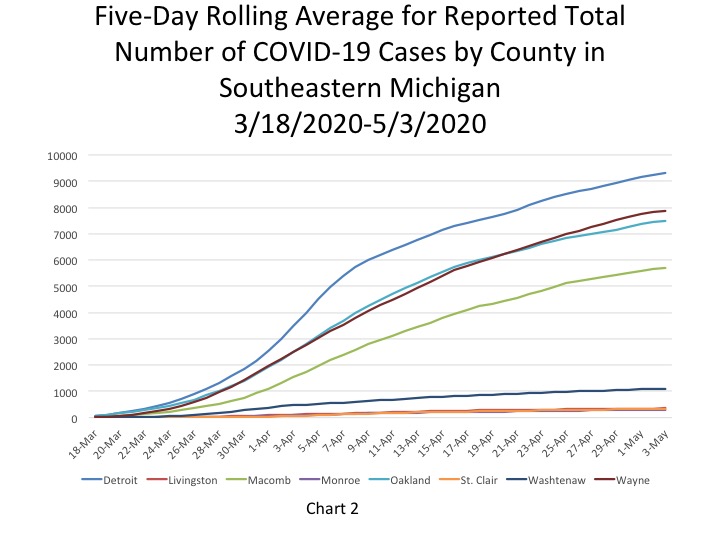
Chart 2 reflects the five-day rolling averages at the County level and for the City of Detroit. Although the overall number of COVID cases across the region continues to increase, the rate of increase has been declining. Detroit still has the highest number of reported COVID cases at 9,329 on May 3, with Wayne County following at a reported 7,887 cases. On May 3, the five-day rolling average for the number of COVID cases in Oakland County was 7,491, and Macomb County reported 5,718.
The daily data highlighted in these posts is from Michigan.gov/coronavirus, where data is updated daily at 3 p.m. Historical data were supplied from covidtracking.com, which republishes COVID data from the State.
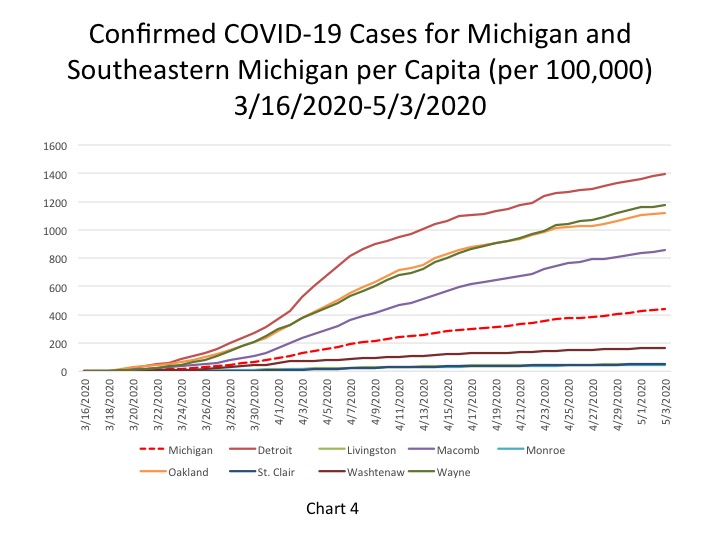
The City of Detroit had 1,401 COVID cases per 100,000 people on May 5, an increase from 1,397 the day before (Chart 4). This is based upon a reported increase of 30 new cases, bringing the total number of COVID cases in Detroit to 9,424. Wayne County reported 1,184 cases per 100,000 people, and Oakland County had 1,118 cases per 100,000 people. These per capita rates were based upon 7,967 total cases for Wayne and 7,522 for Oakland. Macomb County reported 861 cases per 100,000 people, which is based upon 5,756 cases.
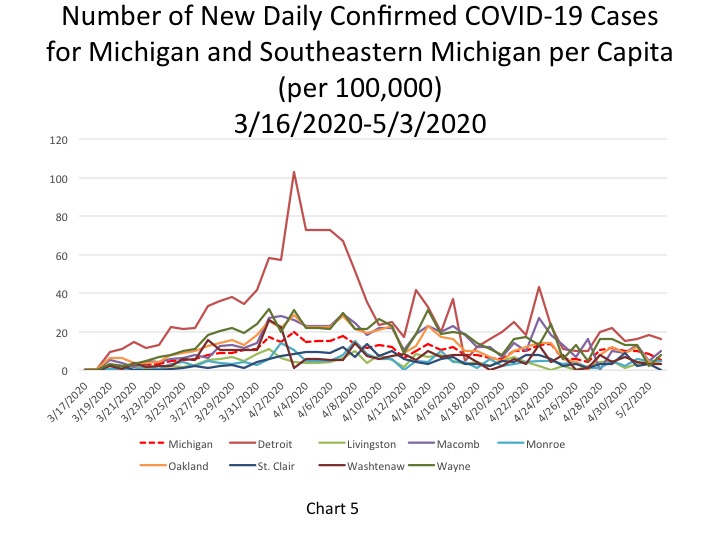
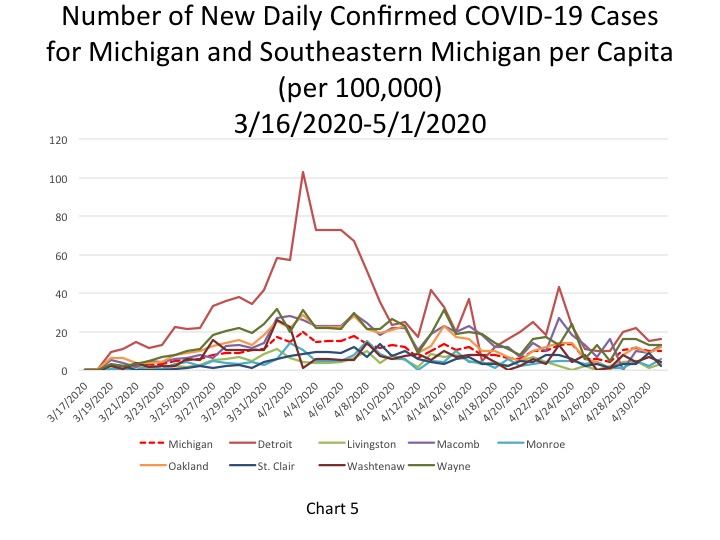
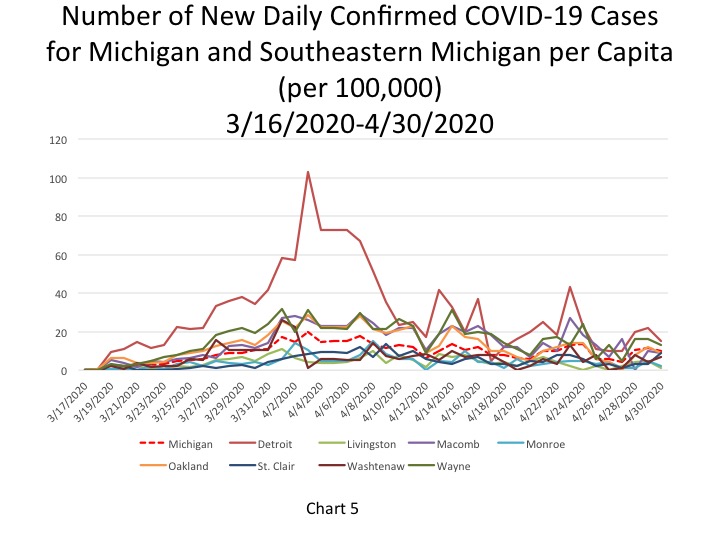
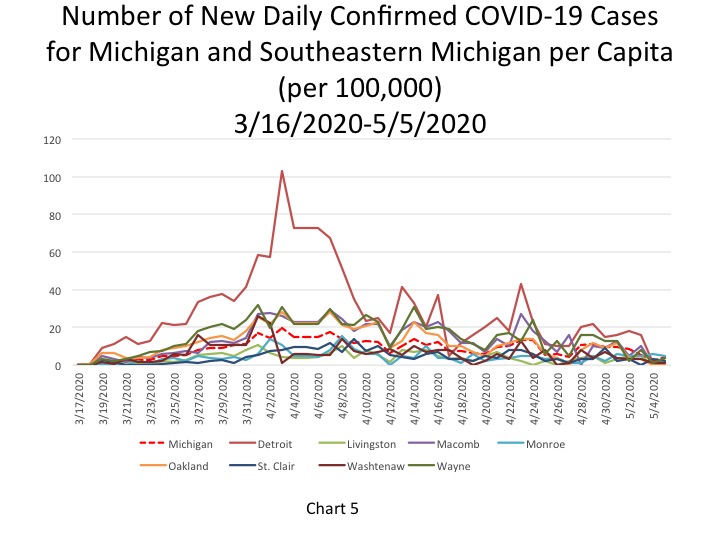
Chart 5 shows that the number of new daily COVID cases has dramatically decreased across the region. On May 5 Detroit reported a rate of 4 new daily COVID cases per 100,000 people, which was equivalent to 30 new cases. Wayne and Macomb counties also reported rates of 4 new daily COVID cases per 100,000 people, with that being equivalent to 47 new cases for Wayne County (the highest in the region) and 33 new cases for Macomb. Oakland County had the lowest per capita rate at 0 new cases per 100,000 people; the County reported 4 new cases on May 5. Monroe County reported the highest per capita rate at 5 new cases per 100,000 people, which was equivalent to 7 new cases.
The State’s per capita rate was 4.4 new cases per 100,000 people, equivalent to 447 new cases.
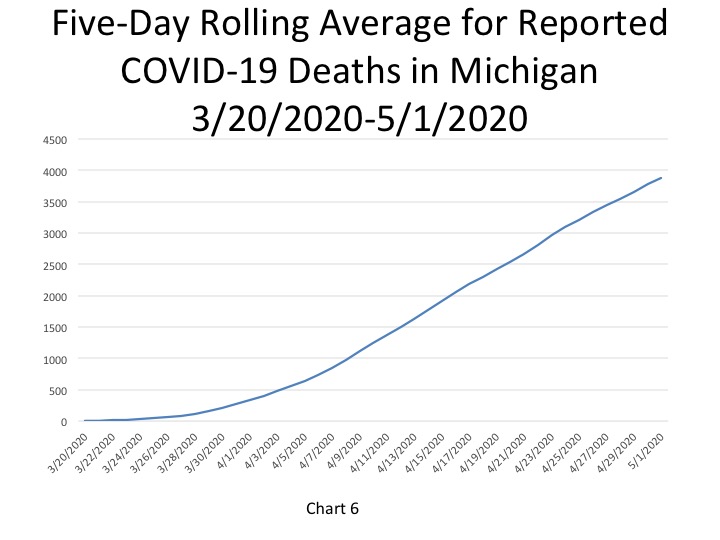
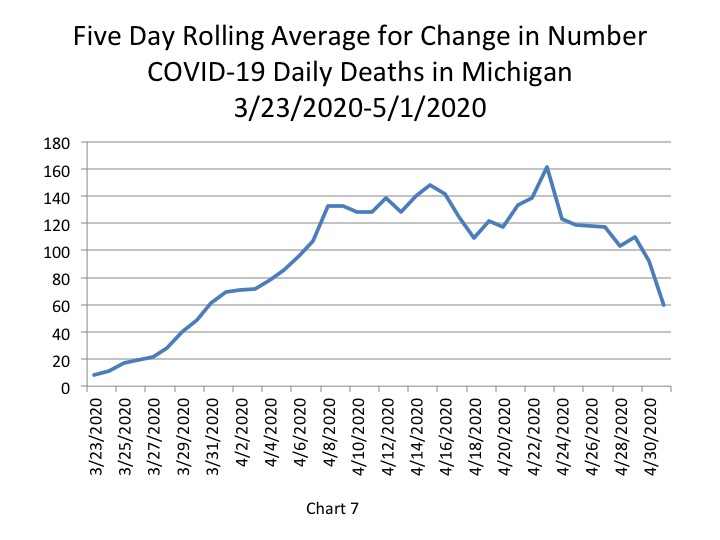
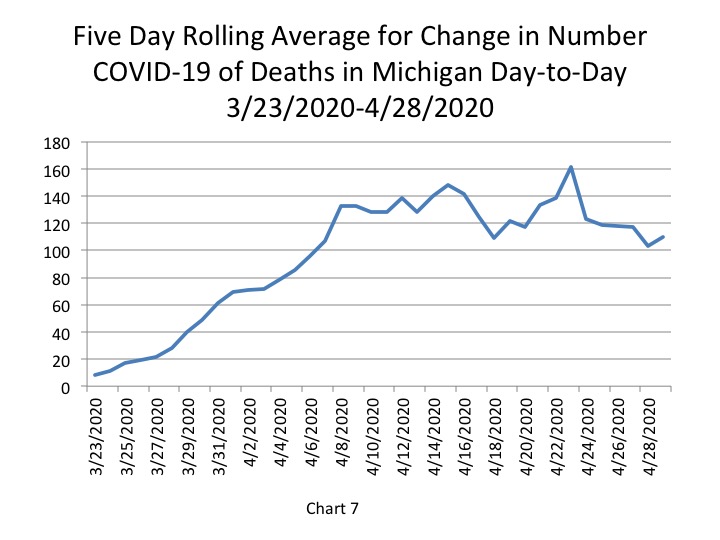
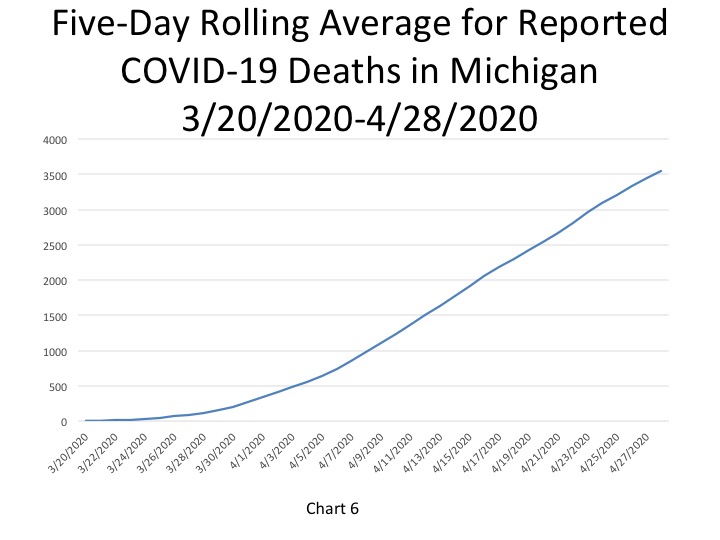
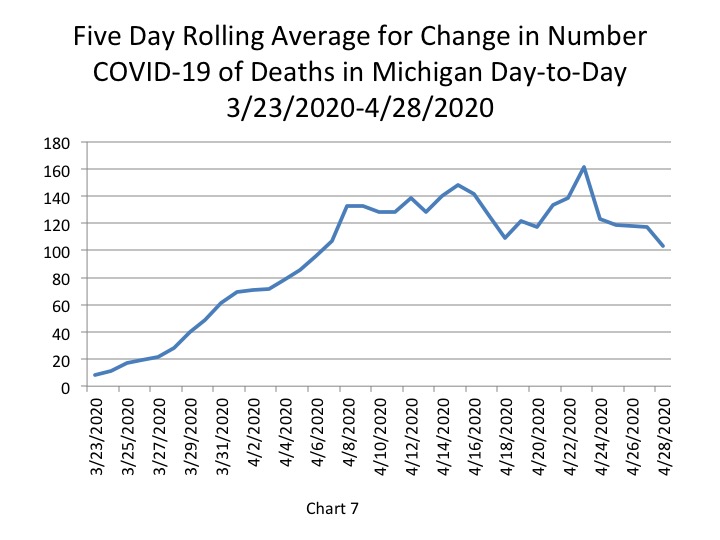
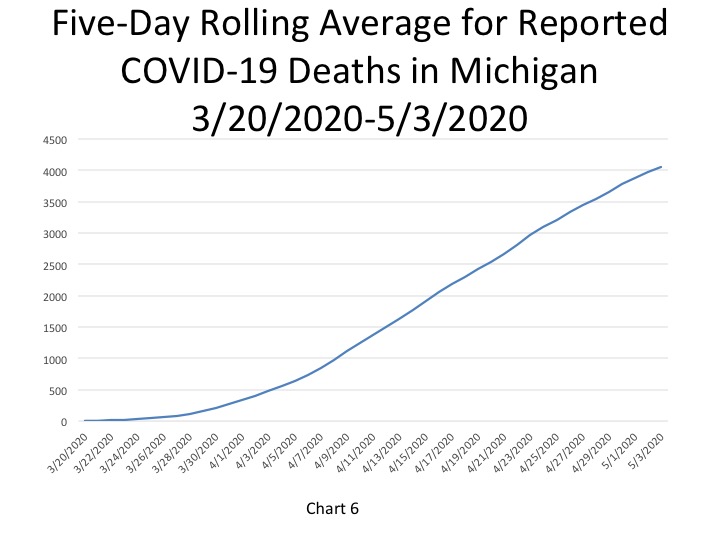
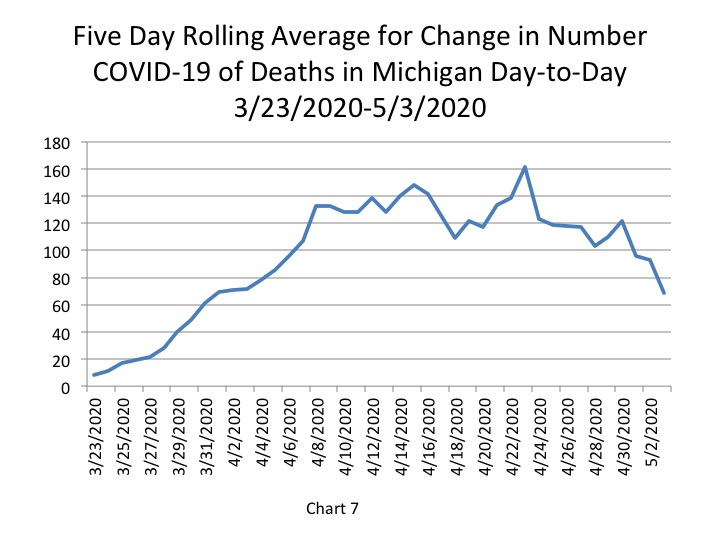
In Chart 6 the five-day rolling average for the number of deaths shows a continuing steady increase (a lagged number of 4,050 deaths, an increase of 69 deaths). The actual reported COVID-19 deaths reached 4,179 on May 5, an increase of 44 deaths from the day prior. Of these, 35 of which were in Southeastern Michigan, and 11 in Detroit. Of those 44 deaths, 8 were identified by reviewing death certificates and the COVID databases and did not occur on the date on which the dataset was collected. Chart 7, a five-day rolling average chart, shows the number of daily additional deaths has been declining overall since April 23. The last time the State reported 69 deaths on a single day was April 1. The trends in Chart 9 further that the number of additional daily deaths at the State level has been declining.
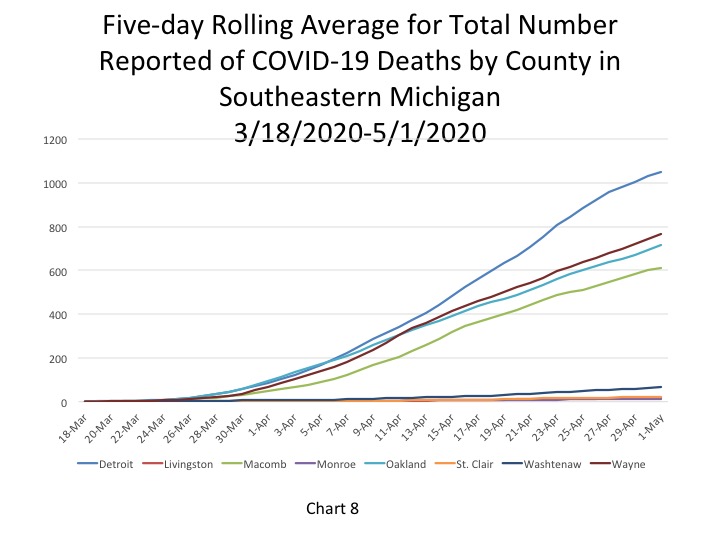
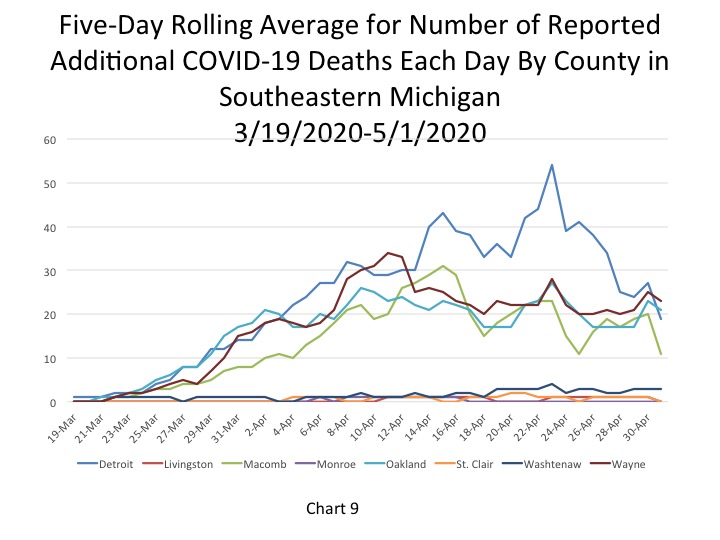
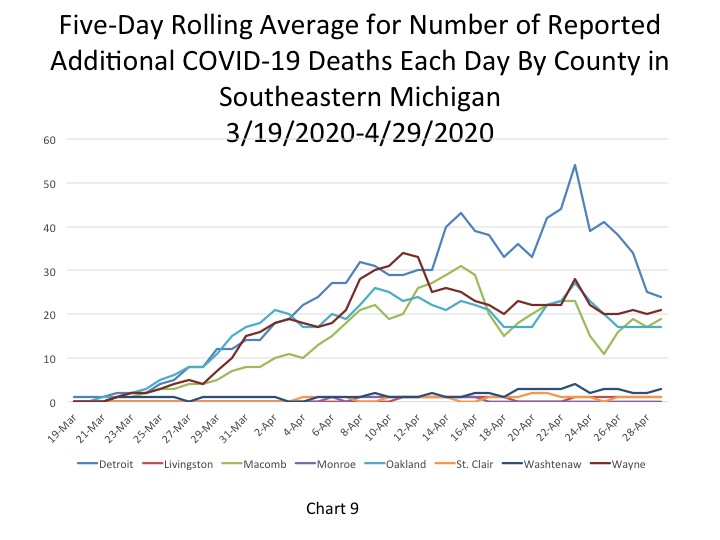
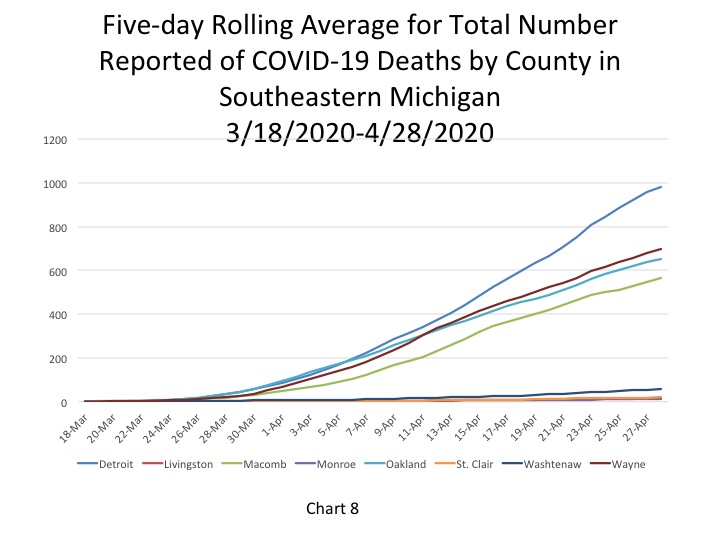
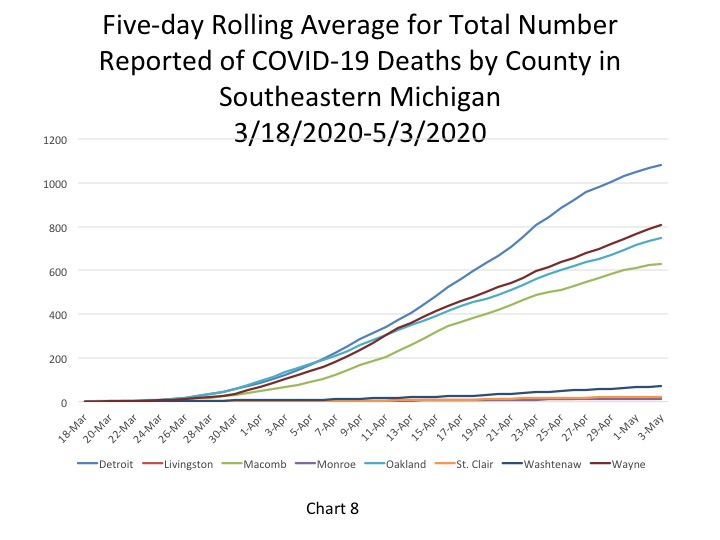
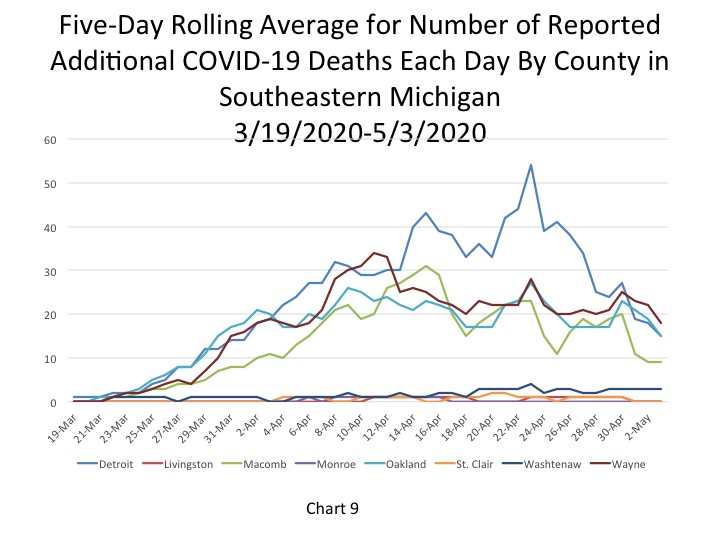
Chart 8, a five-day rolling average for the number of COVID deaths by each county, shows how the number of deaths in Detroit had been rising at a more rapid rate than the other government entities in the region, but now is rising less rapidly. This chart now indicates that the rate of increase for the number of deaths in Detroit has been declining. The rate of increase in the number of daily deaths has been declining across the region, but Wayne County is now adding more daily deaths than Detroit. Of the three largest counties and Detroit, Macomb County’s total number of COVID deaths is increasing at the slowest rate.
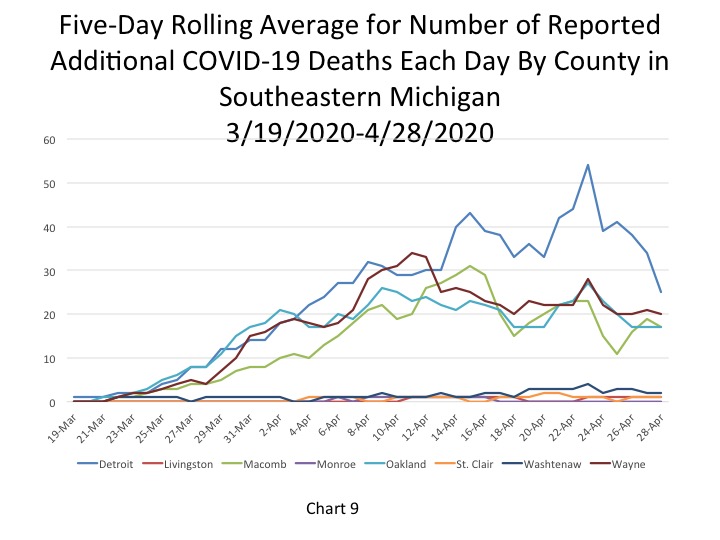
Chart 9 shows that Detroit, Macomb, Oakland and Wayne counties have all experienced a decline in the number of new reported daily deaths, with Detroit experiencing the steepest decline. Wayne County now has the highest number of daily COVID deaths, while Detroit and Oakland County have the same number. Macomb County now has below 10 reported daily deaths. The last time the number of daily deaths were reported as low as they were on May 3 was on April 1.
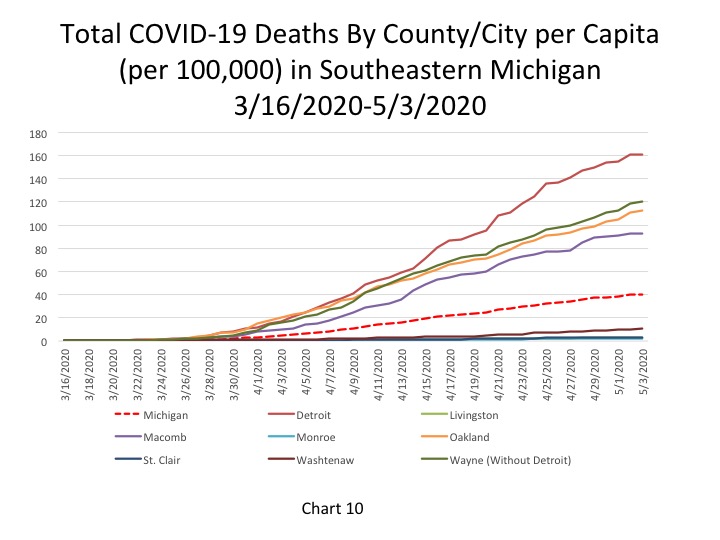
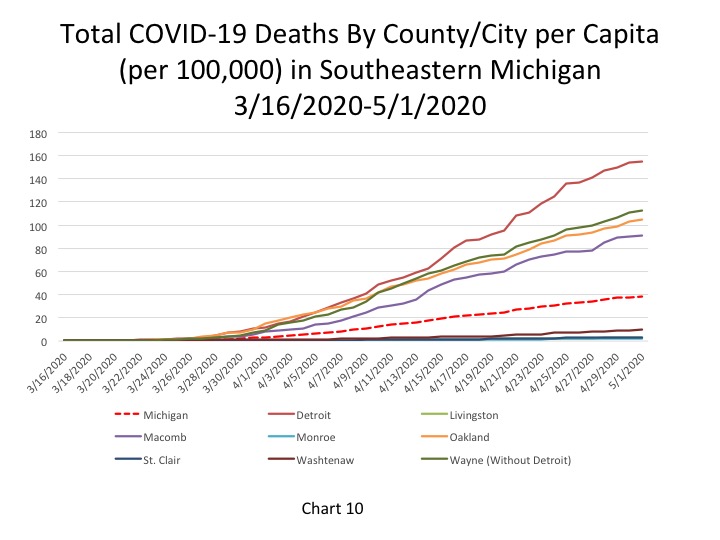
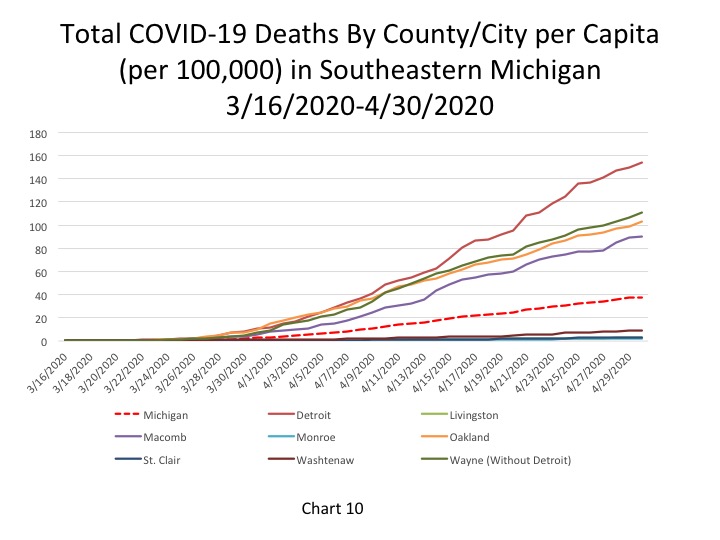
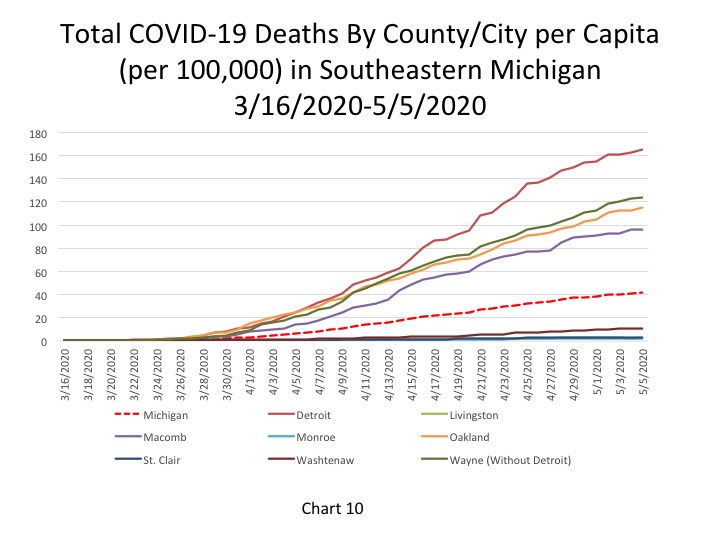
Chart 10 shows the total number of COVID deaths per 100,000 people. As of May 5 Detroit cumulative total was 163 COVID deaths per 100,000 people (representing 1,108 deaths). In Wayne County there were 123 COVID deaths per 100,000 people (837 total deaths), in Oakland County there were 113 deaths per 100,000 people (772 total deaths), and in Macomb County there were 96 COVID deaths per 1000,000 people (647 total). The State of Michigan had 42 COVID deaths per 100,000 people, a rate that continues to remain lower than the four entities discussed above.
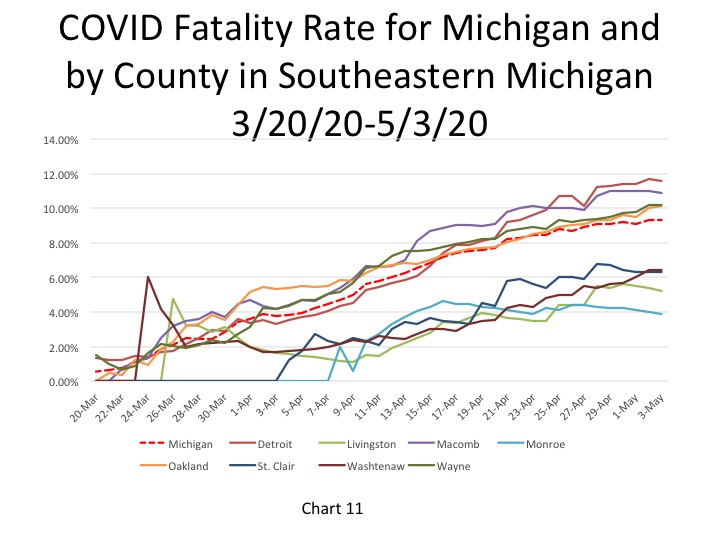
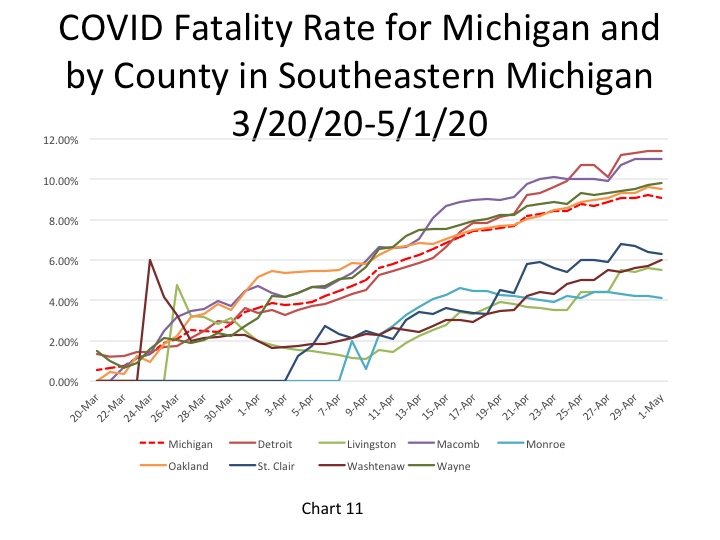
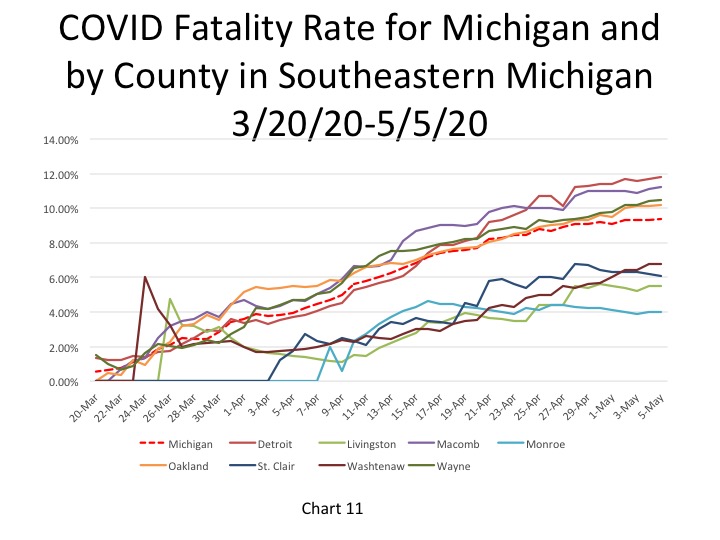
The fatality rates in Detroit and Macomb County remained above 11 percent on May 5; they were reported at 11.8 percent and 11.2 percent, respectively. Wayne County’s fatality rate is also moving in that direction; it was 10.5 percent on May 5. The fatality rate for the State of Michigan was 9.4 percent on May 5; this rate has also been gradually increasing. One reason we may be seeing such high fatality rates in Michigan is due to the low testing rates. When only having-presumably-a lower of number confirmed COVID cases than is actually likely due to the scarce availability of tests, the fatality rate appears higher because the base comparison is smaller than it might be.
The number of COVID deaths continue to decline throughout Southeastern Michigan and the State. Detroit Mayor Mike Duggan recently told the media that the number of COVID deaths in the City is declining at a faster rate than nearly any other City in the Country. He attributed this to a continued commitment to social distancing and residents wearing face masks in public. We do know that social distancing continues to work as officials are now reporting that 10 percent of individuals tested for COVID at the State Fair site in Detroit are testing positive, according to a recent media report. However, a decline in the spread doesn’t mean that social distancing restrictions should be loosened. Area health departments are anticipating a second wave of infection at some point in the near future, and to curb its impact we must remain vigilant.