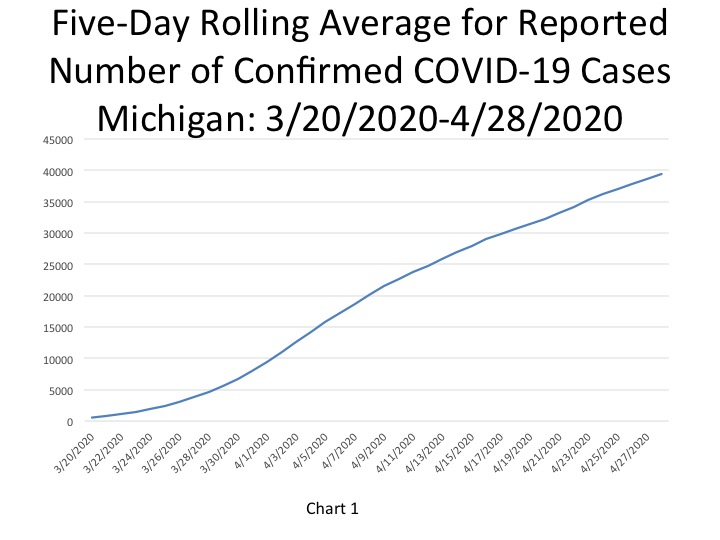
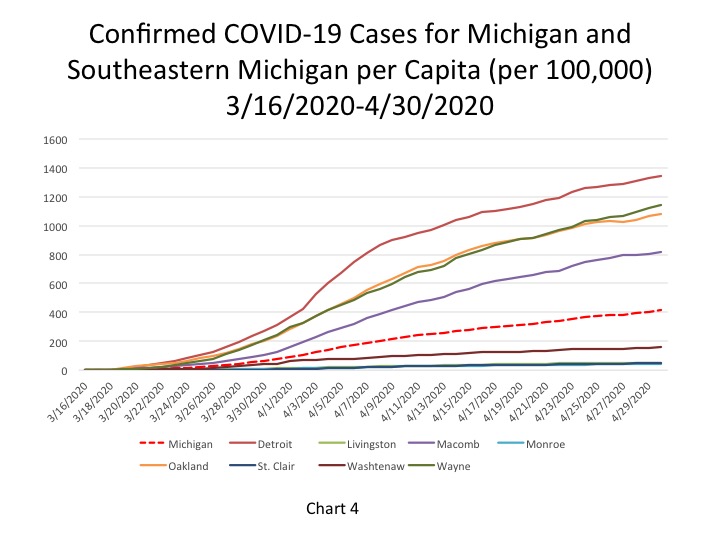
According to the State of Michigan, the total number of COVID cases in Michigan rose to a total of 41,379, an increase of 980 cases from the previous day. This total was equivalent to 414 cases per 100,000 people (Chart 4) on April 30. The five-day rolling average for the total number of COVID cases (Chart 1) reflects a smoother curve and adjusts for fluctuations in testing or the quality of reporting or failure to report. The five day rolling average means our daily case and death charts lags two days behind.
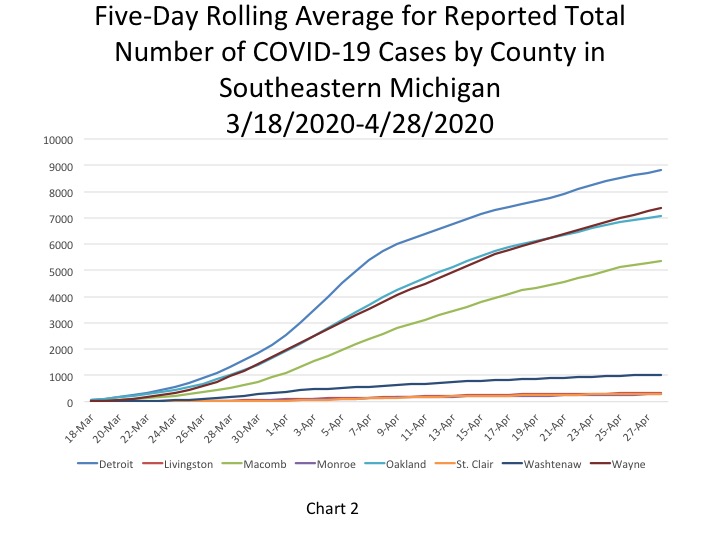
Chart 2 reflects the five-day rolling averages at the County level and for the City of Detroit. We continue to see Detroit and Wayne County having the highest number of cases at 8,823 and 7,380 on April 28, respectively. The chart also highlights how Wayne County continues to pull above Oakland County. Up until about a week ago the number of cases in Wayne County was on par with or below those in Oakland County. This shows that the spread of the virus is increasing in Wayne County and slowing down in Oakland County. On April 28 the five-day rolling average for the number of COVID cases in Oakland County was 7,056. The number of reported cases in Macomb County was 5,366.
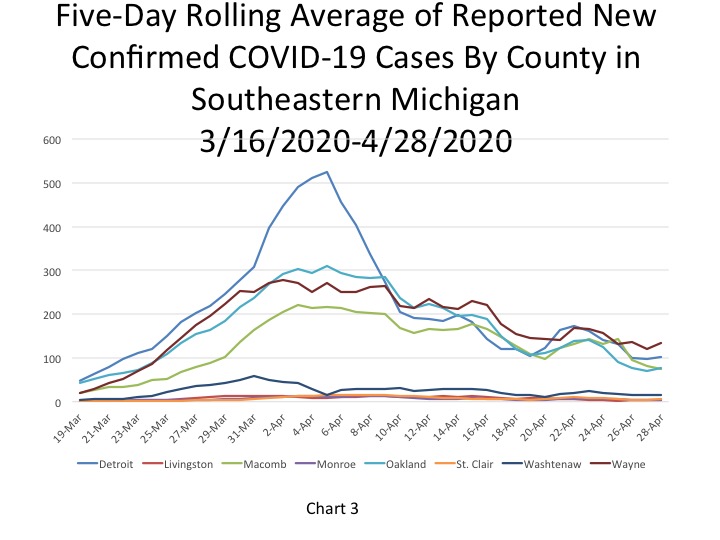
Chart 3 shows that the number of new confirmed cases in Wayne County increased while they began to slightly level off in Oakland County. Detroit also experienced a recent plateau while the number of new cases in Macomb County decreased.
The daily data highlighted in these posts is from Michigan.gov/coronavirus, where data is updated daily at 3 p.m. Historical data was supplied from covidtracking.com, which republishes COVID data from the State.
The City of Detroit had 1,346 COVID cases per 100,000 people on April 30, an increase from 1,332 the day before (Chart 4). This is based upon a reported increase of 100 new cases, bringing the total number of COVID cases in Detroit to 9,057. Wayne County reported 1,141 cases per 100,000 people, and Oakland County had 1,080 cases per 100,000 people. These April 30 per capita rates were based upon 7,672 total cases for Wayne and 7,267 for Oakland. Macomb County reported 820 cases per 100,000 people, which is based upon 5,513 cases.
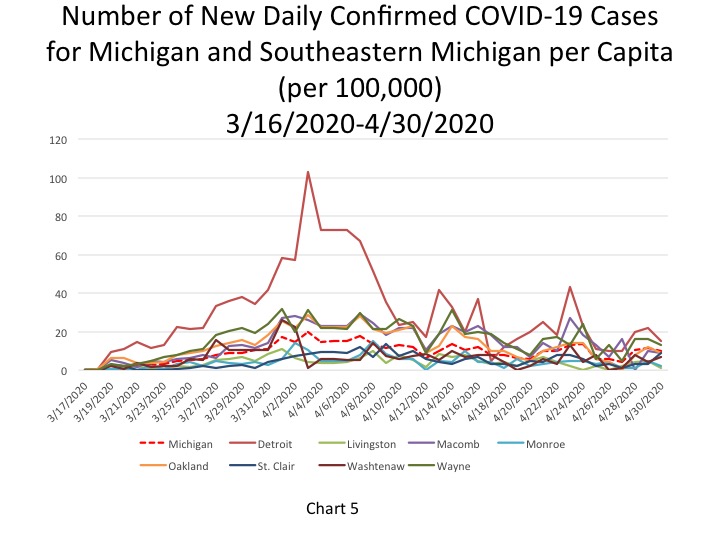
Chart 5 shows that Detroit and Wayne County had the highest number of new COVID cases per 100,000 people on April 30. Detroit had 15 new COVID cases per 100,000 people, which was equivalent to 100 new cases, and Wayne County continued to have 13 new cases per 100,000 people which was equivalent to 135 new cases. Both Detroit and Wayne County experienced a decline in the rate and the number of new daily cases. Similarly, Oakland and Macomb counties also experienced declines in their per capita rates of new COVID cases per 100,000 people; the per capita rate for both counties was 9, which was equivalent to 108 new cases in Oakland County and 83 new cases in Macomb County on April 30. Detroit experienced the largest decline in the number of new cases while Oakland and Wayne counties experienced a decline at the same rate. St. Clair and Washtenaw counties both experienced increases in the rate of new cases.
The State’s per capita rate was 9.8 new cases per 100,000 people, equivalent to 980 new cases.
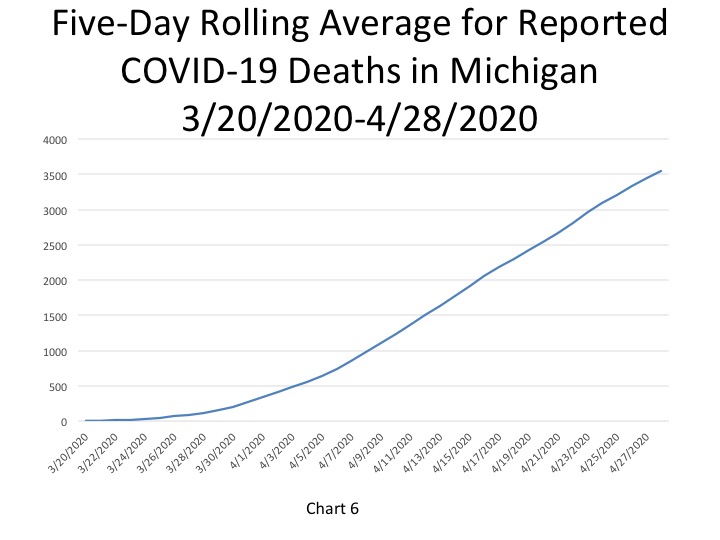
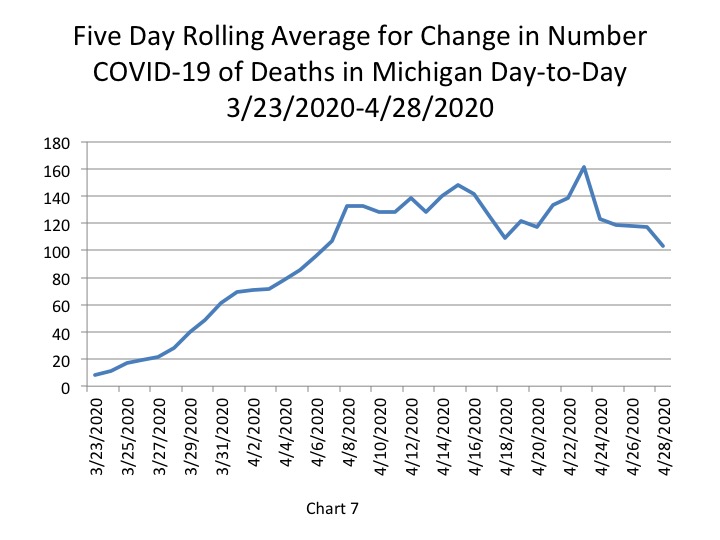
In Chart 6 the five-day rolling average for the number of deaths shows a continuing steady increase (a lagged number of 3,550 deaths, an increase of 103 deaths). The actual reported COVID-19 deaths reached 3,789 on April 30, an increase of 119 deaths from the day prior. Of those 119 new deaths 40 are a result of the Michigan Department of Health and Human Services comparing death certificates with the COVID database so they are not reflective of deaths from the day before. Chart 7, a five-day rolling average chart, shows how the new data reflects a continued decline in the number of additional deaths statewide.
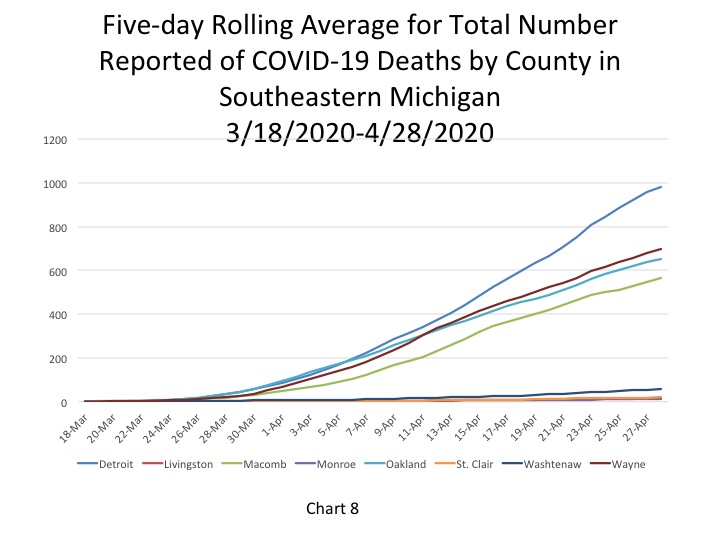
Chart 8, a five-day rolling average for the number of COVID deaths by each county, shows how the number of deaths in Detroit continues to rise at a more rapid rate than any of the other government entities in the region. Detroit also continues to have the highest number of COVID deaths. Wayne, Oakland and Macomb counties all fall behind Detroit regarding total reported death numbers; those numbers are increasing at a slower rate than Detroit too.
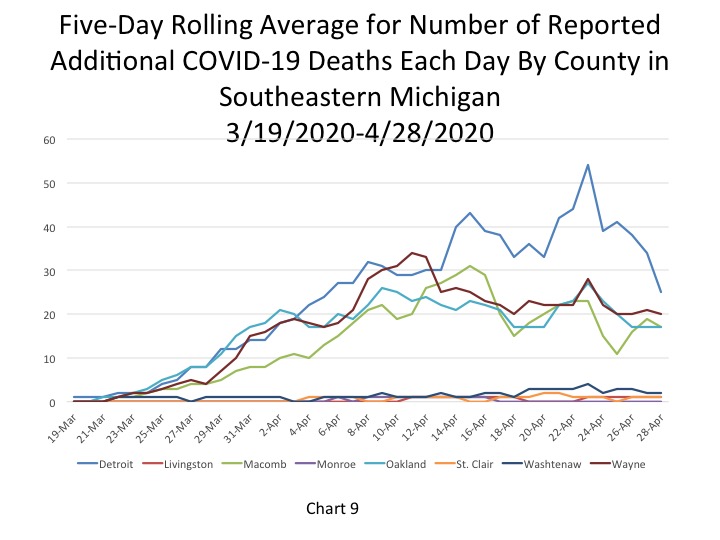
Chart 9 shows a steep decline in the number of daily deaths in Detroit. These numbers still remain higher than the counties. For Macomb, Oakland and Wayne counties there has been a leveling off in the number of additional deaths. All of these factors play into the overall decline in the State’s additional COVID death totals.
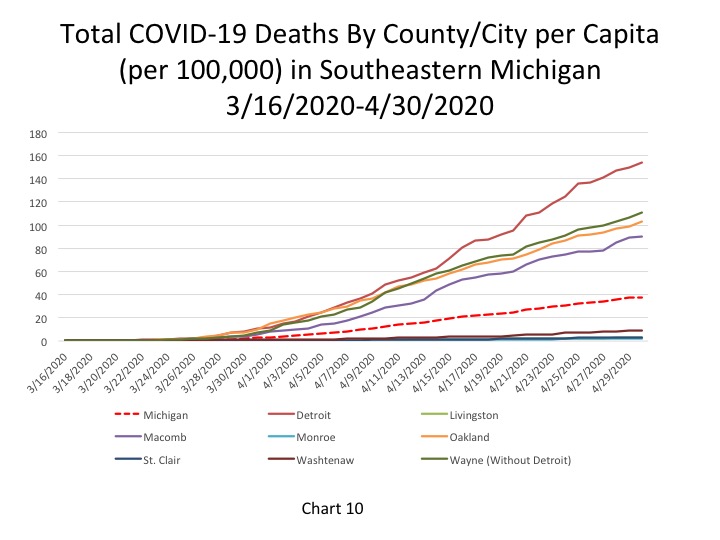
Chart 10 represents the total number of COVID deaths per 100,000 people. For Detroit on April 30 there were 154 COVID deaths per 100,000 people (representing 1,035 deaths). In Wayne County there were 111 COVID deaths per 100,000 people (747 total deaths), in Oakland County there were 103 deaths per 100,000 people (696 total deaths), and in Macomb County there were 90 COVID deaths per 1000,000 people on April 30 (603 total). The State of Michigan continued to have 38 COVID deaths per 100,000 people, a number which was lower than the four entities discussed above. Wayne and Oakland counties both had the highest number of additional deaths on April 30 at 28 each, Detroit reported 27, and Macomb County reported 6.
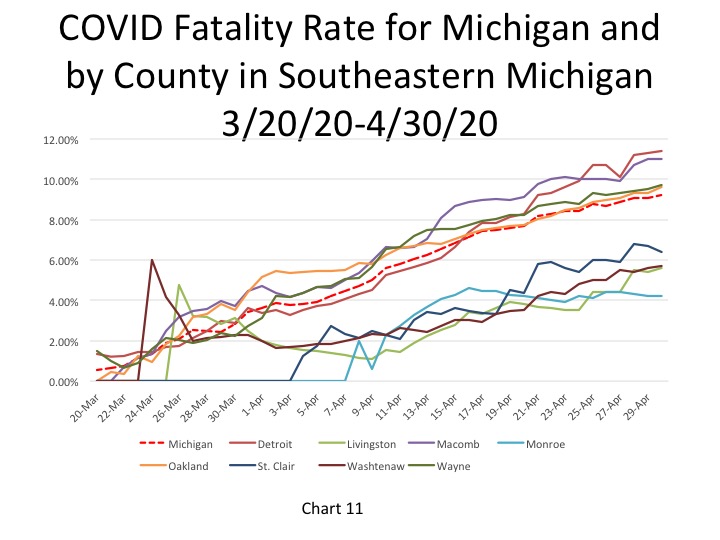
The fatality rate in the City of the Detroit increased to 11.4 percent on April 30 while Macomb County’s remained at 11 percent for the second day in a row. The fatality rate for the State slightly decreased to 9.2 percent. The fatality rates for Monroe and St. Clair counties are declining.
Overall, the reported number of new daily cases and deaths is slowing down, and even declining in some areas. This means the Stay at Home Order issued by the Governor is having an impact. In order to see a decline throughout the State though we must continue to be diligent in remaining home and only leaving out of necessity.