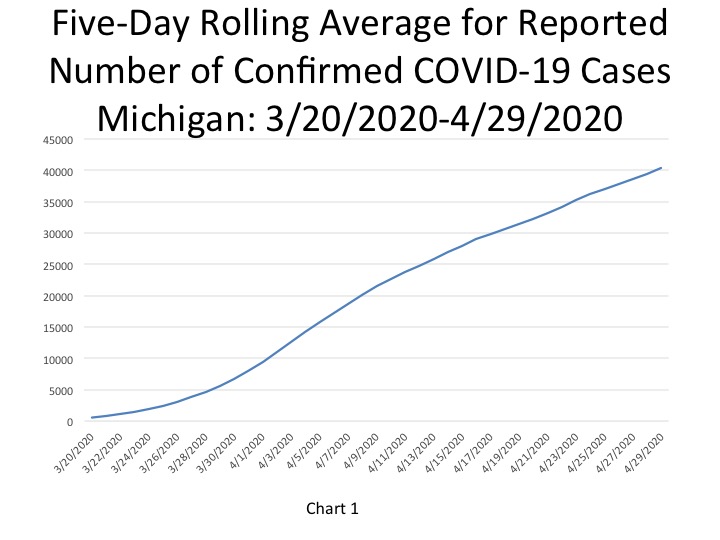
According to the State of Michigan, the total number of COVID cases in Michigan rose to a total of 42,356, an increase of 977 cases from the previous day. This total was equivalent to 424 cases per 100,000 people (Chart 4) on May 1. The five-day rolling average for the total number of COVID cases (Chart 1) reflects a smoother curve and adjusts for fluctuations in testing and/or the quality of reporting or failure to report. That curve is moving steadily upward. Note that this five day rolling average causes these daily case and the daily death charts to lag two days behind.
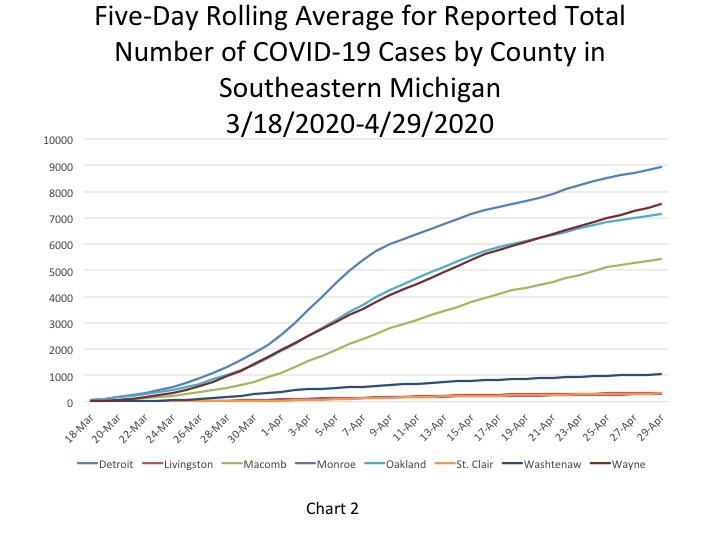
Chart 2 reflects the five-day rolling averages at the County level and for the City of Detroit. Detroit and Wayne County continue to pull above the other entities in the region with COVID case numbers and reported the highest number of cases at 8,933 and 7,514 on April 29, respectively. On April 29 the five-day rolling average for the number of COVID cases in Oakland County was 7,155 and for Macomb County the reported number was 5,450.
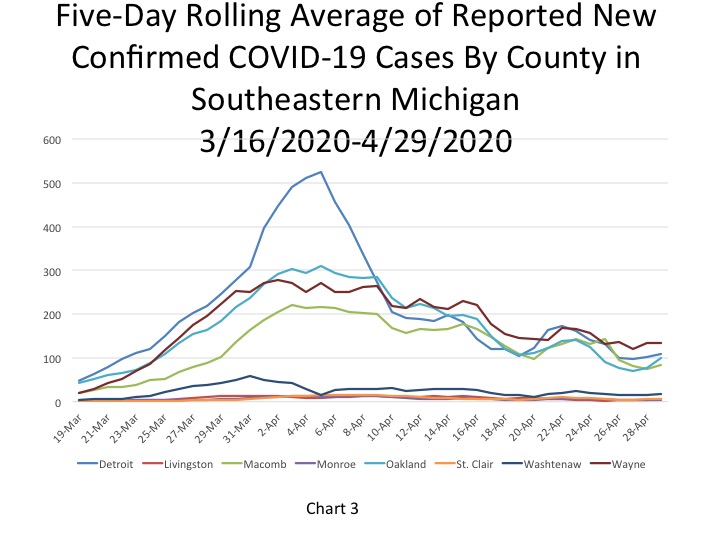
Chart 3 shows that the number of new confirmed cases in Wayne County leveled off, but remains higher than anywhere else in the region. Detroit, Oakland and Macomb counties all experienced increases in the number of reported new daily COVID cases.
The daily data highlighted in these posts is from Michigan.gov/coronavirus, where data is updated daily at 3 p.m. Historical data were supplied from covidtracking.com, which republishes COVID data from the State.
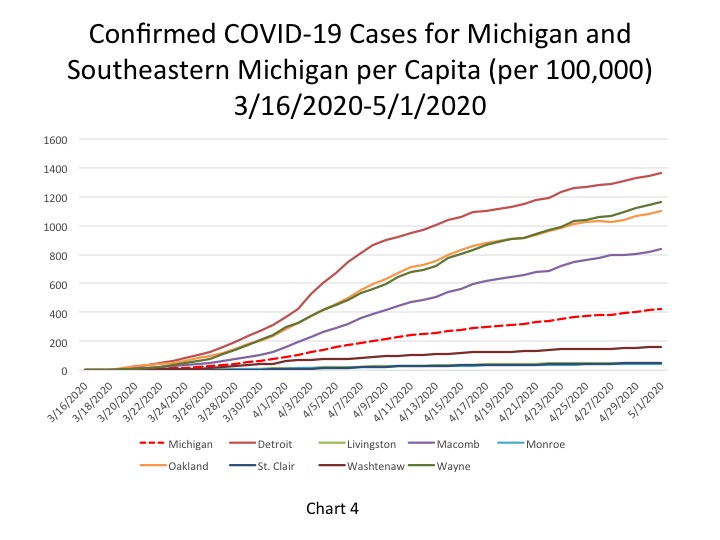
The City of Detroit had 1,362 COVID cases per 100,000 people on May 1, an increase from 1,346 the day before (Chart 4). This is based upon a reported increase of 105 new cases, bringing the total number of COVID cases in Detroit to 9,162. Wayne County reported 1,161 cases per 100,000 people, and Oakland County had 1,104 cases per 100,000 people. These May 1 per capita rates were based upon 7,808 total cases for Wayne and 7,423 for Oakland. Macomb County reported 836 cases per 100,000 people, which is based upon 5,623 cases.
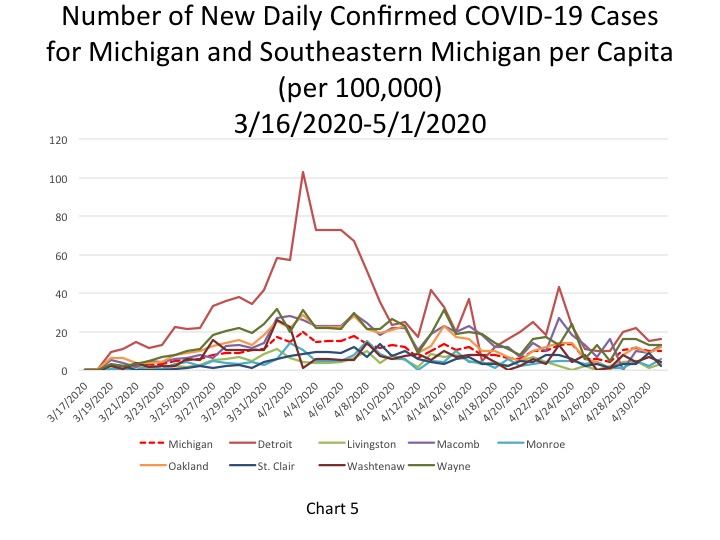
Chart 5 shows that Detroit had the highest per capita rate of new daily COVID cases, but Macomb, Oakland and Wayne counties were not far behind. Additionally, Macomb, Oakland and Wayne counties all had rates that were the same, or close. Detroit had 16 new COVID cases per 100,000 people, which was equivalent to 105 new cases, fewer than Wayne, Oakland or Macomb. Wayne and Macomb counties had 13 new COVID cases per 100,000 people on May 1 and Oakland County had 12 new COVID cases per 100,000 people. This translates to 136 new cases for Wayne County on May 1, 110 for Macomb and 156 for Oakland. Macomb and Monroe counties rates increased at the highest rates, by 4, and the rates in St. Clair and Washtenaw counties decreased.
The State’s per capita rate was 9.7 new cases per 100,000 people, equivalent to 977 new cases.
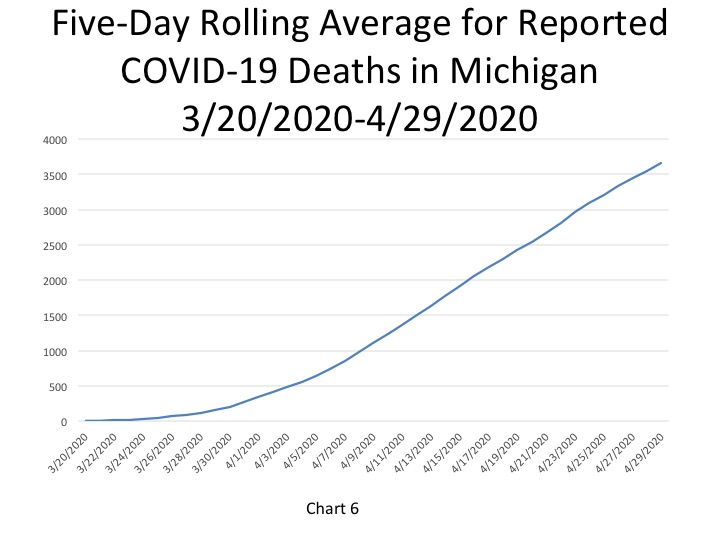
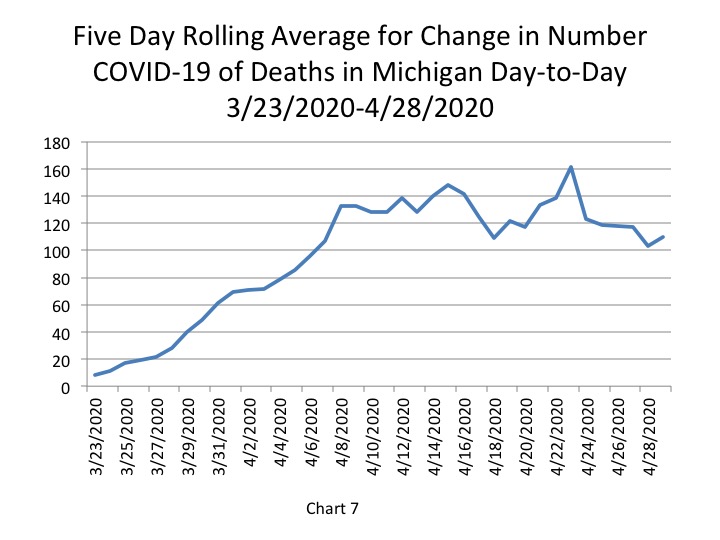
In Chart 6 the five-day rolling average for the number of deaths shows a continuing steady increase (a lagged number of 3,660 deaths, an increase of 110 deaths). The actual reported COVID-19 deaths reached 3,866 on May 1, an increase of 77 deaths from the day prior. Chart 7, a five-day rolling average chart, shows how the new data reflects a recent uptick in the number of additional deaths statewide; this is likely, at least in part, related to the additional deaths accounted for earlier in the week as a result of death certificate and COVID database comparisons.
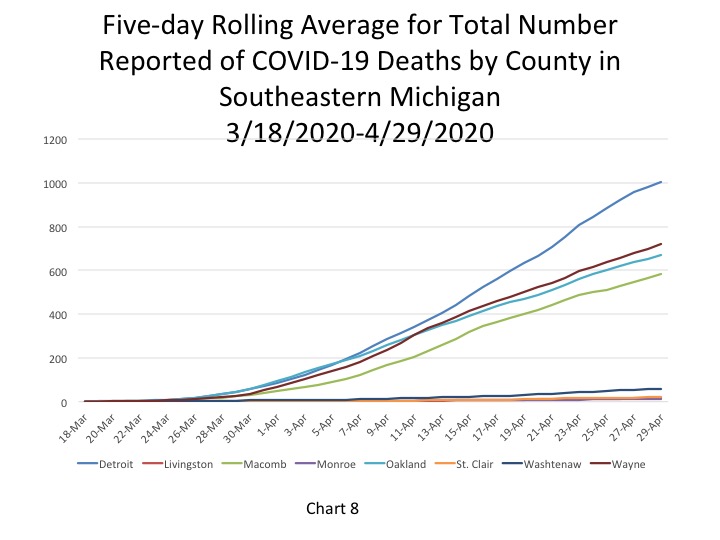
Chart 8, a five-day rolling average for the number of COVID deaths by each county, shows how the number of deaths in Detroit continue to rise at a more rapid rate than any of the other government entities in the region. Detroit also continues to have the highest number of COVID deaths. Note that this may soon begin to change, because as indicated below, there is a substantial and continuing drop in new deaths in Detroit. Second to Detroit, Wayne County has among the highest number of total reported COVID deaths, and those numbers are increasing at a rate faster than Macomb and Oakland counties. The rate at which total deaths in Oakland County are increasing has remained consistent for the last four days; that rate was consistently below the rate of increase for Detroit and Wayne County, and even Macomb County at times.
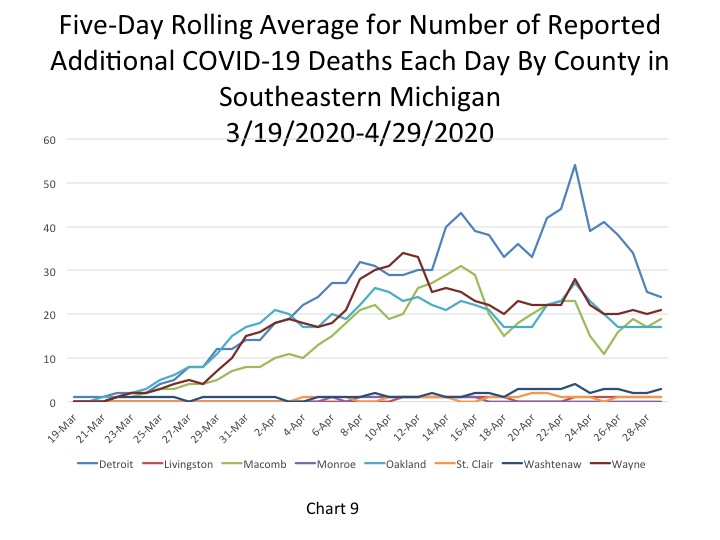
Chart 9 shows a steep decline in the number of daily deaths in Detroit, a decline that has been occurring for over a week now. Though these numbers still remain higher than the counties there was a recent uptick in the number of daily deaths in Wayne and Macomb counties. The number of additional deaths for Oakland County remains flat.
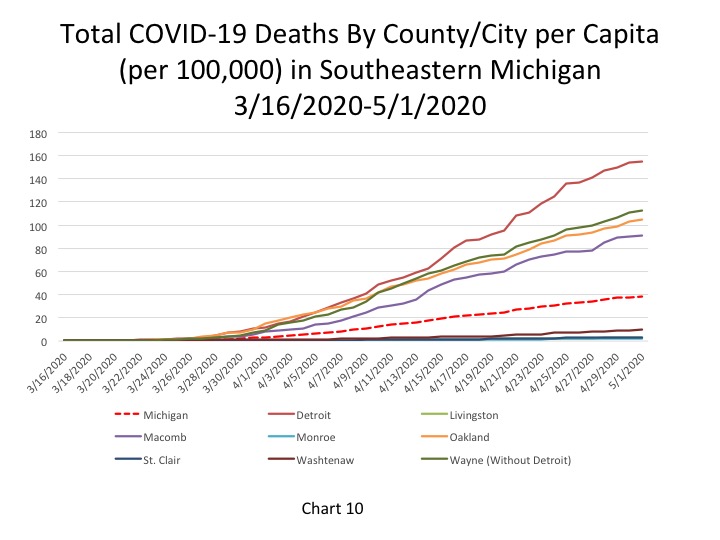
Chart 10 represents the total number of COVID deaths per 100,000 people. For Detroit on May 1 there were 155 COVID deaths per 100,000 people (representing 1,040 deaths). In Wayne County there were 113 COVID deaths per 100,000 people (762 total deaths), in Oakland County there were 105 deaths per 100,000 people (705 total deaths), and in Macomb County there were 91 COVID deaths per 1000,000 people on May 1 (614 total). The State of Michigan had 39 COVID deaths per 100,000 people, a rate that continues to remain lower than the four entities discussed above. On May 1 Wayne County had the highest number of additional daily deaths at 15, Detroit reported 5.
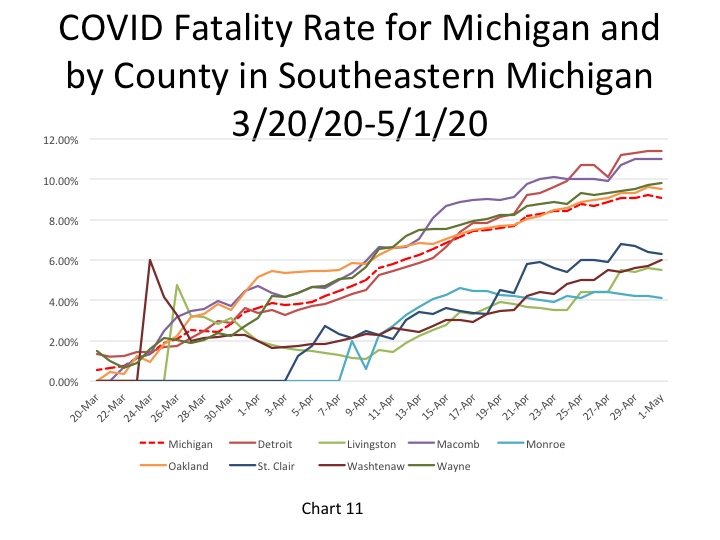
The fatality rates in Detroit and Macomb County leveled off on May 1, hovering around 11 percent (Detroit’s was 11.4%, Macomb’s was 11%). For Oakland County and the State of Michigan there was a small decrease in the fatality rates. The reported fatality rate for the State on May 1 was 9.1 percent; Oakland’s rate was 9.5 percent.
The number of new COVID deaths in Detroit continues to decrease while the surrounding counties are overall flattening out with their death numbers. Even though there have been recent upticks in reported cases numbers and deaths in areas of Southeastern Michigan, those increases are much smaller than what we were seeing just weeks ago. Just such information continues to provide hope that the spread of the virus continues to decrease, but that hope derives from the strict stay at home policies that limit infections.