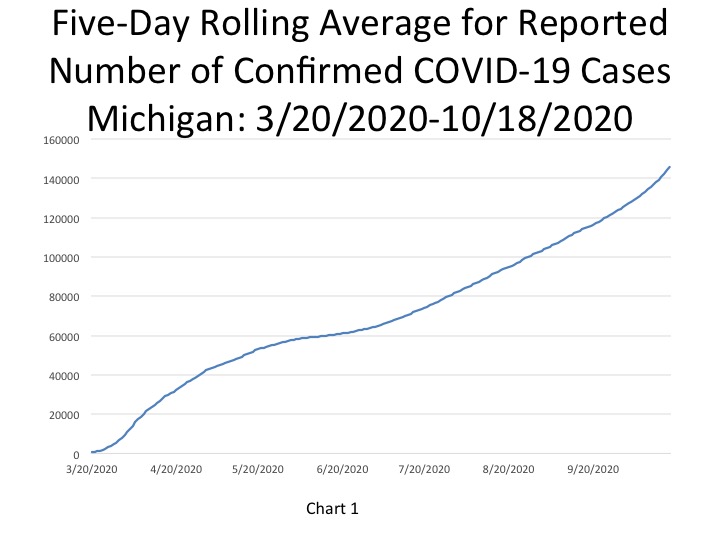
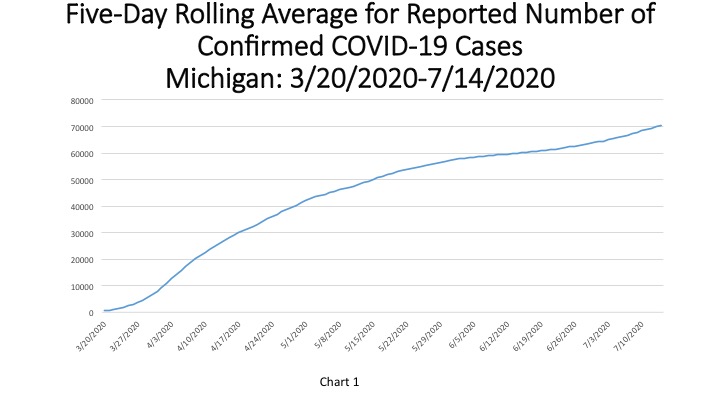
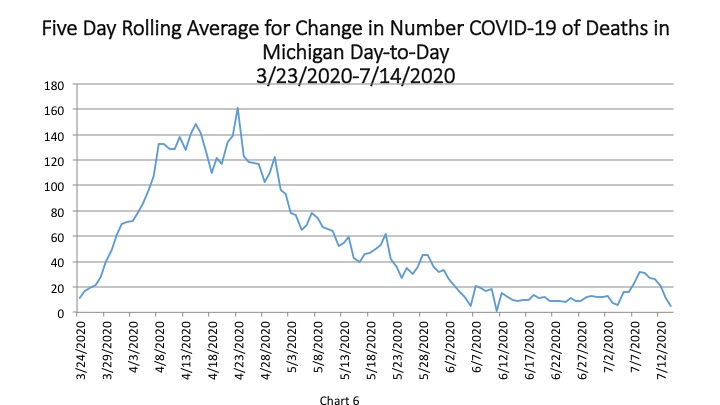
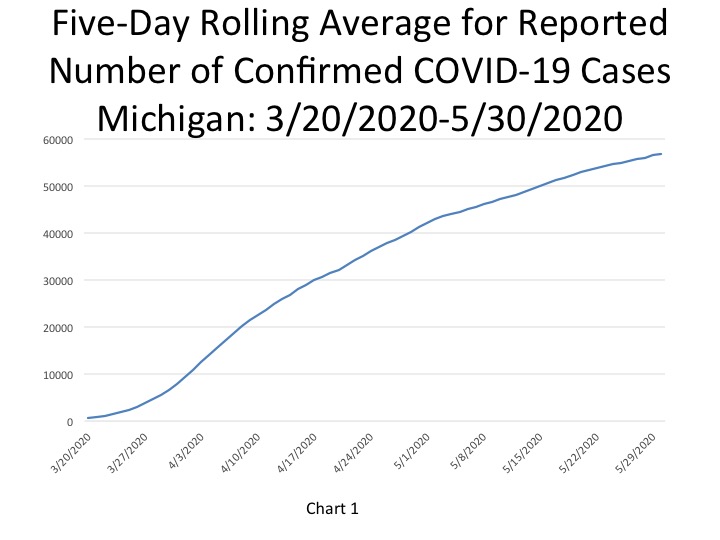
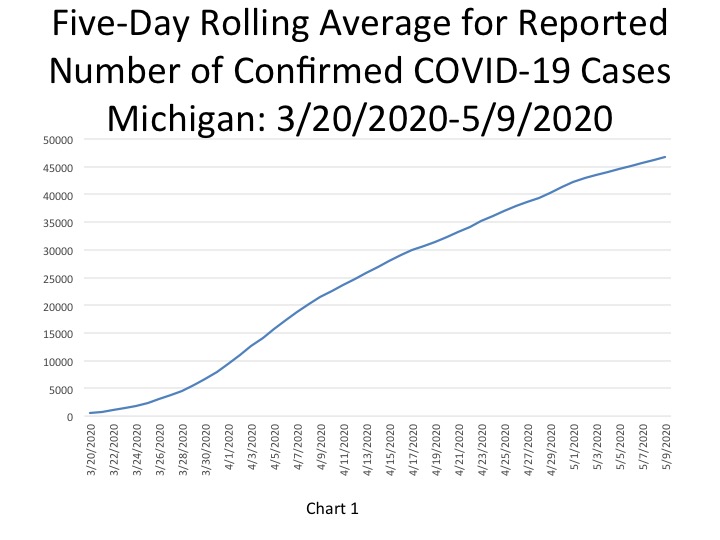
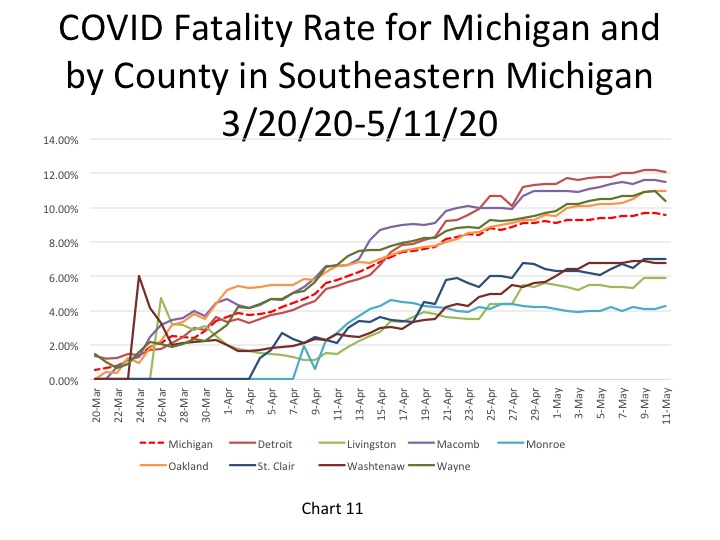
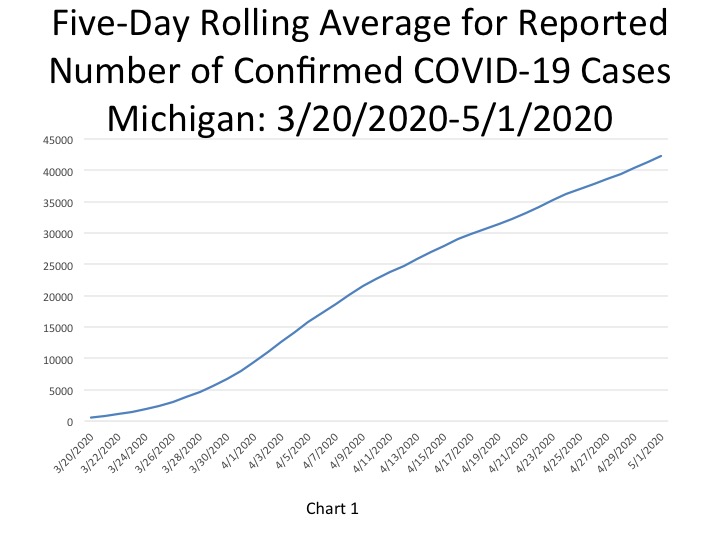
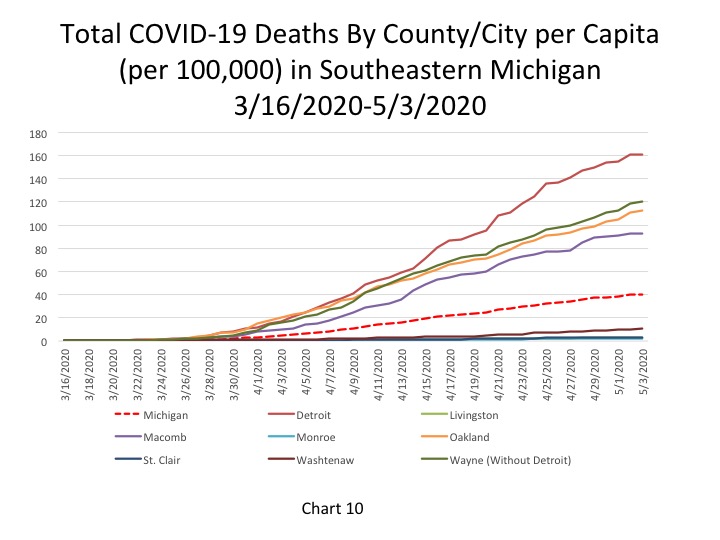
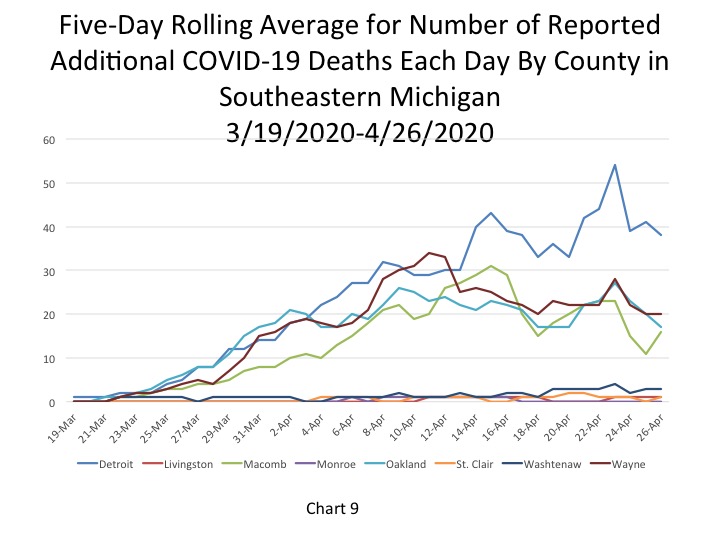
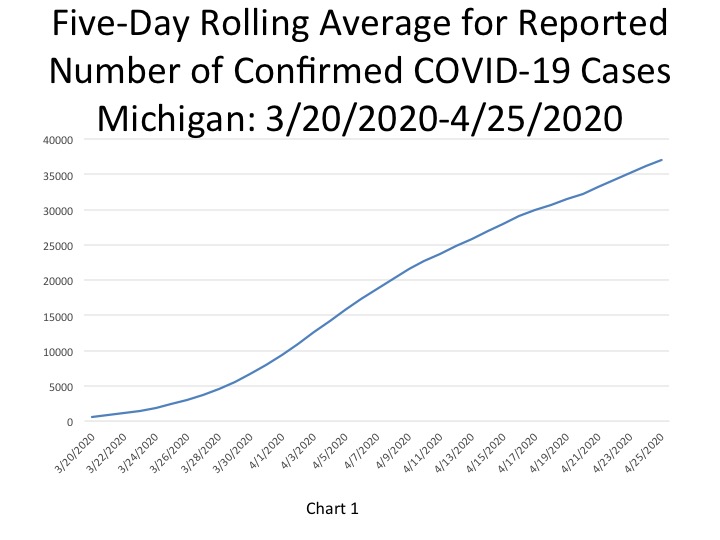
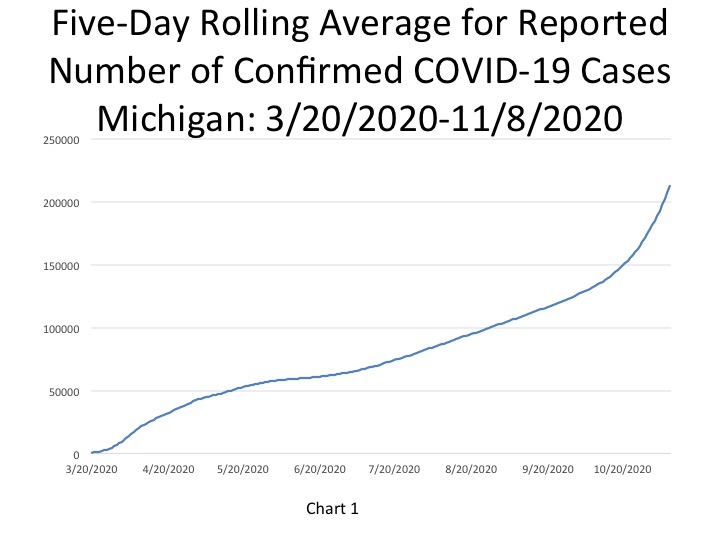
Michigan reported 6,008 new COVID cases on Nov. 11, 2020, bringing the total number of confirmed cases to 229,285. In Chart 1 we show that the State total for the number of confirmed COVID cases on Nov. 8 was 212,437–a five-day rolling average. The five-day rolling average for the total number of COVID cases (Chart 1) reflects a smoother curve and adjusts for fluctuations in testing and/or the quality of reporting or failure to report. This chart also shows that the curve has begun to increase at a much higher rate than previously.
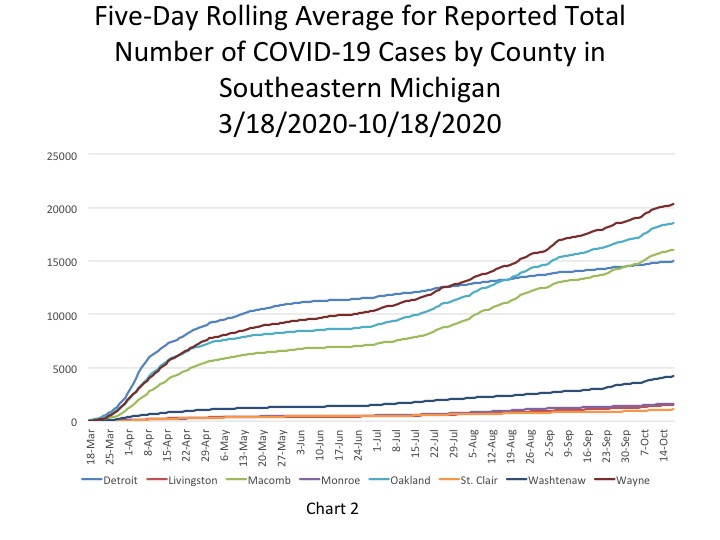
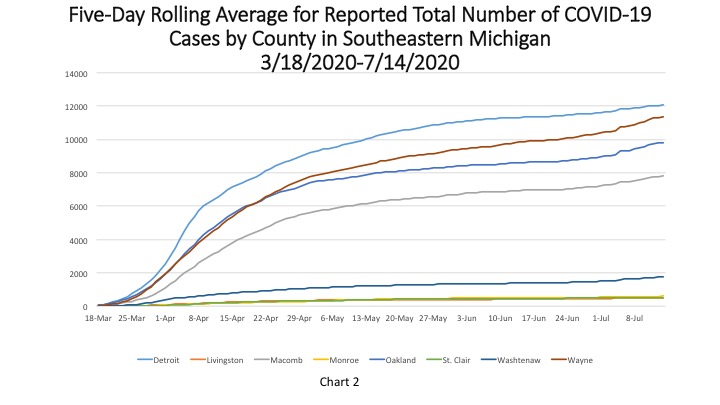
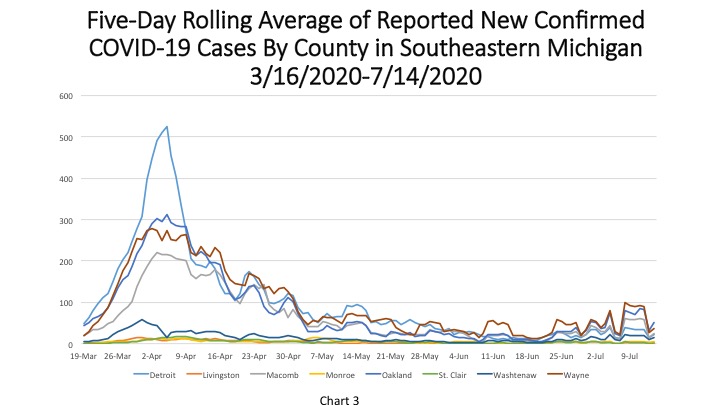
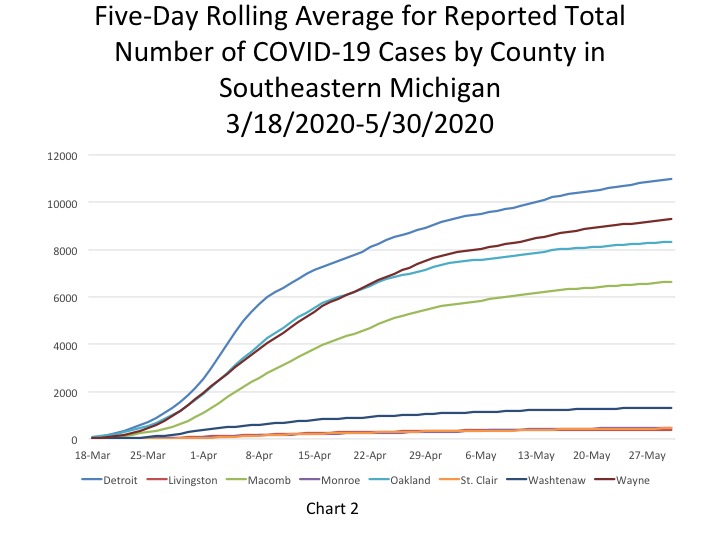
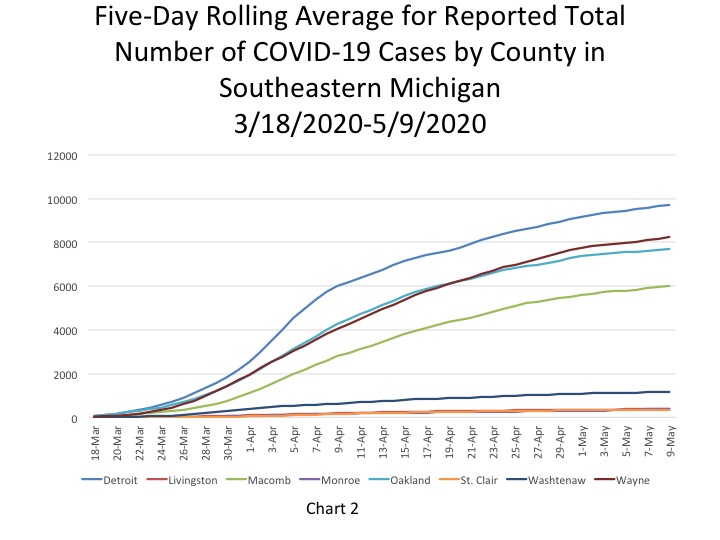
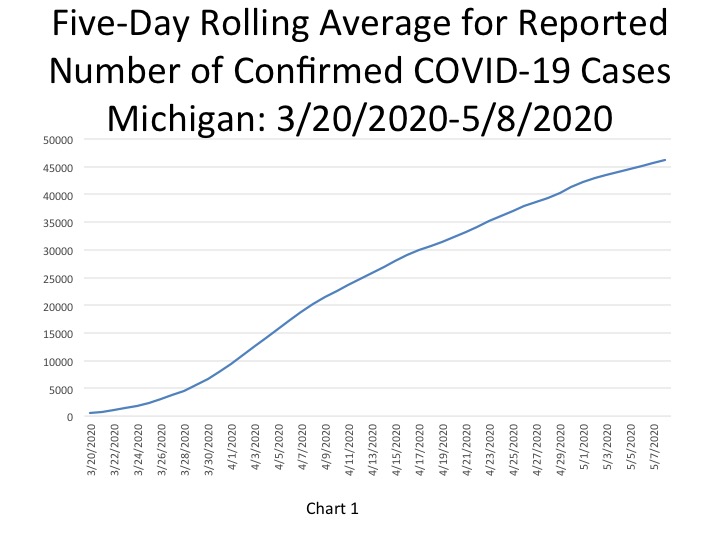
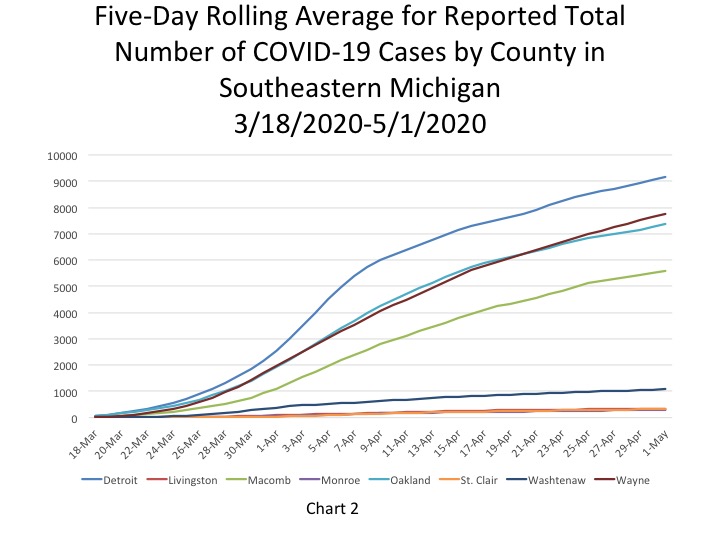
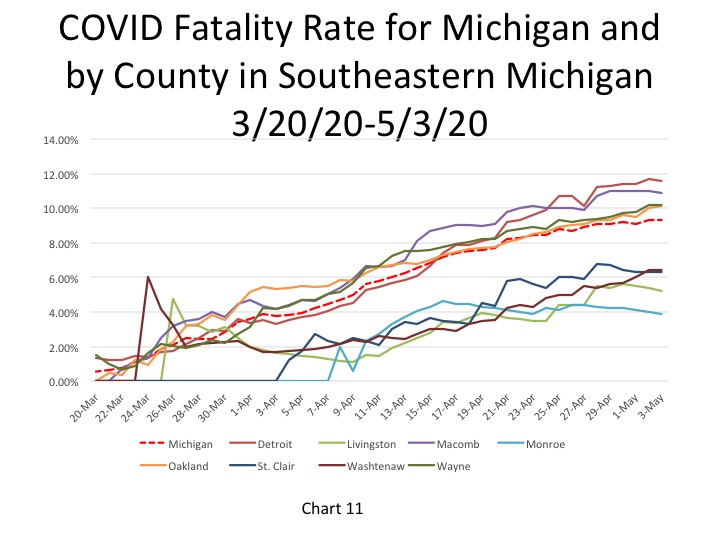
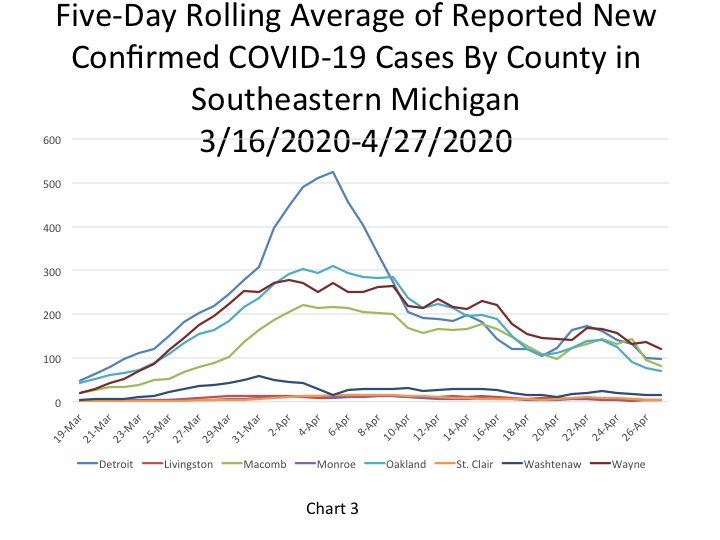
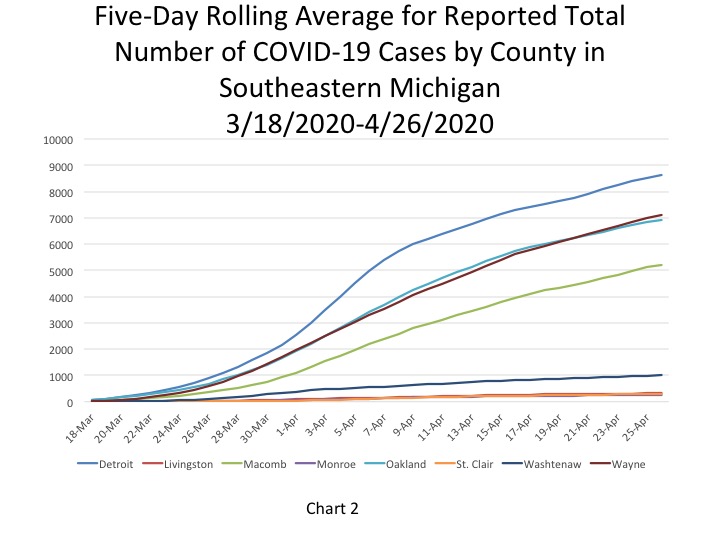
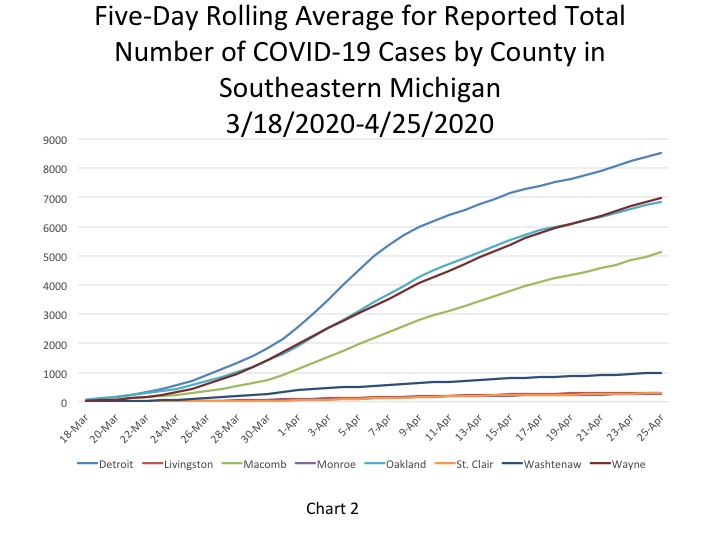
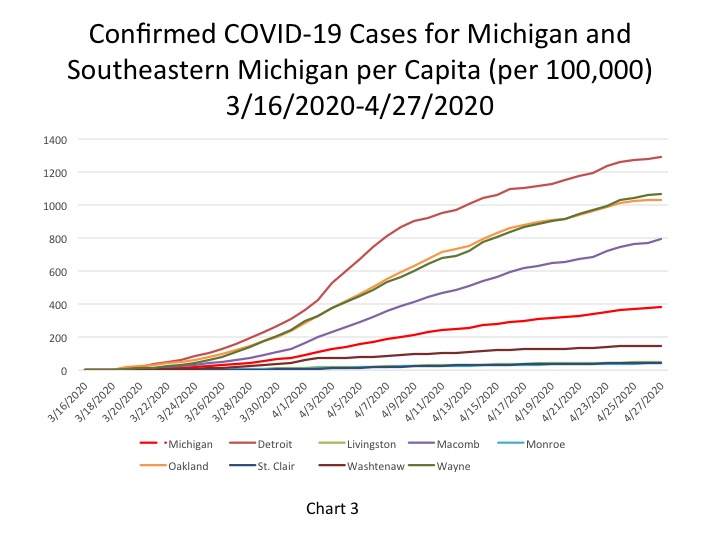
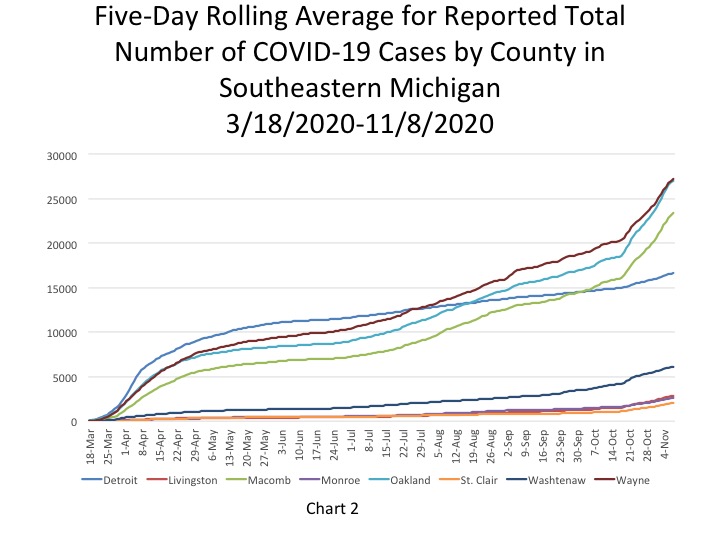
Chart 2 shows that, based on the five-day rolling averages, the growth of new COVID cases in Southeastern Michigan is reflective of the statewide trend that daily case numbers are increasing at a higher rate than previously. However, when COVID-19 first hit Michigan in March of 2020 Detroit was reporting the highest numbers for a municipality and/or a county. Now, as Nov. 8, Wayne County reported the highest number of confirmed COVID cases in Southeastern Michigan at 27,198 followed by Oakland County with 27,042 confirmed cases. Macomb County reported 23,361 COVID cases on Nov. 8, and Detroit reported 16,614.
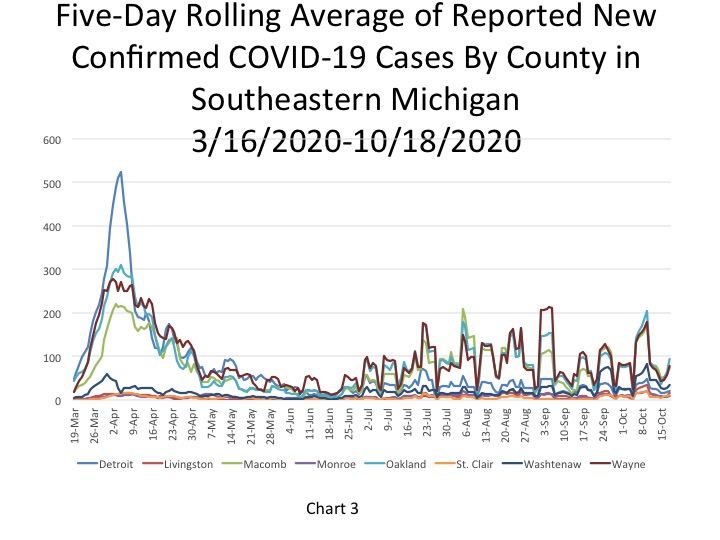
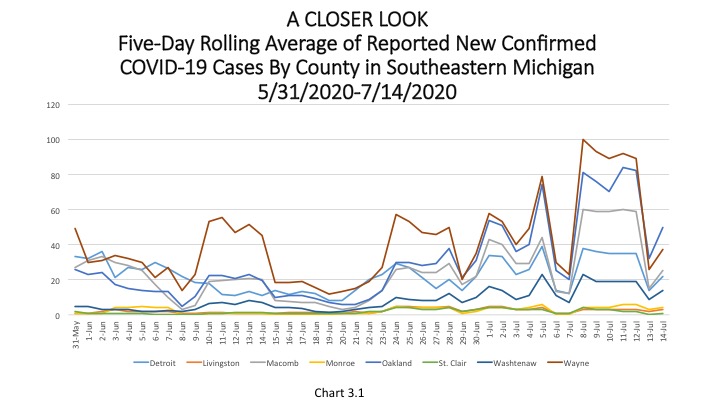
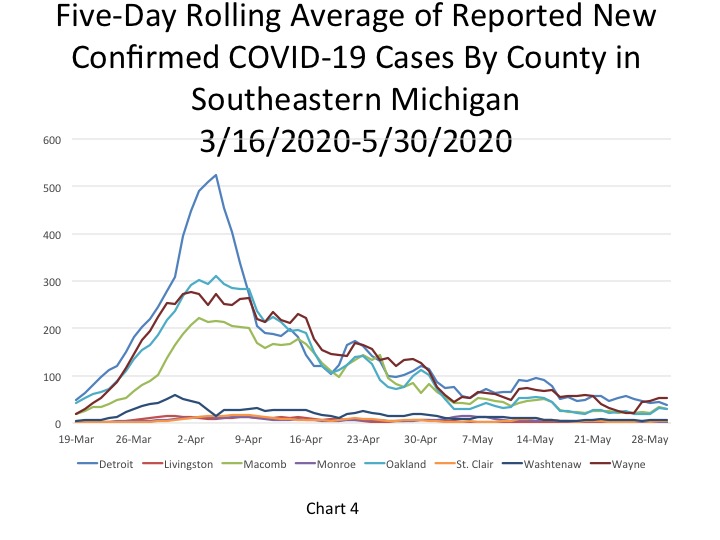
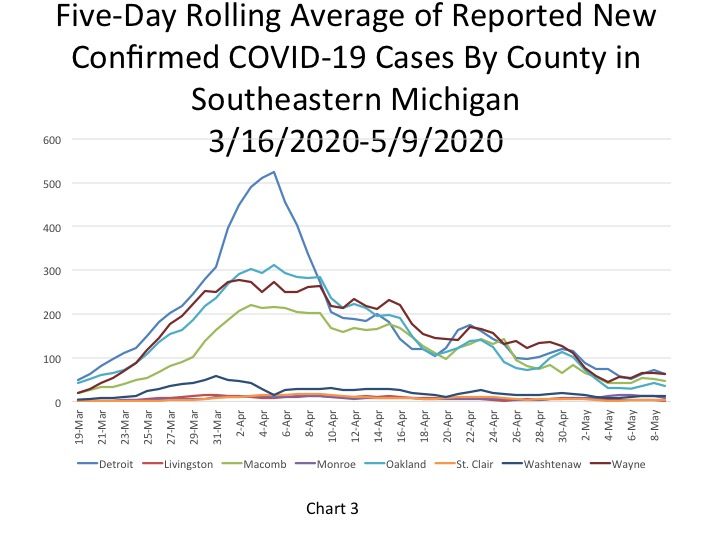
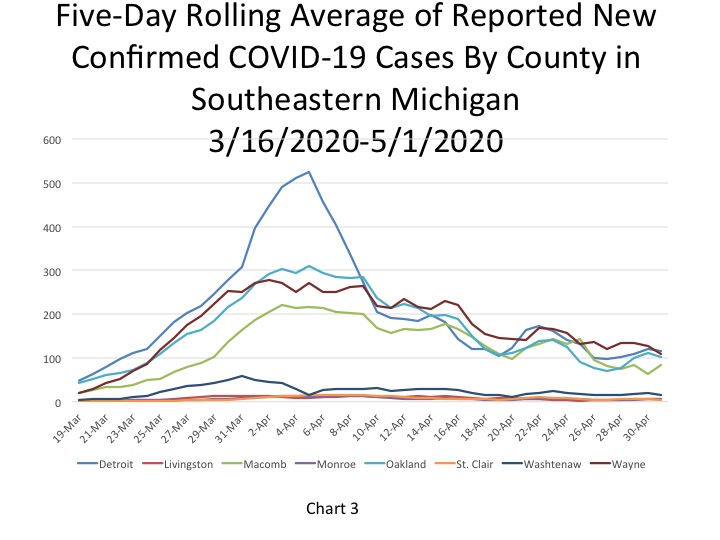
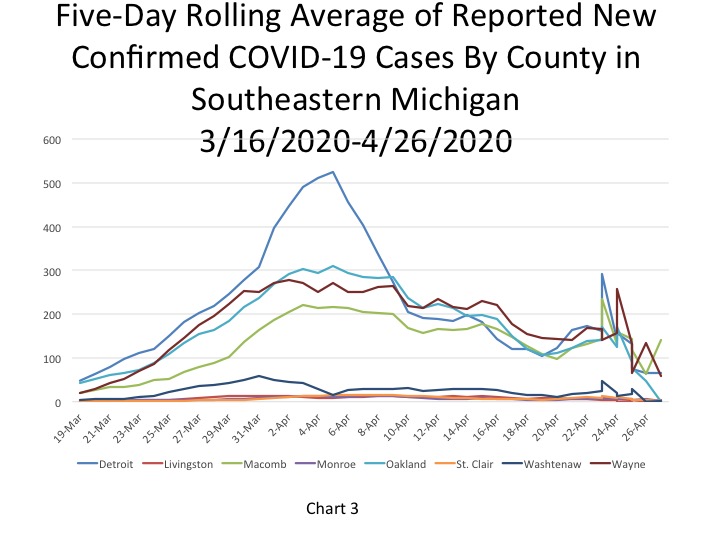
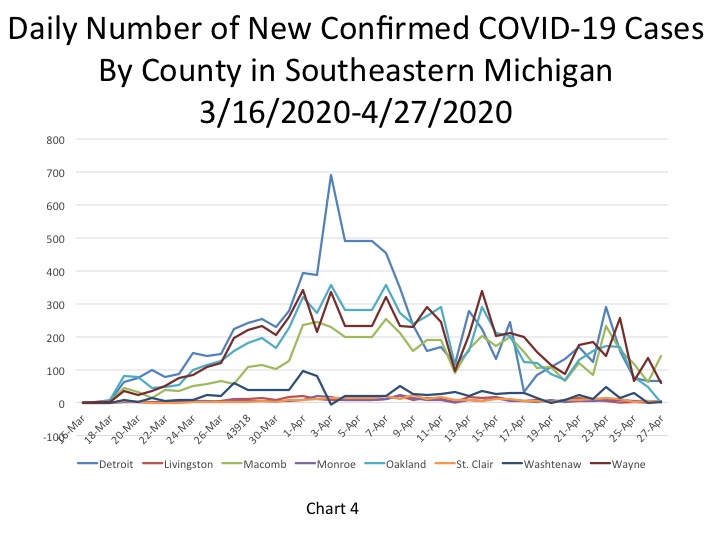
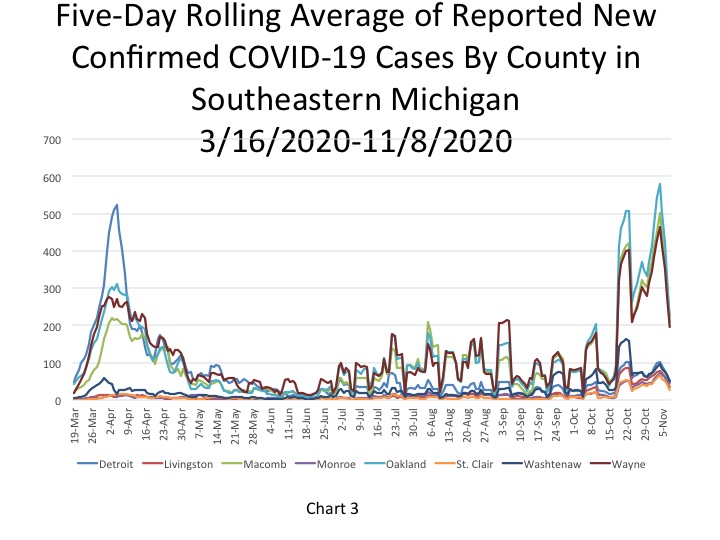
As shown in Chart 3, Macomb County reported the highest number of new daily confirmed cases on Nov. 8 at 223, followed by Oakland County with 209 new confirmed cases and Wayne County with 195. Detroit reported 52 new daily confirmed COVID cases on Nov. 8. These numbers are also based on a five-day rolling average.
The daily data highlighted in these posts is from Michigan.gov/coronavirus, where data is updated daily at 3 p.m. Historical data were supplied from covidtracking.com, which republishes COVID data from the State. Additionally, the case totals do not reflect the number of people who have recovered, just those who have been infected. In early June the State changed how it reports its data on the website, making data more accurate in the long-term but more complicated to track as well. The State regularly updates older data and as we continue to publish regular updates on COVID the State’s changes to past data many not always be reflected in our posts. The data published in new posts is accurate for the day we received it on though.
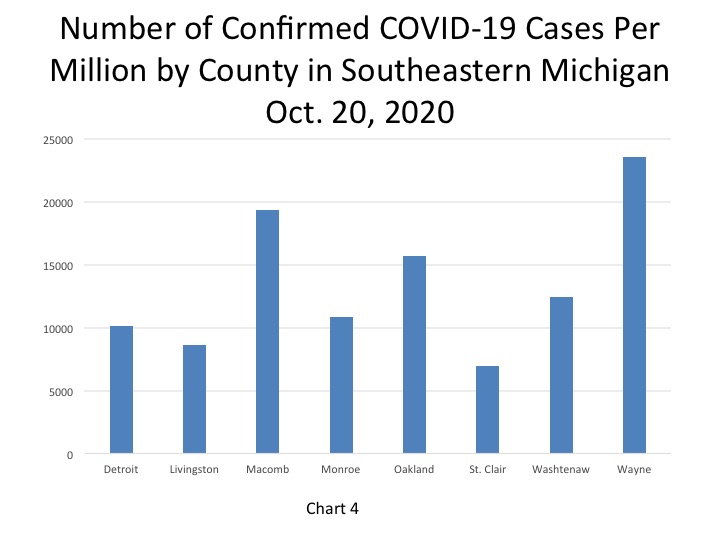
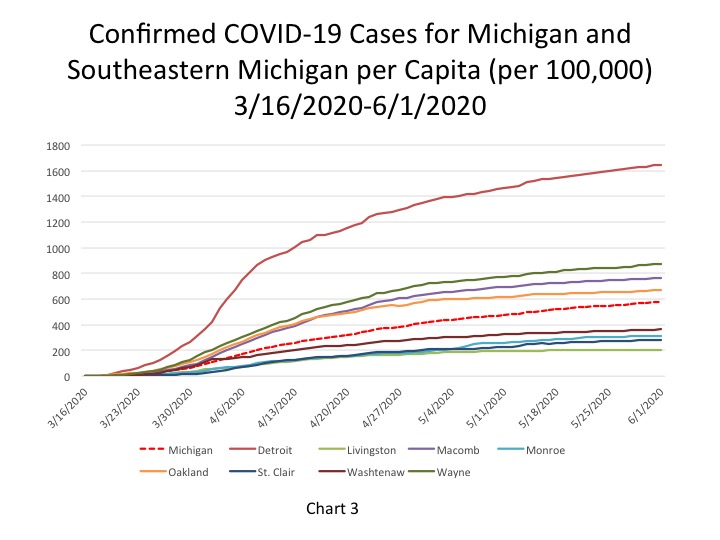
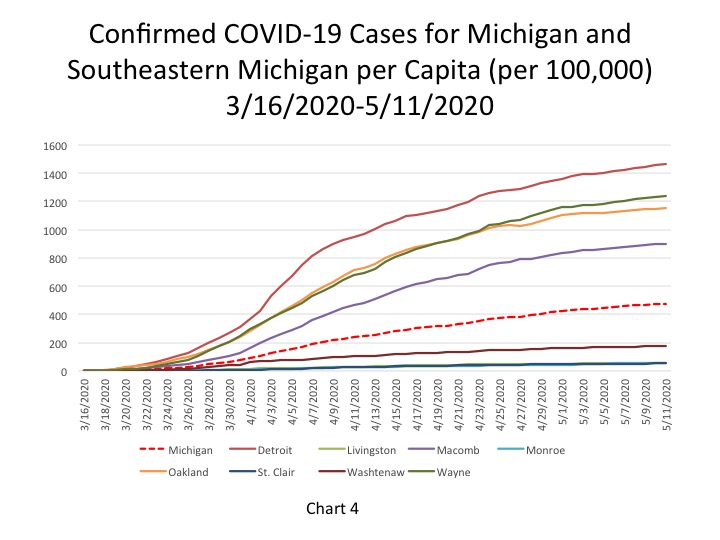
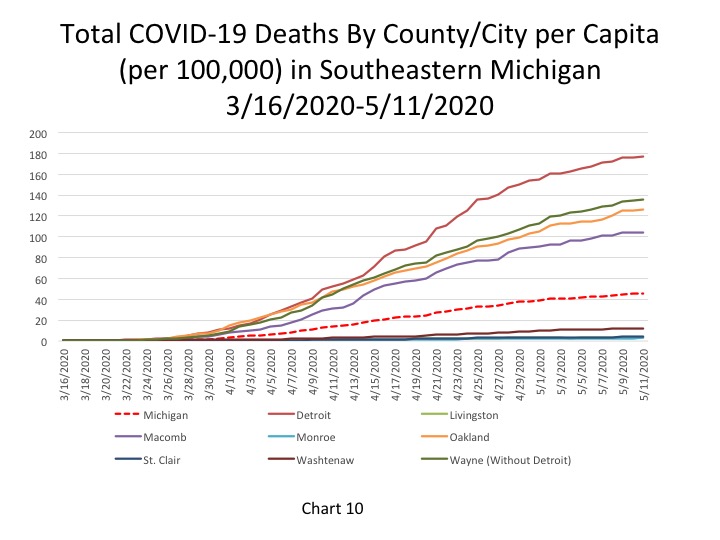
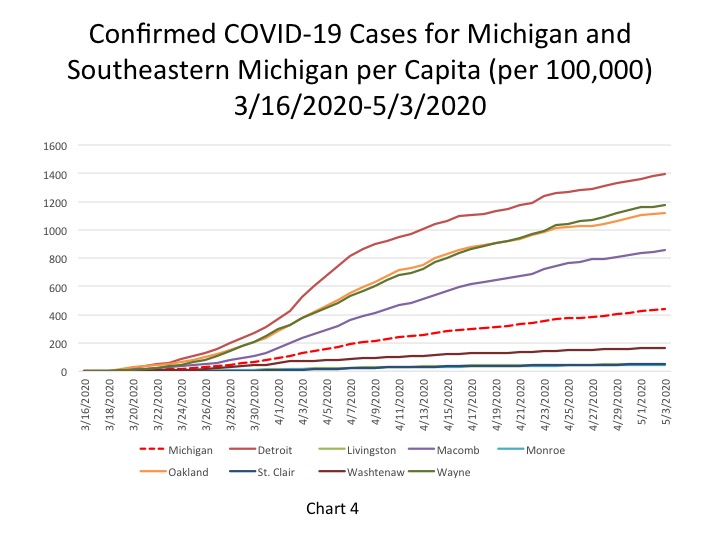
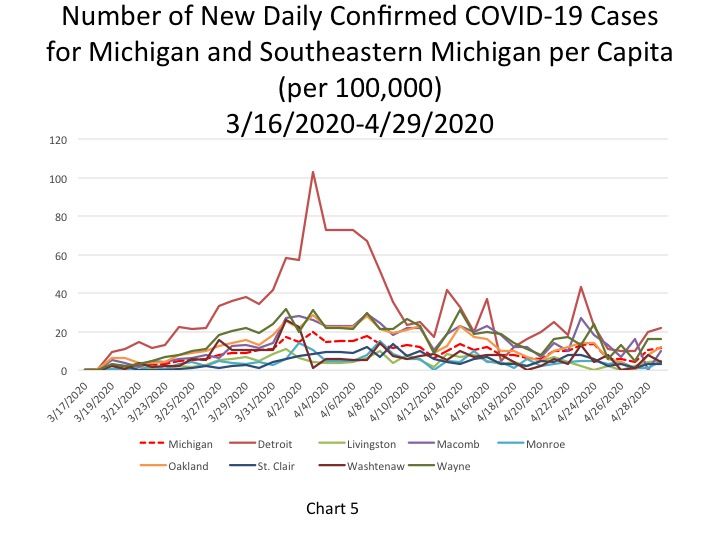
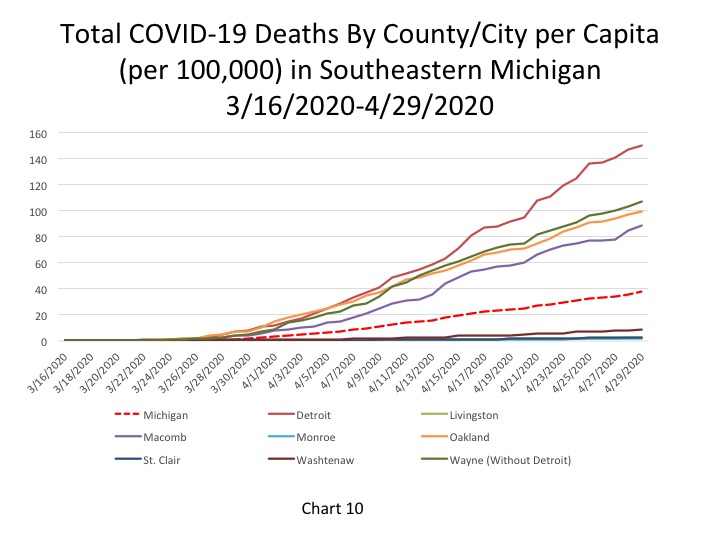
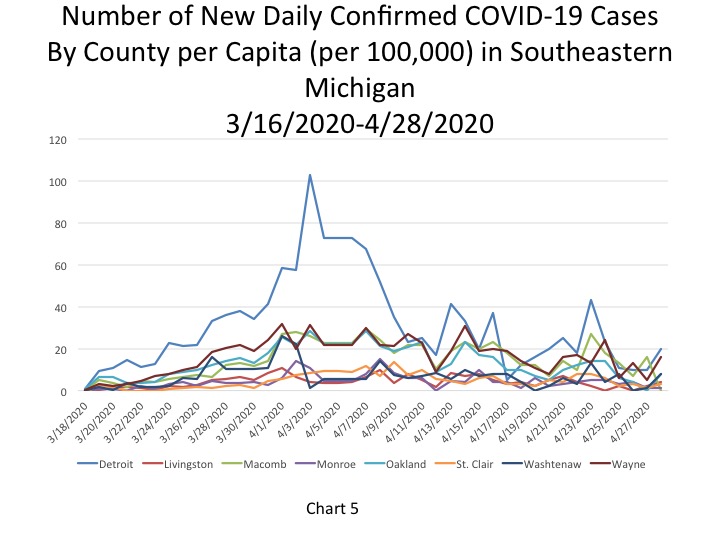
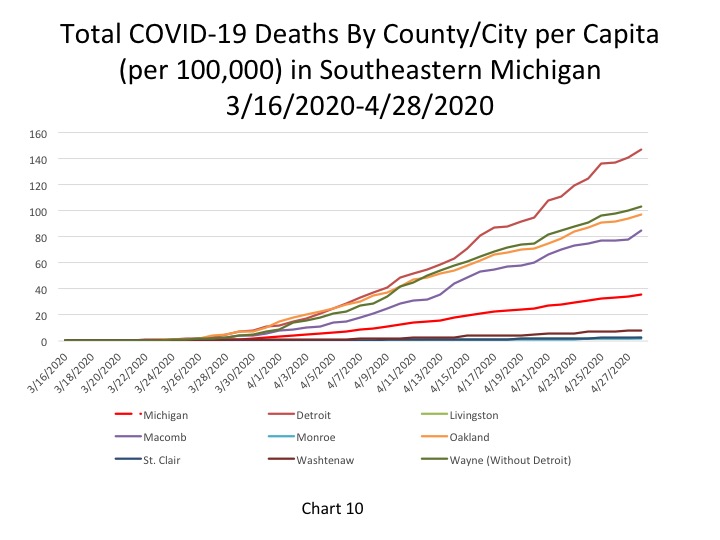
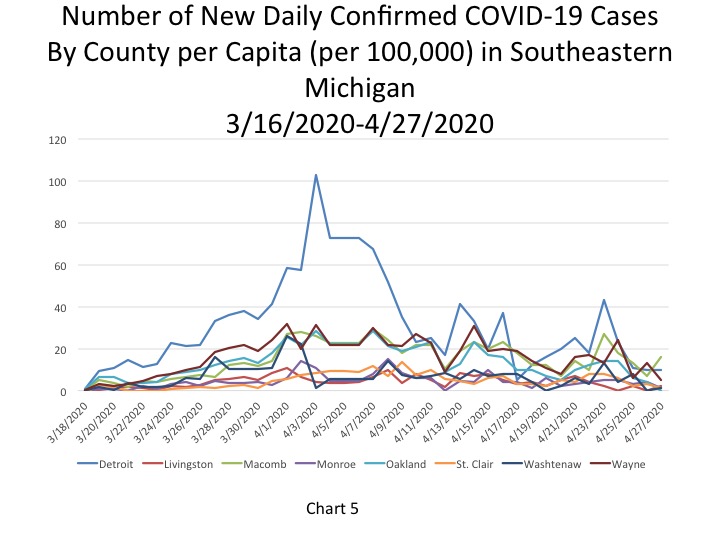
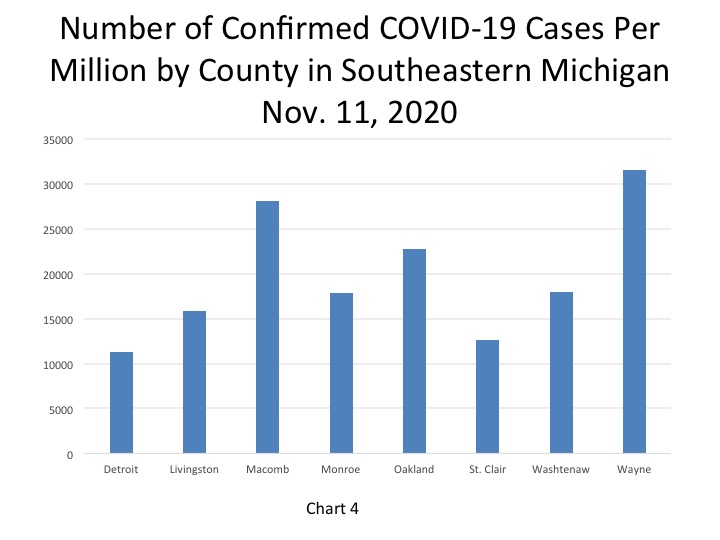
The chart below (Chart 4) highlights how Wayne County not only has the highest number of confirmed total COVID cases in the region (this data does not include Detroit’s numbers) it also has the highest number of confirmed cases per capita. According to the data released on Nov. 11, Wayne County had 31,496 COVID cases per million people. Macomb County had the second highest number of confirmed cases per million people at 28,089. Detroit had 11,242 confirmed COVID cases per million people; no other counties in the region had fewer number of cases per capita.
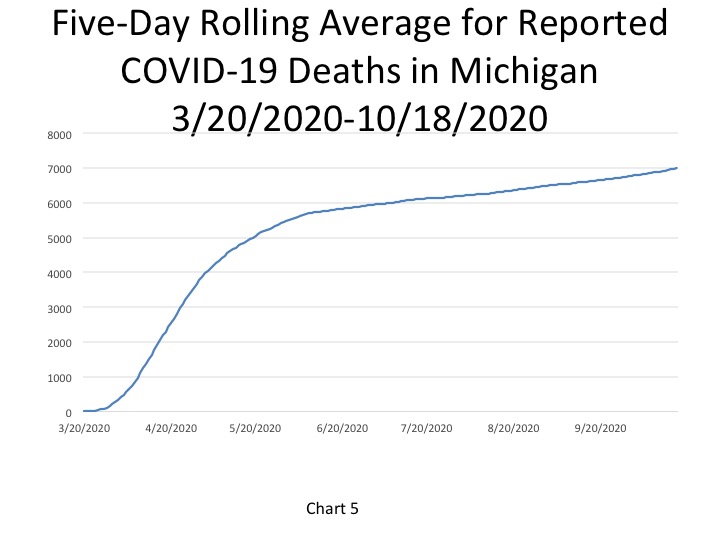
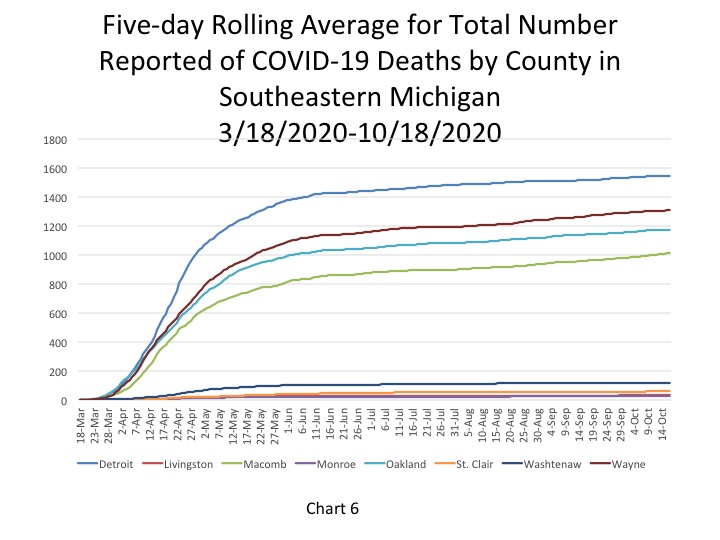
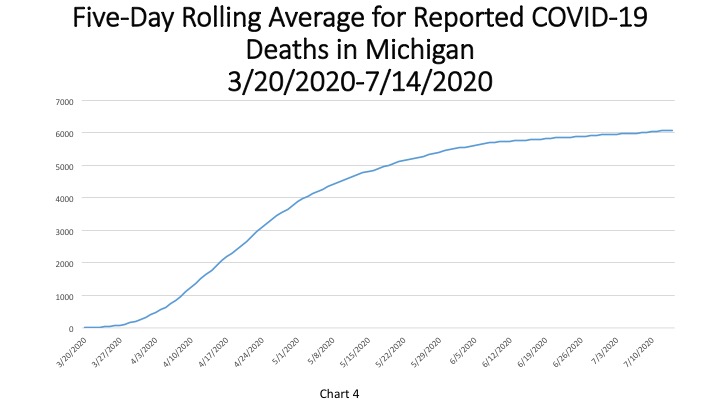
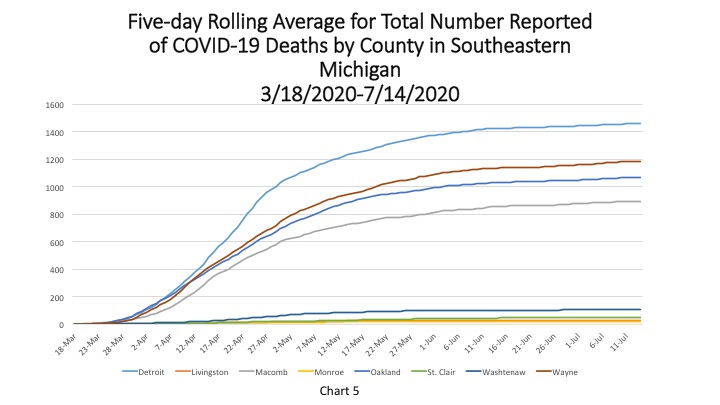
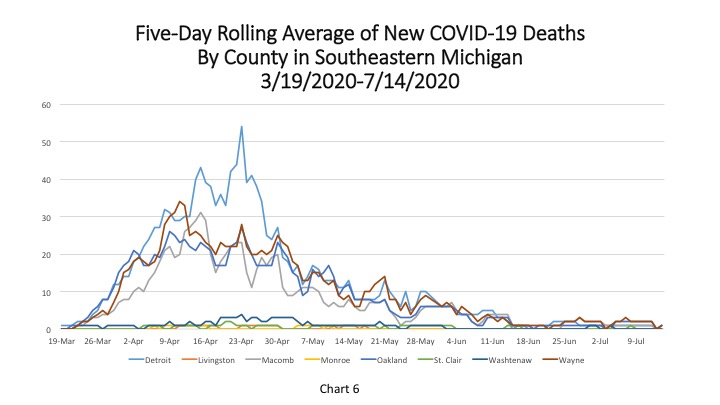
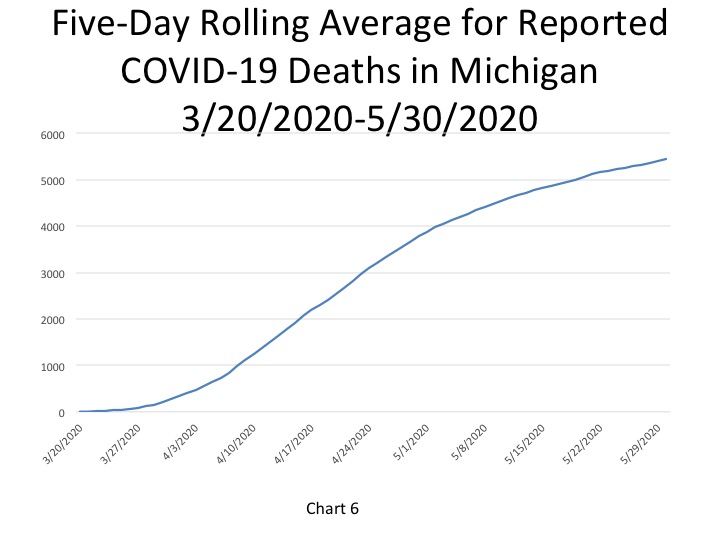
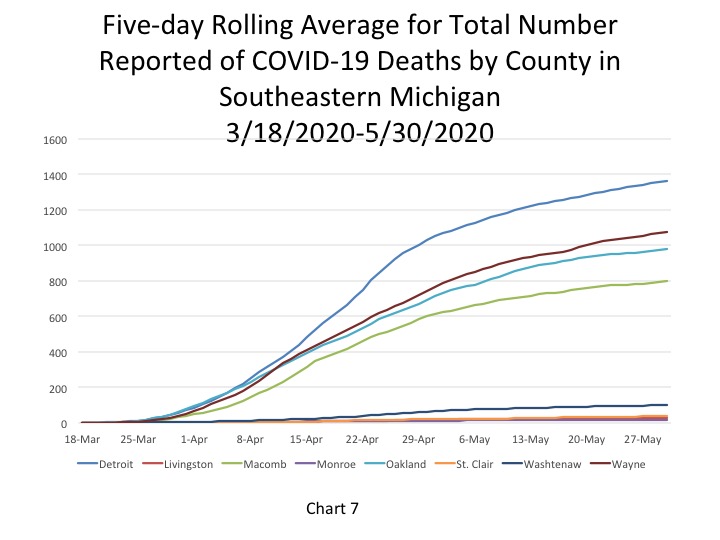
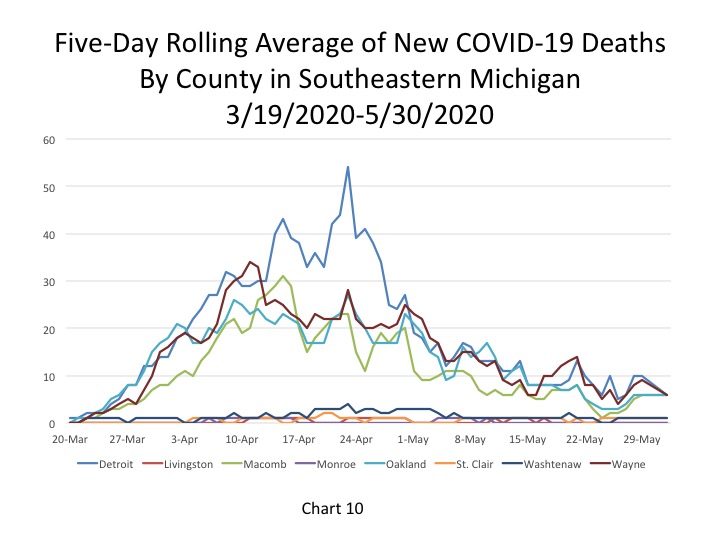
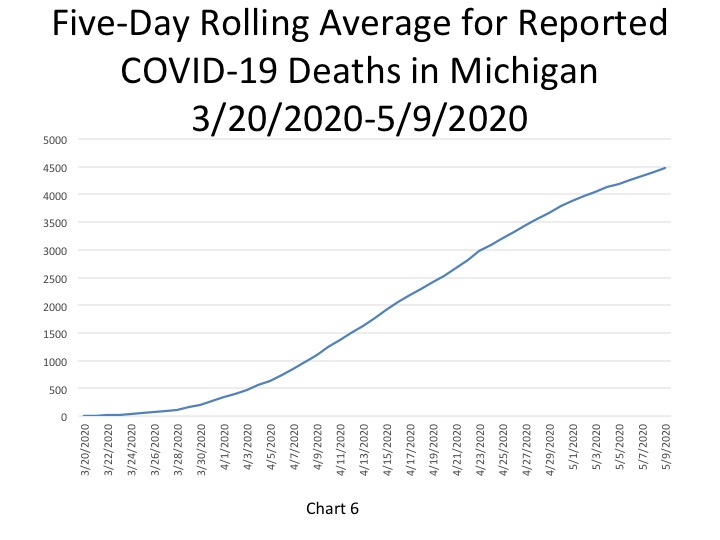
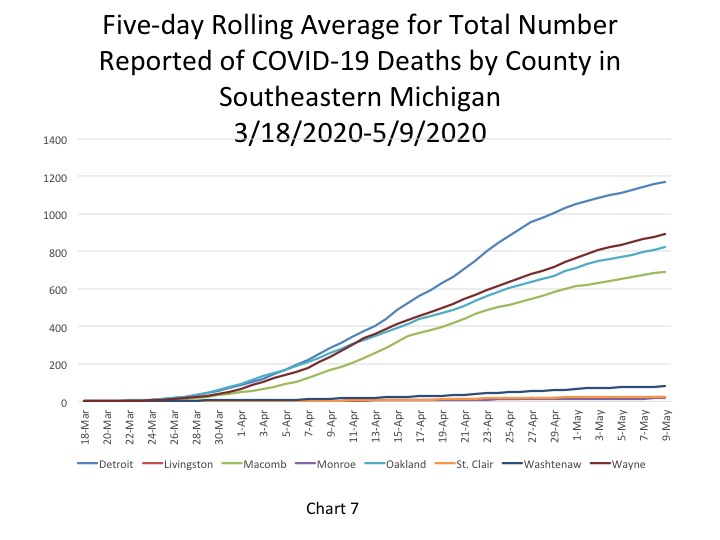
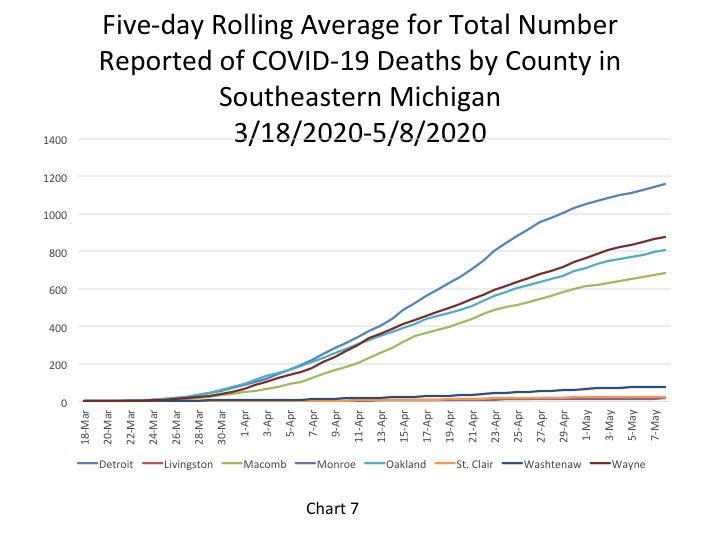
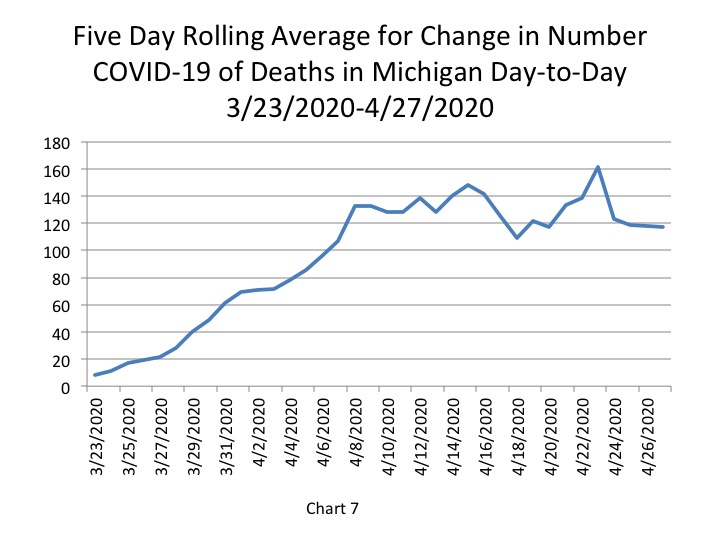
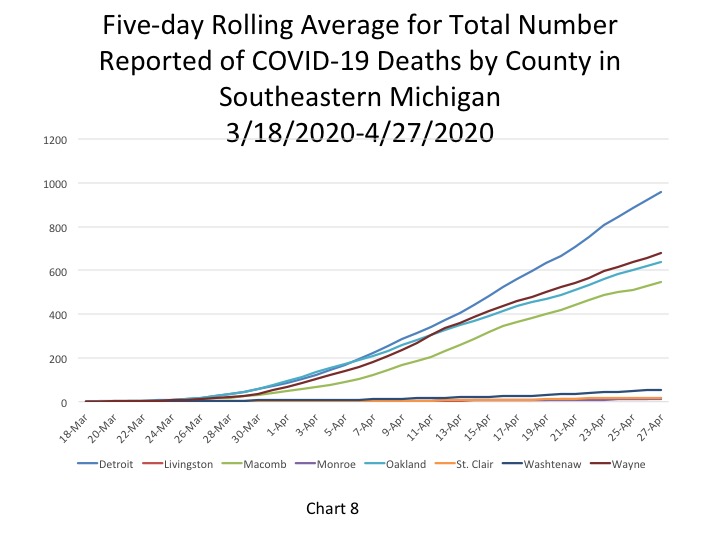
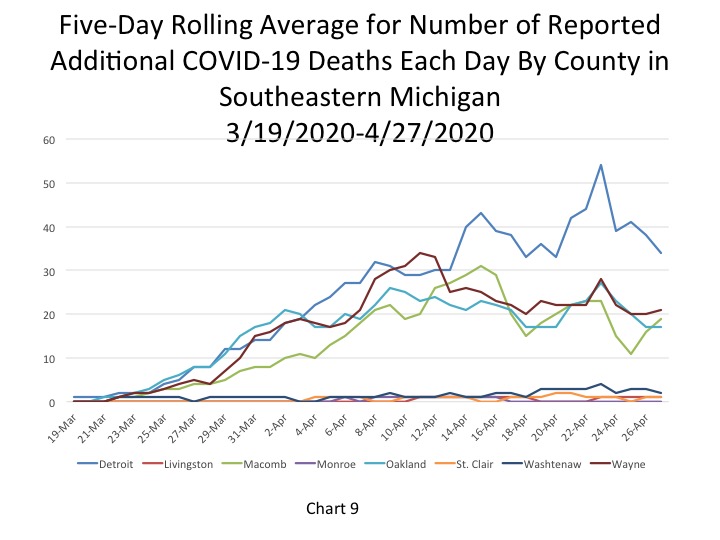
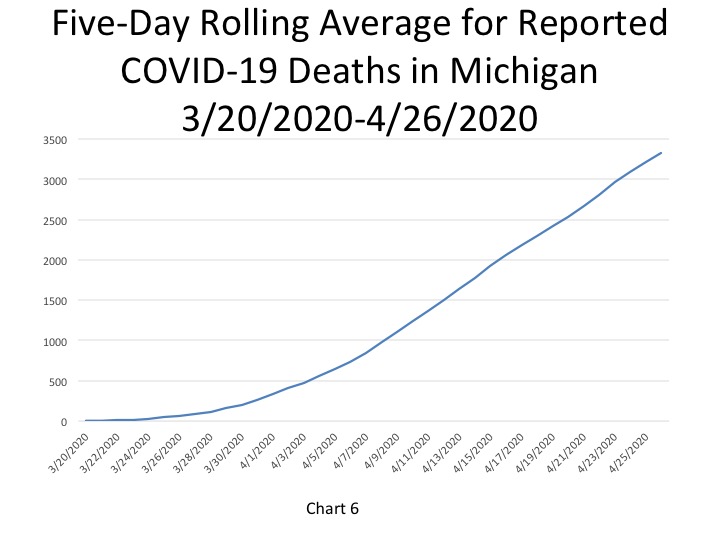
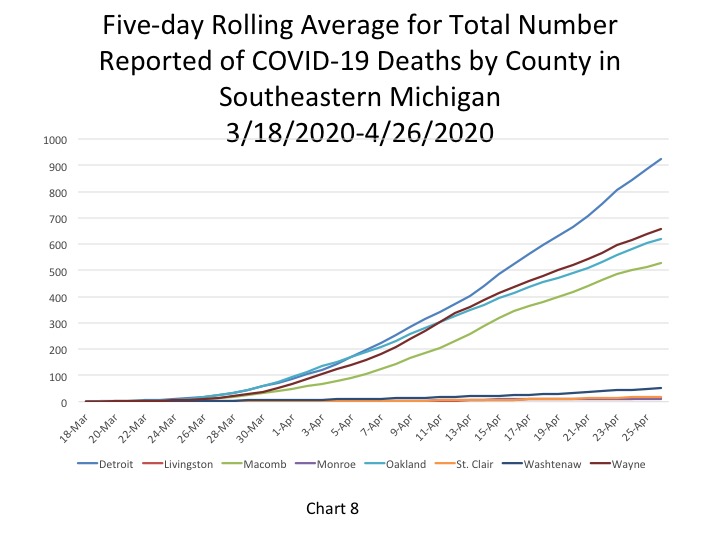
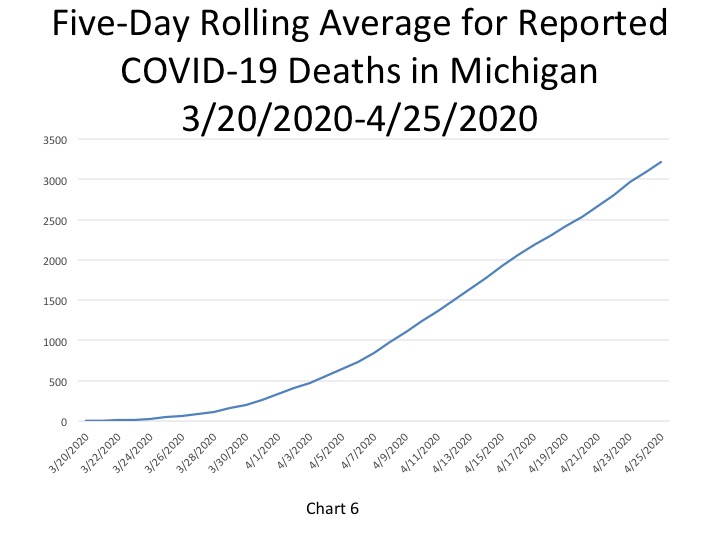
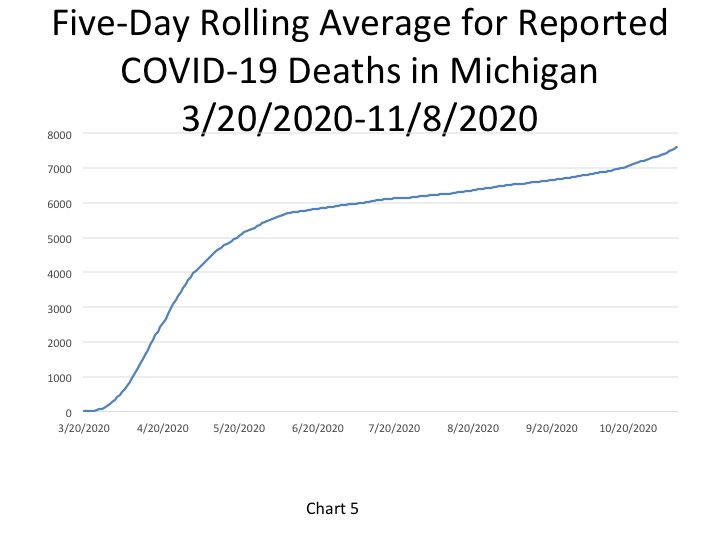
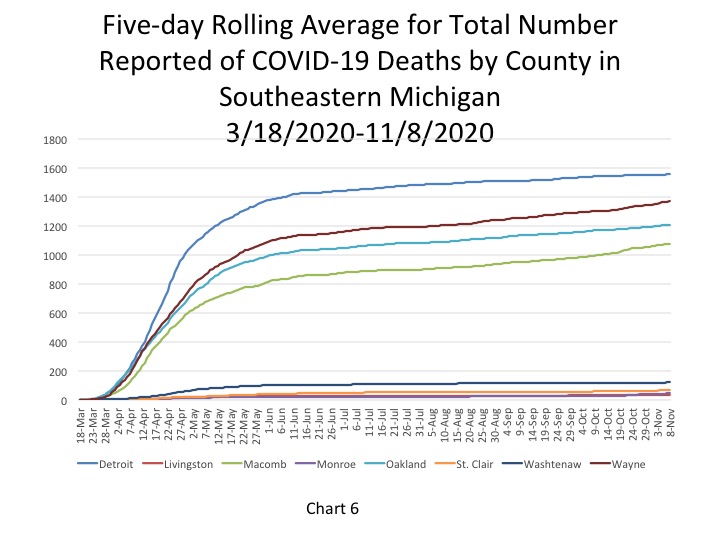
In Chart 5, the five-day rolling average for the number of deaths, shows the number of deaths in the State of Michigan reached 7,607 on Nov. 8. The actual cumulative COVID-19 deaths on Nov. 11 was 7,766, an increase of 42 deaths from the prior day. Chart 6 (a five-day rolling average) shows that on Nov. 8, the City of Detroit reported 1,556 deaths. Wayne County had the second highest total at 1,370 deaths on Nov. 8. Although the curved has flatted for the number of COVID deaths in Southeastern Michigan, state health officials are predicting those numbers to begin to increase at a more rapid rate again. For example, Spectrum Health on the west side of the state reported more COVID related deaths in the last three weeks and that they are preparing to hit capacity with COVID patients, according to a Detroit News article.
Michigan’s new daily COVID numbers continue to increase at a rapid rate. Between Sept. 1 and Nov. 11 new daily case numbers in Michigan went from 681 to 6,008. Although new daily case numbers are higher now than they were in April, some new trends have emerged. For example, the 20-29 age group leads with the most number of cases, and college campuses over the last several weeks have been experiencing large outbreaks. Even with demographics shifting since the spring, community spread is occurring, the numbers are increasing at a rapid rate, and hospitals are once again nearing capacity. Furthermore, positive COVID test rates have increased to 11.4 percent statewide; last month Michigan averaged a positive test rate of about 3.7 percent.
As all the data points to the fact that we are in the second-wave, it is vital that masks be worn in public and inside, social distance from others be maintained and gatherings be avoided.