On Aug. 3, the State of Michigan reported a total of 83,386 cases cases, an increase of 604 cases from the day prior. In terms of the number of new daily cases, the 604 new COVID cases reported on Aug. 3 is an increase from the 426 new cases reported on Aug. 2. Of the new 604 new COVID cases, 380 were documented in Southeastern Michigan. In total, 71 percent of the new COVID cases were in Southeastern Michigan, meaning case numbers are increasing at a higher rate locally. In Chart 1 we show that the State total for the number of COVID cases on Aug. 1 was 82,206–a five-day rolling average. The five-day rolling average for the total number of COVID cases (Chart 1) reflects a smoother curve and adjusts for fluctuations in testing and/or the quality of reporting or failure to report.
Chart 2 shows that, based on the five-day rolling averages, the growth of new COVID cases in Southeastern Michigan continues to increase, with the total number of cases in Wayne County now surpassing those being reported in Detroit. On Aug. 1, Wayne County’s numbers reached 12,959. Detroit reported 12,737 COVID cases on Aug. 1. Oakland County reported 11,529 cases and Macomb County reported 9,280.
The City of Detroit had 1,901 COVID cases per 100,000 people as of Aug. 3, an increase from 1,893 on Aug. 2 (Chart 3). This is based upon a reported increase of 55 new COVID cases between Aug. 2 and Aug. 3, bringing the total number of COVID cases in Detroit to 12,788. Wayne County reported 1,212 cases per 100,000 people, and Oakland County had 923 cases per 100,000 people. These per capita rates were based upon 13,038 total cases for Wayne and for 11,605 Oakland. Macomb County reported 1,073 cases per 100,000 people, which is based upon 9,384 cases.
The daily data highlighted in these posts is from Michigan.gov/coronavirus, where data is updated daily at 3 p.m. Historical data were supplied from covidtracking.com, which republishes COVID data from the State. Additionally, the case totals do not reflect the number of people who have recovered, just those who have been infected. In early June the State changed how it reports its data on the website, making data more accurate in the long-term but more complicated to track as well. The State regularly updates older data and as we continue to publish regular updates on COVID the State’s changes to past data many not always be reflected in our posts. The data published in new posts is accurate for the day we received it on though.
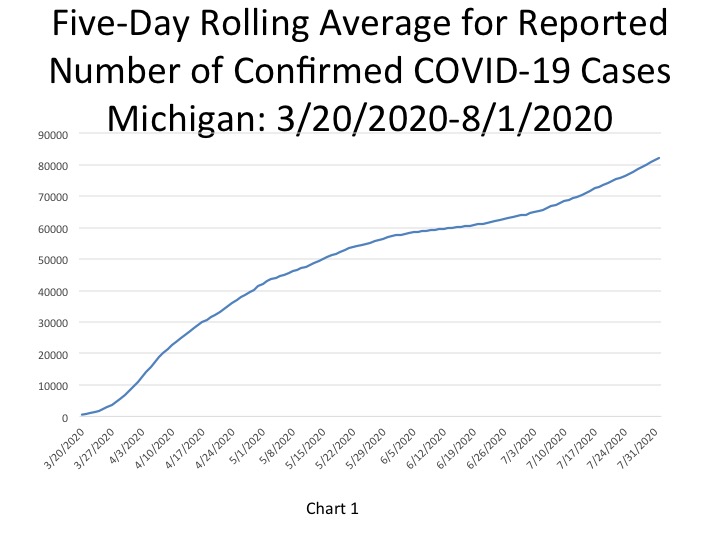
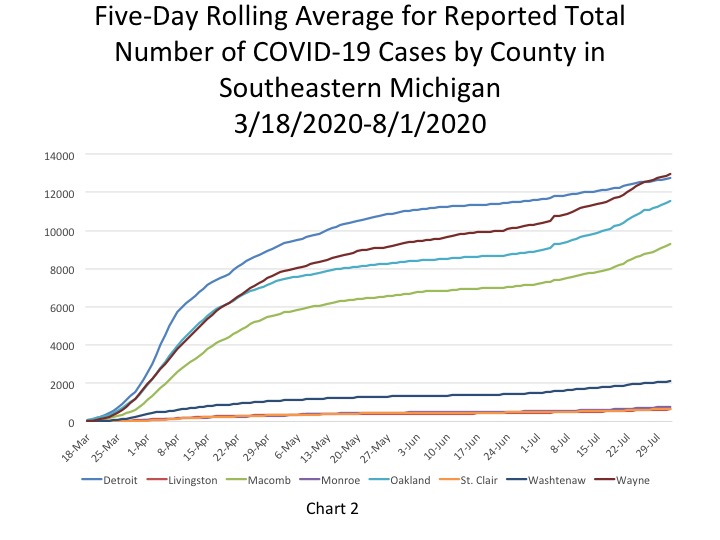
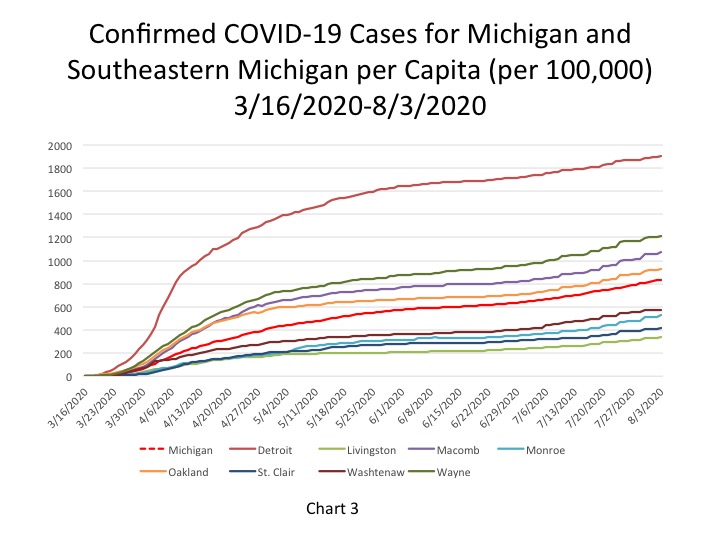
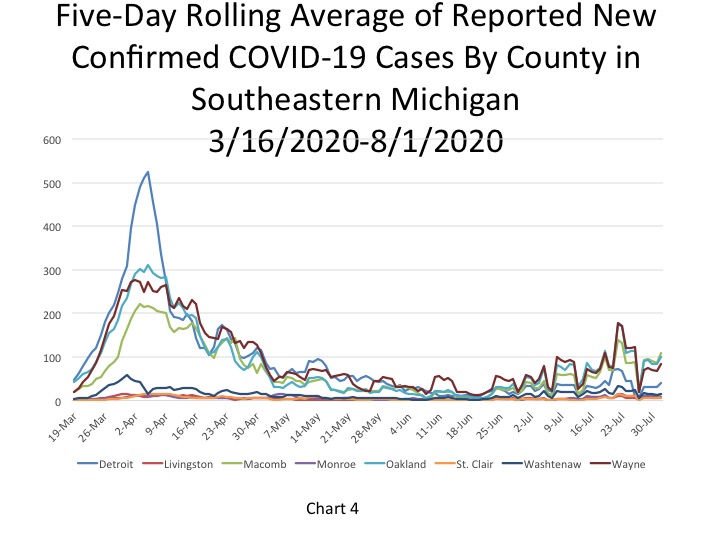
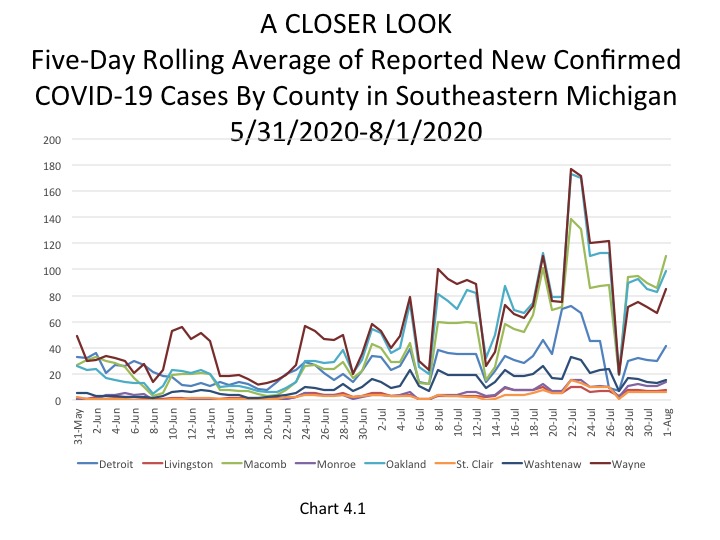
Chart 4 shows that Macomb County has been reporting the highest number of daily cases, according to the five-day rolling average, in about the last week. On Aug. 1, Macomb County reported 110 new daily cases; Chart 4.1 also shows this, but at a more zoomed in level. The charts also show that Detroit reported 41 new cases on Aug. 1, which is lower than the new cases reported out of Oakland and Wayne counties as well. Oakland County reported 99 new cases and Wayne County reported 85. Up until recently Wayne County had been consistently posting the highest new daily case numbers.
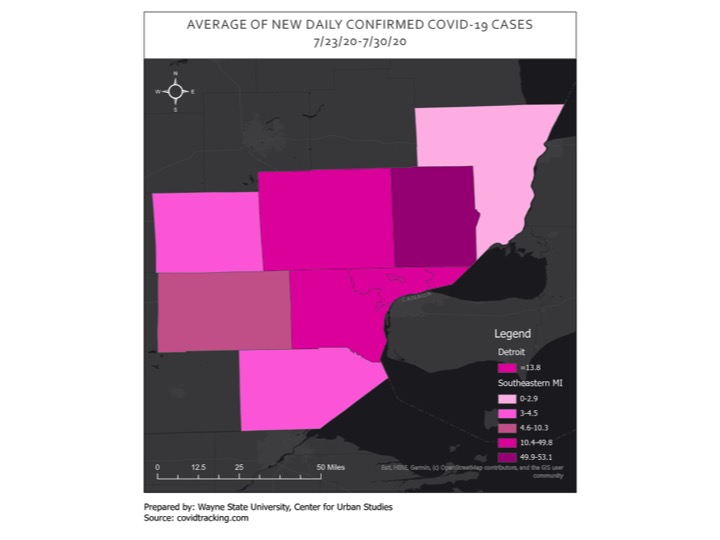
Map 1, which shows the average number of new daily COVID cases between July 23 and July 30 for Southeastern Michigan, highlights how Macomb County had the highest average number of new cases at 53.1, Oakland and Wayne counties were right behind it with an averages of 49.8 and 48.3 new daily cases, respectively. The average number of new cases for the City of Detroit in that time frame was a least half of those numbers; Detroit averaged 13.8 new cases. Comparing the average weekly data and the data from the new daily cases reported for Aug. 1 does show that new daily cases numbers are higher this week, thus far, than last—showcasing that COVID numbers are on the rise again.
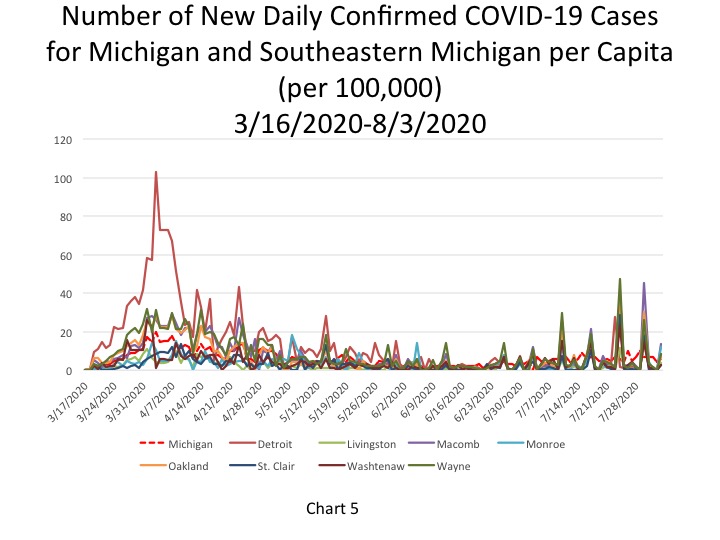
On Aug. 1, the per capita rate for the number of new daily COVID cases per 100,000 people was 6 for the State, which was equivalent to 604 new cases (Chart 5). Macomb County reported the highest per capita rate for the number of new daily COVID cases per 100,000 people at 14, which was equivalent to 120 new cases while Monroe County reported a rate of 12, which was equivalent to 8 new cases. Detroit reported a per capita rate for the number of new daily COVID cases per 100,000 people at 8 (55 new cases) and Wayne County had a rate of 9 (92 new cases).
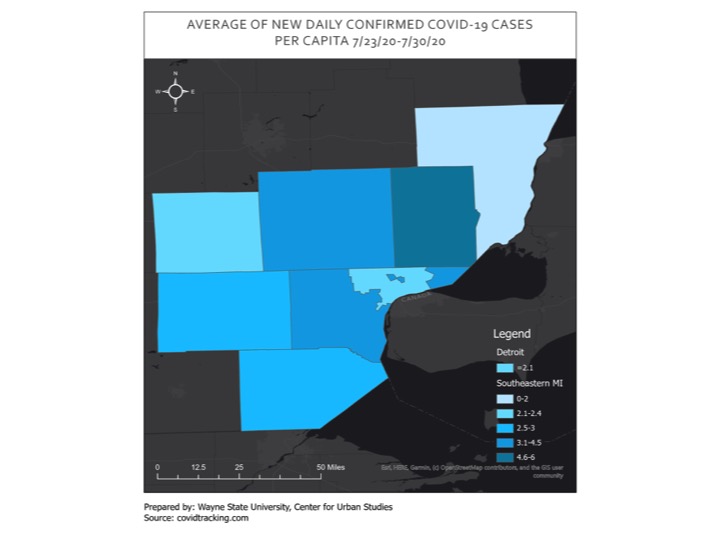
Map 2 mimics the message of Map 1, with Macomb County having the highest average number of daily confirmed COVID cases per 100,000 between July 23 and July 30. During that week Macomb County had an average of 6 daily COVID cases per 100,000 people. Detroit averaged a per capita rate of 2.1 during that time frame.
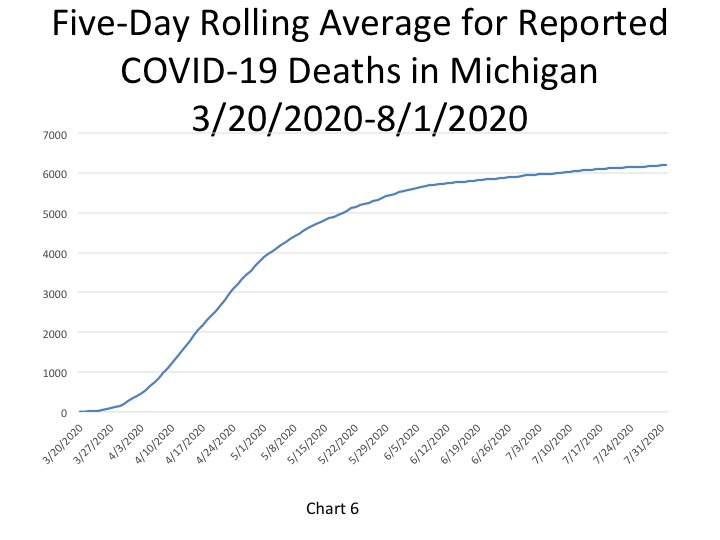
In Chart 6, the five-day rolling average for the number of deaths in Michigan, shows the number of deaths in the State of Michigan reached 6,203 on Aug. 1. The actual cumulative COVID-19 deaths on Aug. 3 was 6,202, an increase of 6
deaths from the prior day. Of the 6 deaths that were reported on Aug. 3, 1 occurred in Southeastern Michigan.
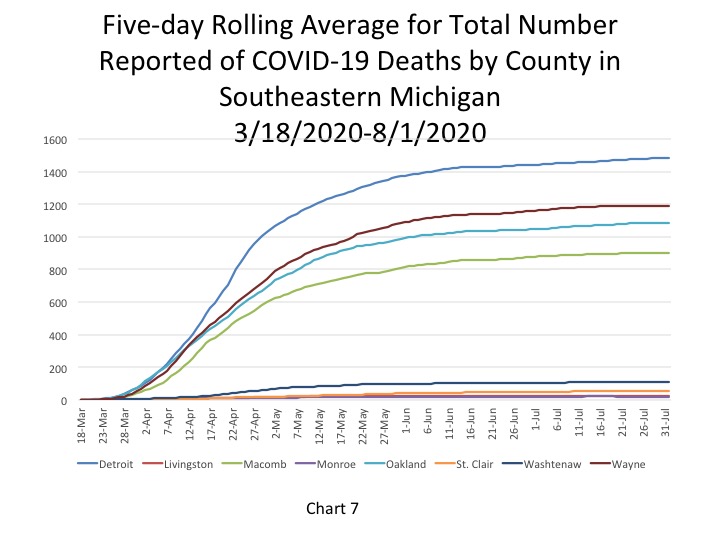
Chart 7 (a 5-day rolling average) further hones in on how majority the number of COVID related deaths has significantly flattened out in Southeastern Michigan. On Aug. 1, the City of Detroit reported 1,485 deaths. Wayne County had the second highest total at 1,192 deaths on Aug. 1.
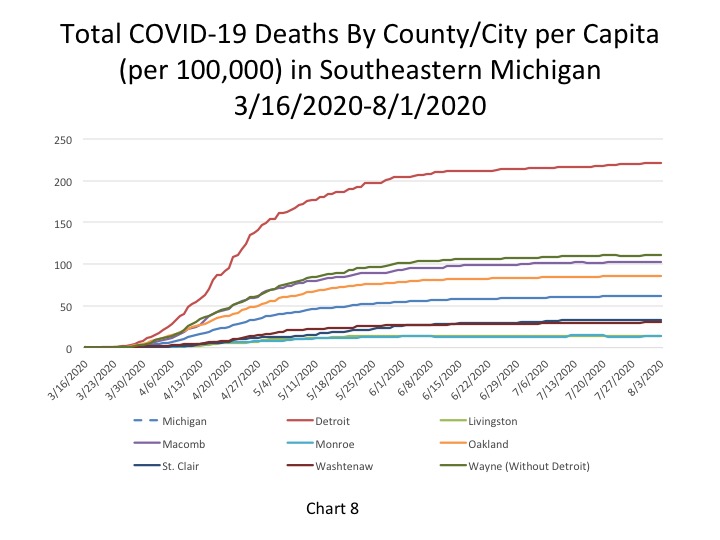
Like the death numbers, the per capita rates for the number of total COVID deaths in Southeastern Michigan continues to remain fairly stagnant across the region. Detroit reported 221 total COVID deaths per 100,000 people on Aug. 3, which was equivalent to 1,486 deaths. Wayne County reported a per capita rate of 111 (1,192 deaths), Macomb County reported a per capita rate of 103 (899 deaths) and Oakland County reported a per capita rate of 86 (1,084 deaths). The State of Michigan reported a per capita rate for the number of total COVID deaths at 612per 100,000 people, which was equivalent to 6,202 total deaths.
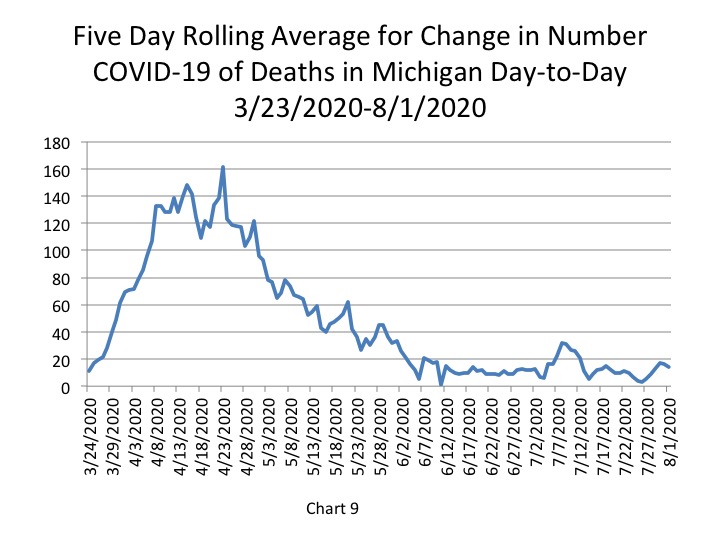
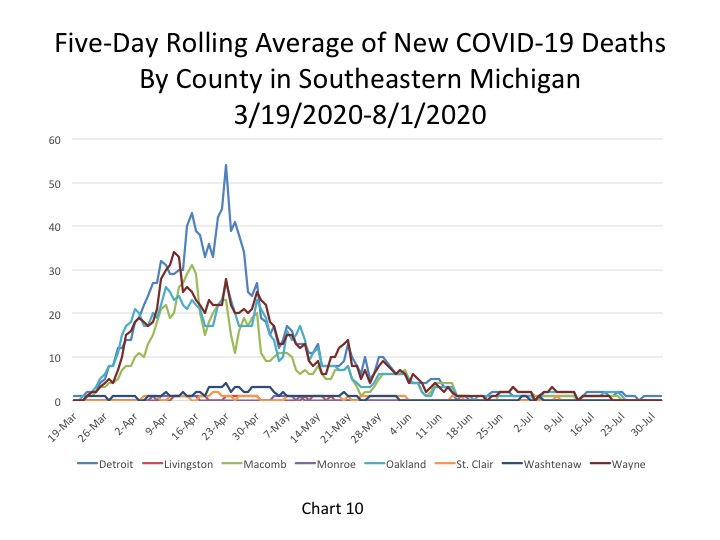
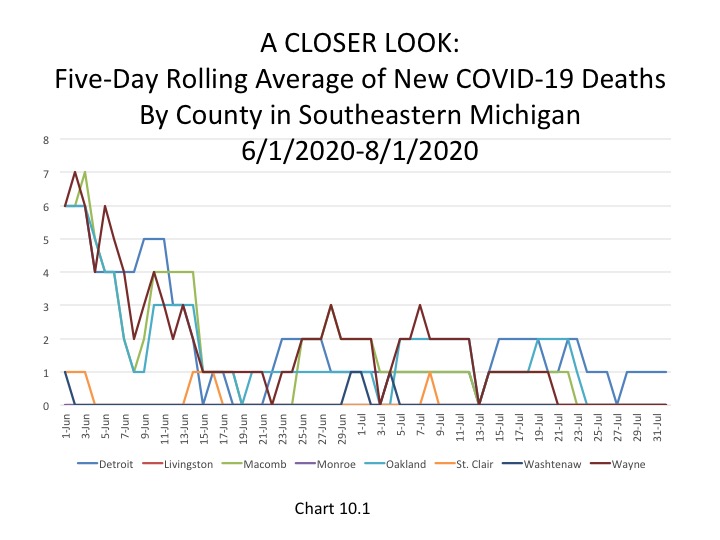
Chart 9, the five day rolling average of deaths, shows the number of new statewide deaths was reported at 14 on Aug. 1. Furthermore, Chart 10 and Chart 10.1 shows how the number of deaths in Southeastern Michigan continues to remain low in the region. Chart 10.1 shows a more in-depth look at the number of new daily COVID deaths in the last month so viewers can better discern where in the Southeastern Michigan the numbers are increasing, decreasing or remaining the same. Detroit reported 1 new daily death on Aug. 1 while all the counties reported 0.
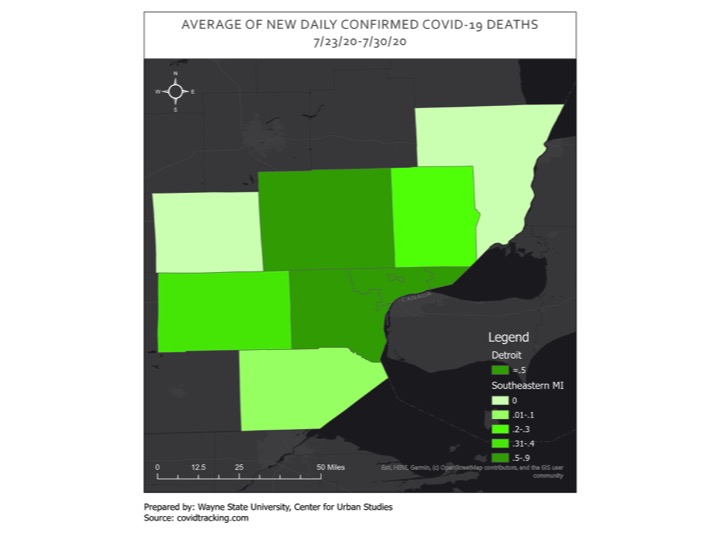
In Map 3, Wayne and Oakland counties had the highest average number of daily COVID deaths between July 23 and July 30 at 0.9 and Detroit averaged 0.2 deaths. The averages reported from last week reinforce the message that COVID deaths remain low and on the decline.
A review of the most recent COVID numbers for the State of Michigan and the Southeastern Michigan reason show that COVID case numbers are increasing, while deaths remain low and fairly stable. It is clear that large gatherings, which have again been banned, are being attributed to several of the outbreaks in the area. We must remain diligent in fighting the virus and that means minimal contact with others, no large gatherings and wearing a mask.