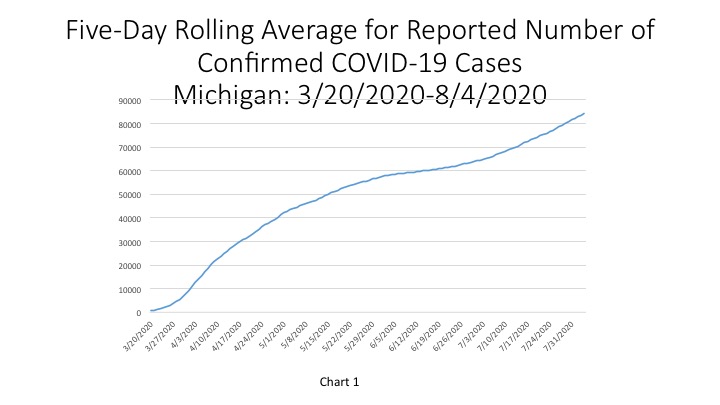
On Aug. 6, the State of Michigan reported a total of 85,429 cases, an increase of 726 cases from the day prior. In terms of the number of new daily cases, the 726 new COVID cases reported on Aug. 6 is an increase from the 657 new cases reported on Aug. 5. In Chart 1 we show that the State total for the number of COVID cases on Aug. 4 was 84,071–a five-day rolling average. The five-day rolling average for the total number of COVID cases (Chart 1) reflects a smoother curve and adjusts for fluctuations in testing and/or the quality of reporting or failure to report.
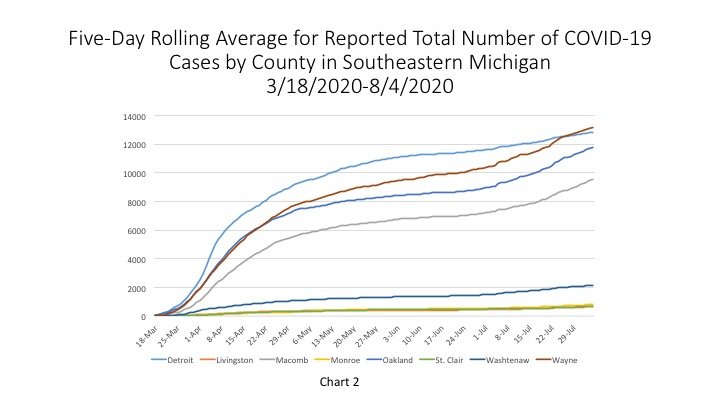
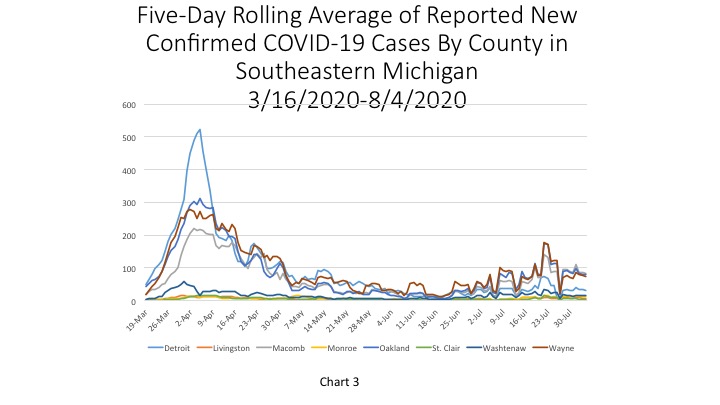
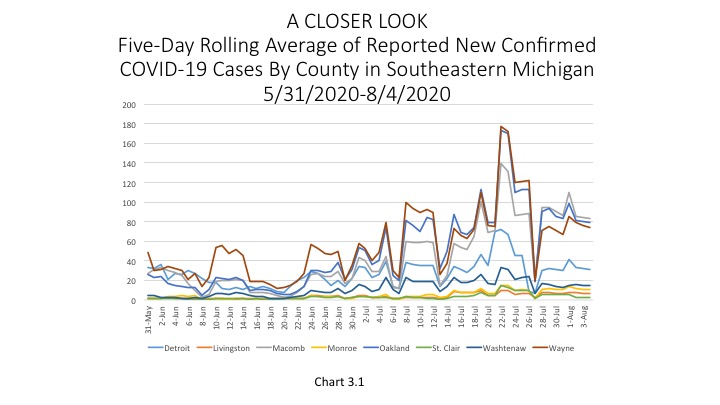
Chart 2 shows that, based on the five-day rolling averages, the growth of new COVID cases in Southeastern Michigan continues to increase, with the total number of cases in Wayne County continuing to rise above the other counties in the region. On Aug. 4, Wayne County’s numbers reached 13,187. Detroit reported 12,833 COVID cases on Aug. 4. Oakland County reported 11,769 cases and Macomb County reported 9,531. While the number of COVID cases in Wayne County is the highest in the region, Charts 3 and 3.1 (which is just a closer look at the data) shows that Macomb County has recently had the highest number of new daily COVID cases. According to the five-day rolling average, Macomb County reported 79 new cases. On Wednesday, Macomb County was labeled as one of three hot spot counties in the State, which is certainly related to the high number of new daily cases the County is reporting. Also on Aug. 4, Wayne County reported 74 new cases and Detroit reported 31 new COVID cases.
The daily data highlighted in these posts is from Michigan.gov/coronavirus, where data is updated daily at 3 p.m. Historical data were supplied from covidtracking.com, which republishes COVID data from the State. Additionally, the case totals do not reflect the number of people who have recovered, just those who have been infected. In early June the State changed how it reports its data on the website, making data more accurate in the long-term but more complicated to track as well. The State regularly updates older data and as we continue to publish regular updates on COVID the State’s changes to past data many not always be reflected in our posts. The data published in new posts is accurate for the day we received it on though.
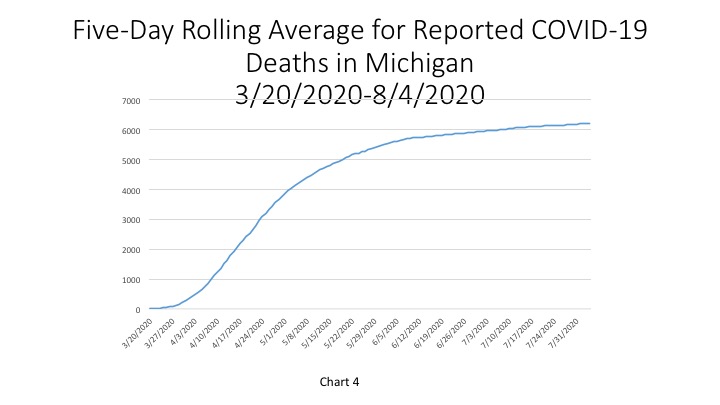
In Chart 4, the five-day rolling average for the number of deaths in Michigan, shows the number of deaths in the State of Michigan reached 6,221 on Aug. 4. The actual cumulative COVID-19 deaths on Aug. 6 was 6,246, an increase of 26 deaths from the prior day. However, of those 26 deaths, 17 were added to the daily total after death certificates were compared to the COVID database. Furthermore, of those 26 deaths 1 occurred in Southeastern Michigan.
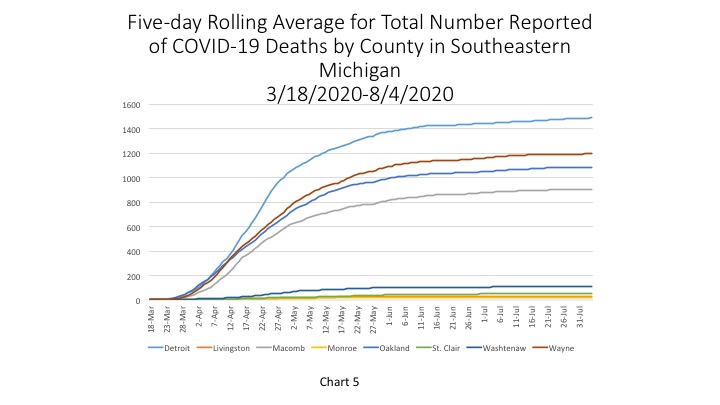
Chart 5 (a 5-day rolling average) further hones in on how majority the number of COVID related deaths has significantly flattened out in Southeastern Michigan. On Aug. 4, the City of Detroit reported 1,488 deaths. Wayne County had the second highest total at 1,197 deaths on Aug. 4.
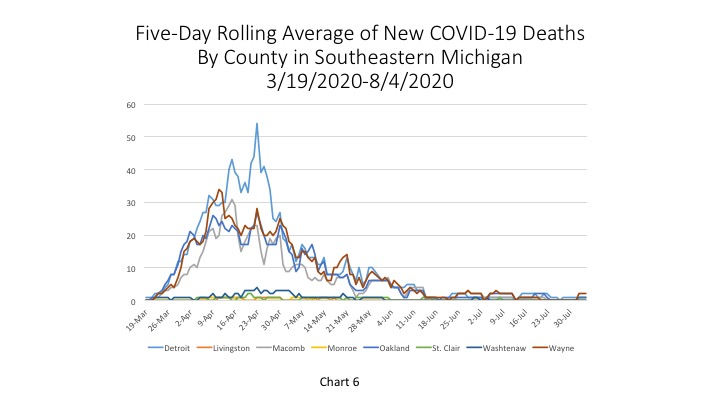
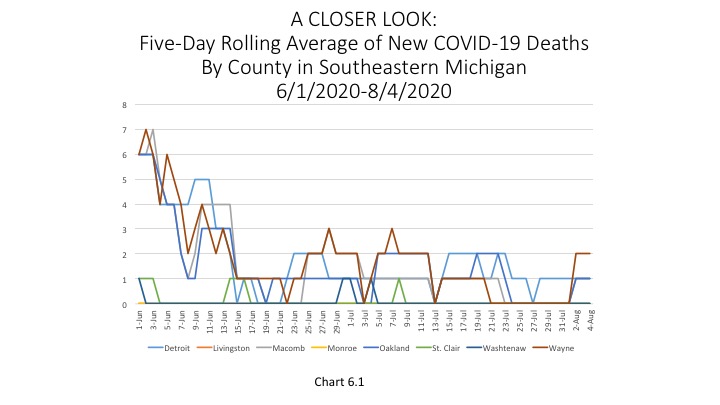
Charts 6 and Chart 6.1 shows how, on average, the number of daily COVID deaths has not risen above 2 since July 7. On Aug. 4, Wayne County reported the highest number of deaths at 2.
While the State of Michigan reported 726 new COVID cases on Aug. 6 Michigan’s Chief Medical Examiner Dr. Joneigh Khaldun said we are starting to see a plateau in the number of cases. She warned though that this does not mean citizens should ease up on restrictions, such as social distancing and wearing masks. Furthermore, while most of the State is seeing a plateau, Dr. Khaldun also noted that the Grand Rapids and Kalamazoo regions are still experiencing higher daily case numbers than other regions in the State, but those too are beginning to decrease.