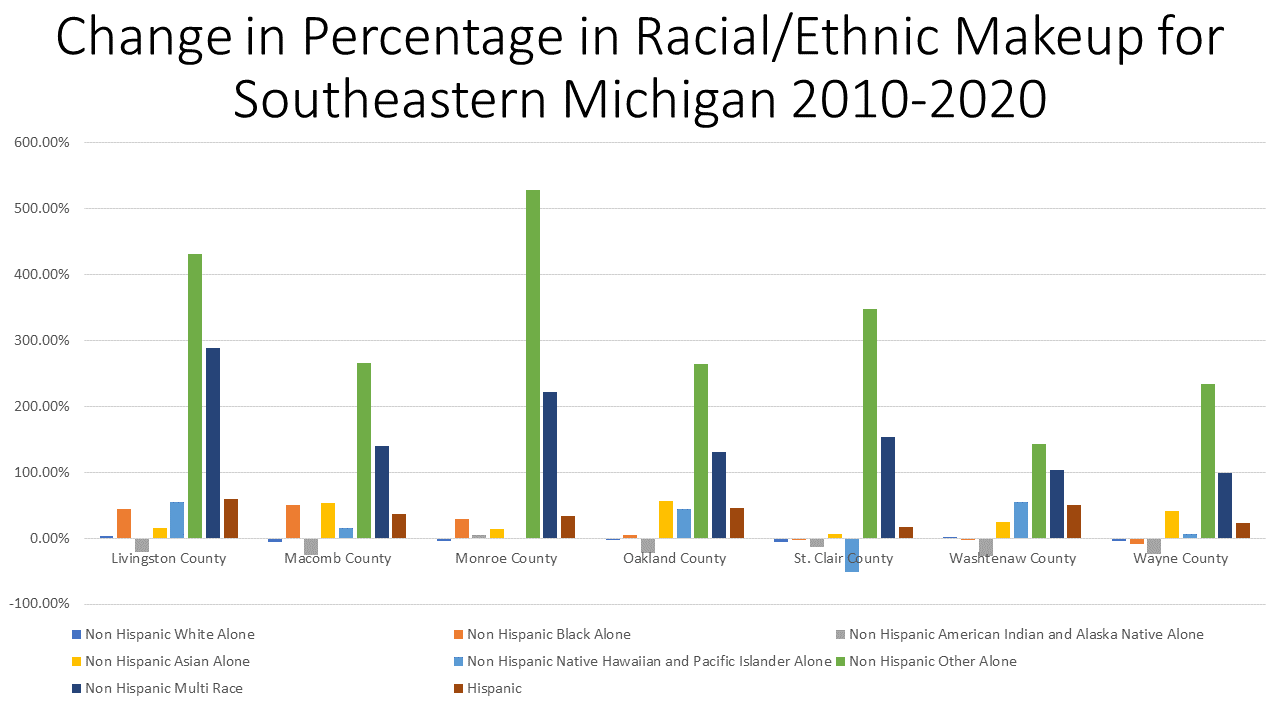
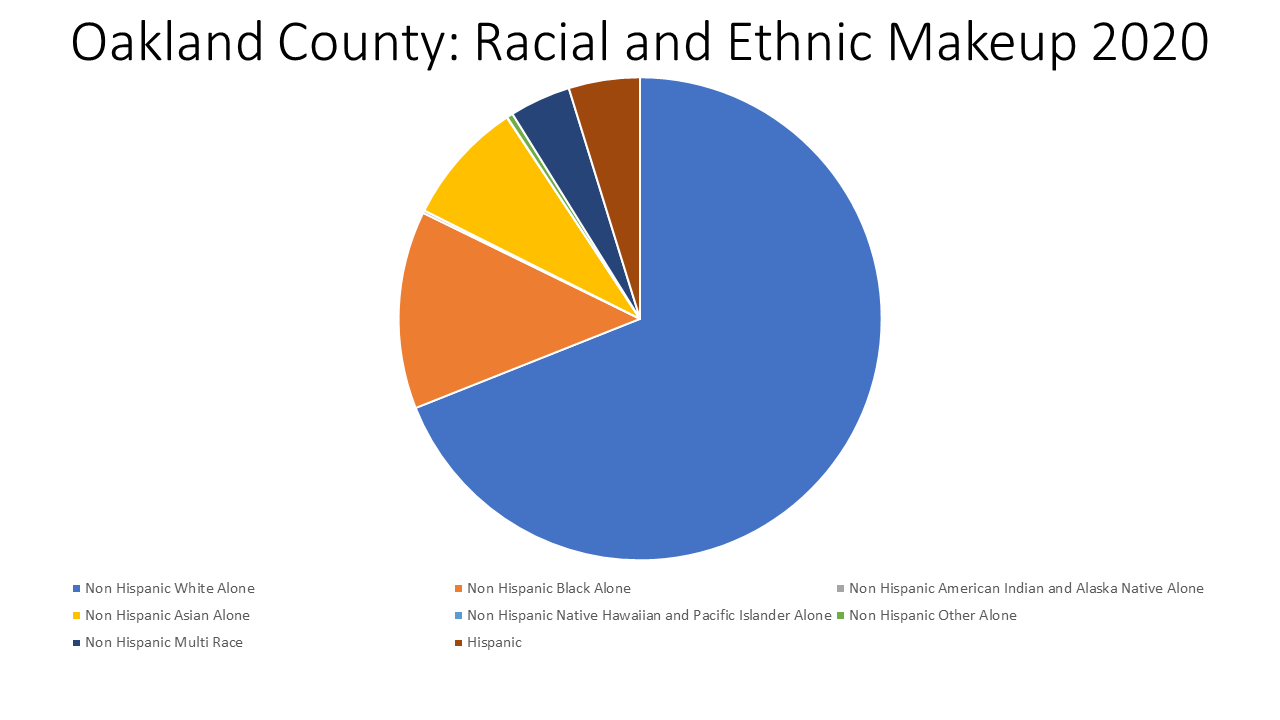
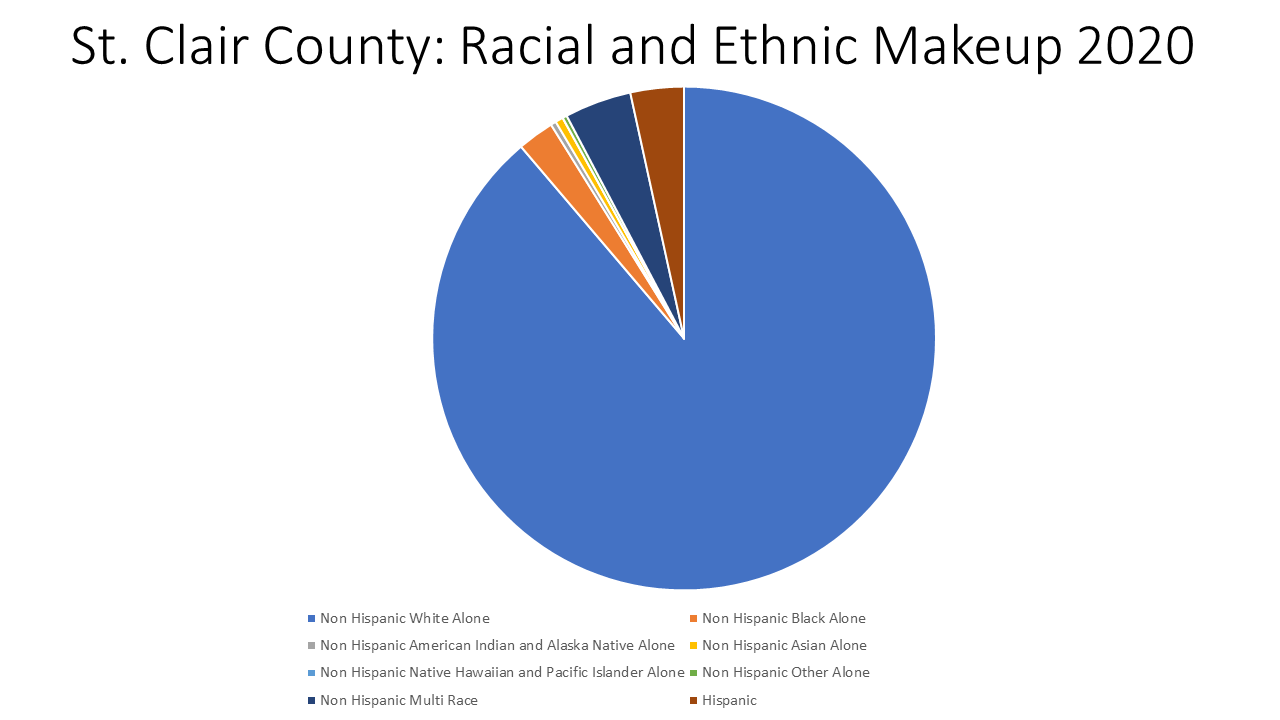
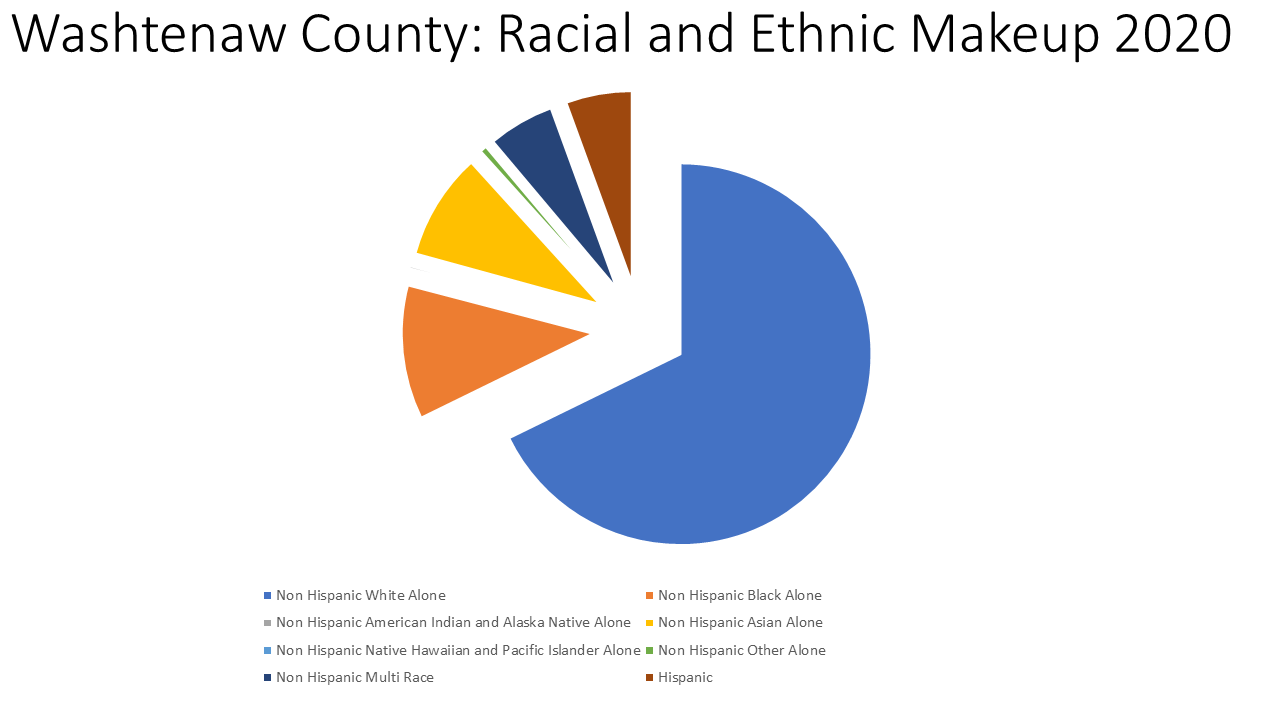
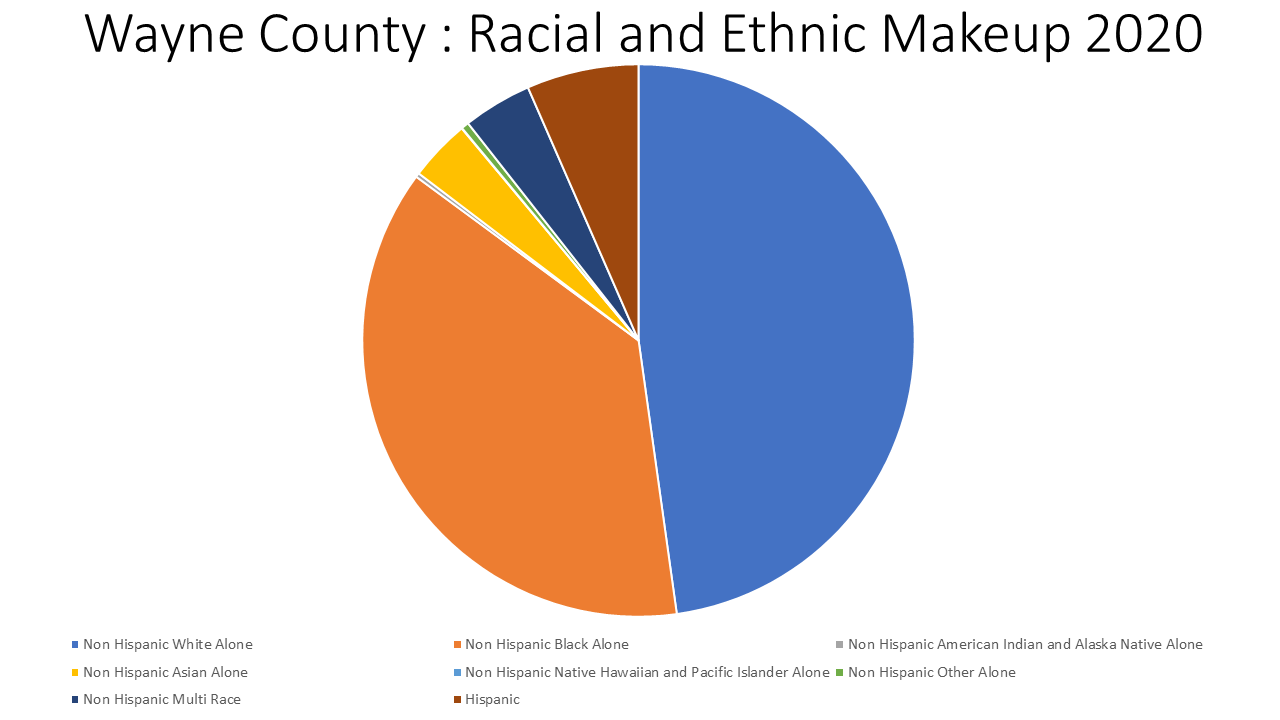
Preliminary data from the 2020 Decennial Census was recently released, including population and race and ethnicity data. Below we explore the racial makeup of each county in Southeastern Michigan according to the 2020 Census and how those numbers changed between 2010 and 2020. Overall, the charts below show that the Non-Hispanic white population makes up the highest percentage of each county’s population in the region. However, five of the seven counties lost a percentage of that population (Washtenaw and Livingston counties gained) yet gained other racial and ethnic populations.
Overall, Monroe County had the highest percentage of a certain population gain between 2010 and 2020 for any racial or ethnic background at 528 percent for the “Non-Hispanic Other” designation by the 2020 Census. This racial/ethnic group also had the highest percentage gain for each county in the region. Other data points to note are how St. Clair, Washtenaw and Wayne counties all lost a percentage of their black populations while the other four counties in the region (Livingston, Macomb, Monroe and Oakland counties) all gained a percentage of that population between 2010 and 2020. Macomb County had the highest percentage increase in its black population between 2010 and 2020 percent at 50 percent, followed by Livingston County with a 44 percent increase and Monroe County with a 28 percent increase.
Another racial group each county in Southeastern Michigan gained was the Asian population between 2010 and 2020. Oakland County gained the highest percentage at 56 percent, followed by Macomb County which experienced a 53 percent increase in its Asian population between 2010 and 2020, according to the 2020 Census.
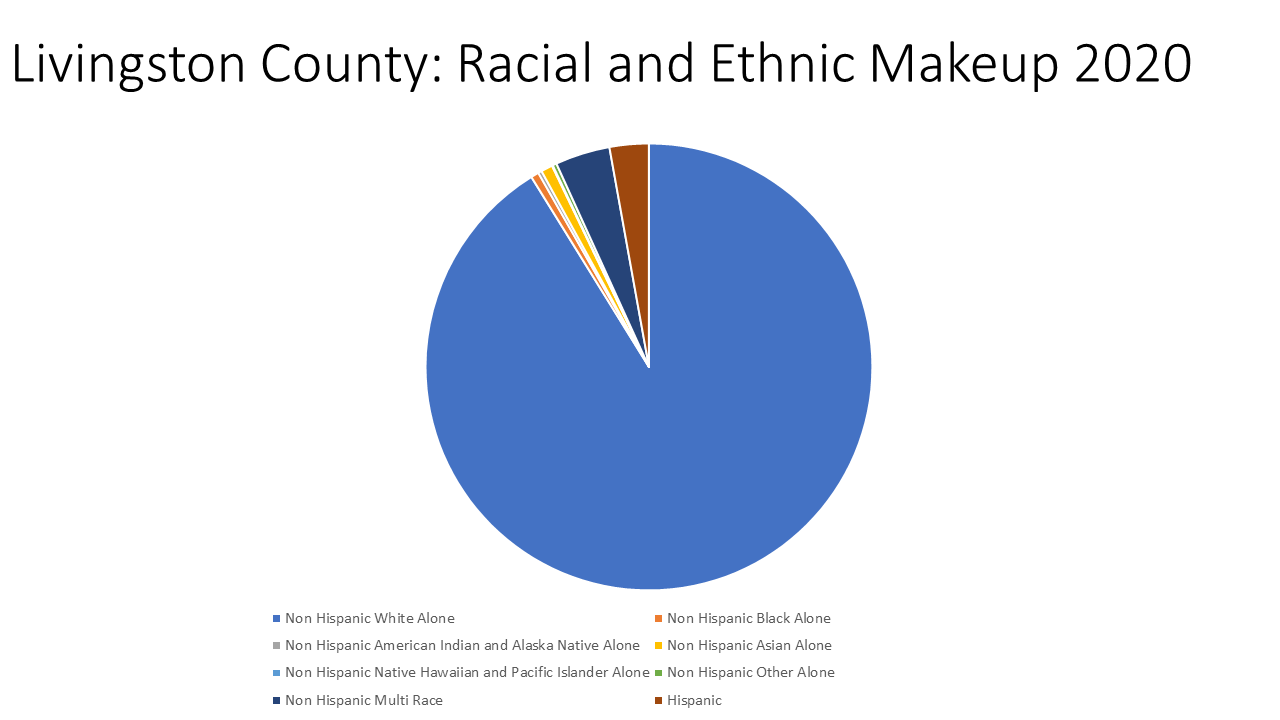
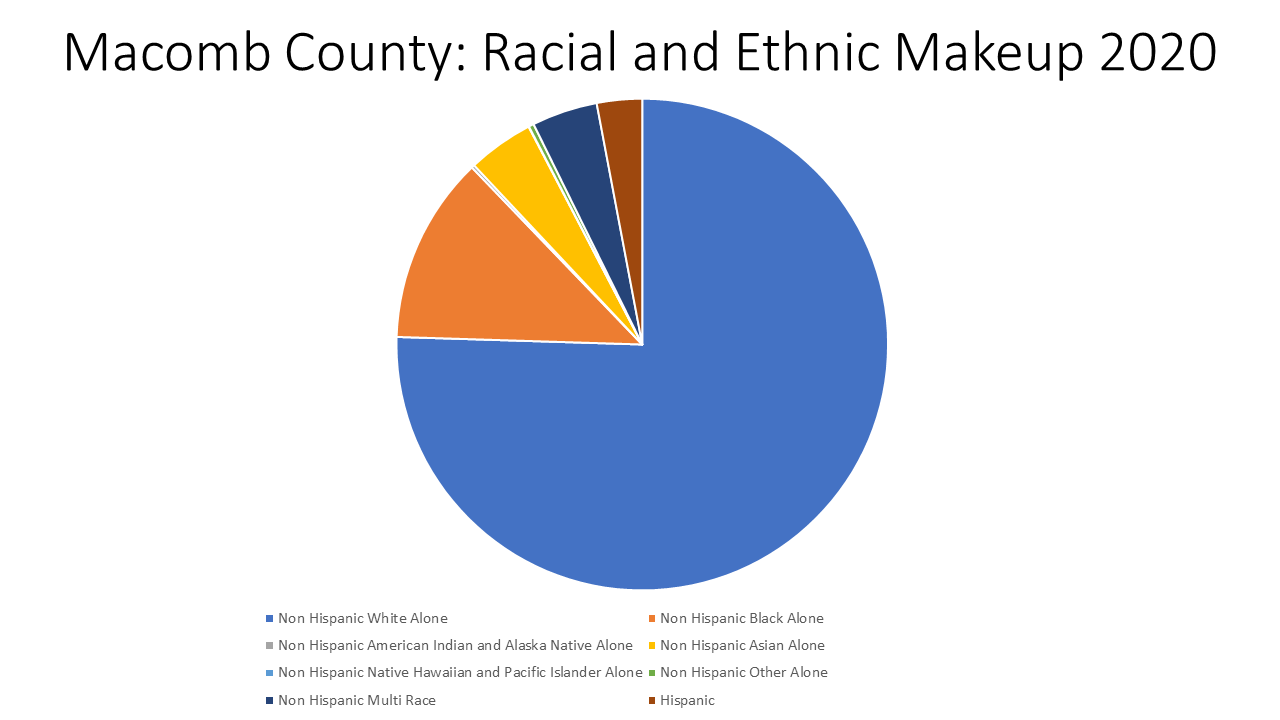
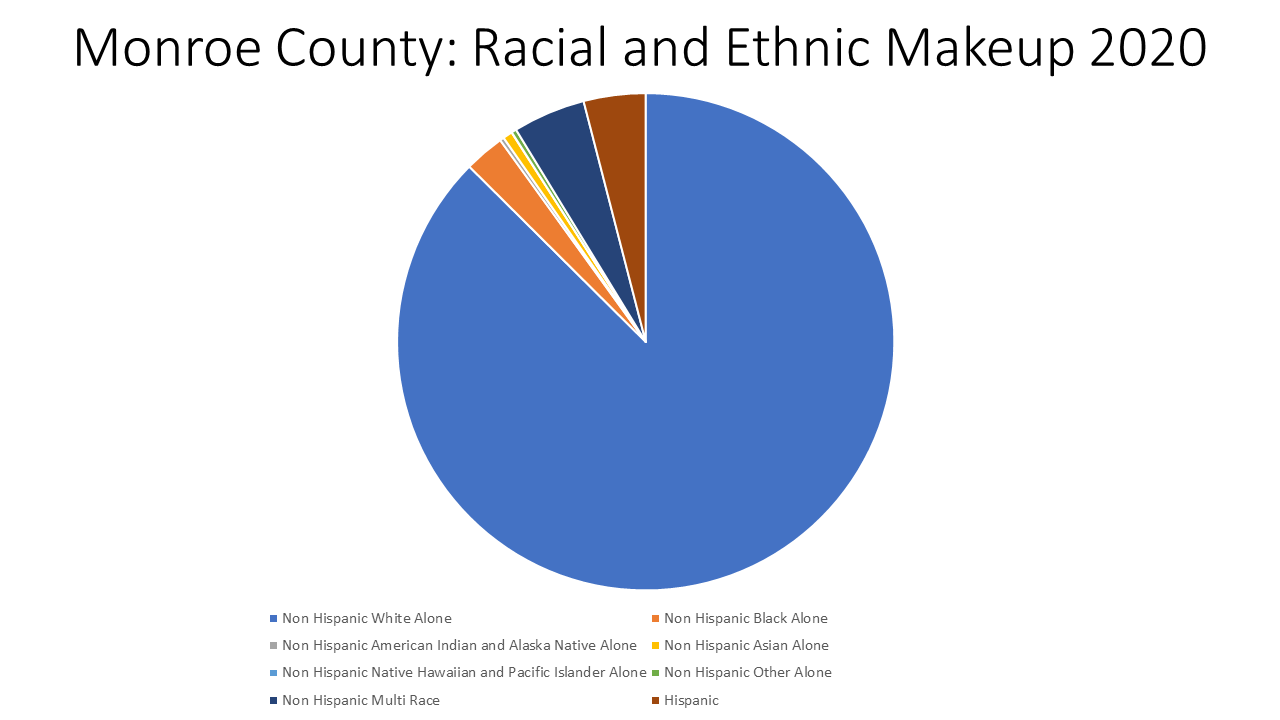
Each pie chart below shows what the 2020 racial makeup of each county in Southeastern Michigan was, according to the 2020 Census. As noted, the Non-Hispanic white population made up the highest percentage of each county’s population in the region, however some counties in the region were, and remain to be, more diverse than others. Wayne County had the highest percentage of a black population, despite a population loss of that racial group between 2010 and 2020, at 37 percent. As mentioned, Macomb County had the highest percentage increase in its black population between 2010 and 2020 percent at 50 percent, followed by Livingston County with a 44 percent increase and Monroe County with a 28 percent increase. Of those counties, the percentage of black residents in Macomb County in 2020 was 12 percent; in Livingston County that percentage was 1 percent and in Monroe County that percentage was 3 percent.
Conversely, Livingston County had the highest percentage of the Non-Hispanic white population at 91 percent, in which there was a 2.5 percent population increase of between 2010 and 2020.
So, overall while some of these counties did experience notable gains in certain populations, such as the black and Non-Hispanic “other” and “multi” populations, the overall percentage some racial ethnic groups gained still did not bring them even close to making up the majority of a county’s overall population group.
As 2020 Census data continues to become more available, we will further explore what population changes have occurred over the last 10 years in Southeastern Michigan. We do know, as shown above, that there have been overall population gains and losses in each county and racial and ethnic population gains and losses. Being able to dig deeper into where these gains and losses occurred at the municipal and Census tract level will further help us understand how the region is changing.