Murders across Southeastern Michigan decreasing

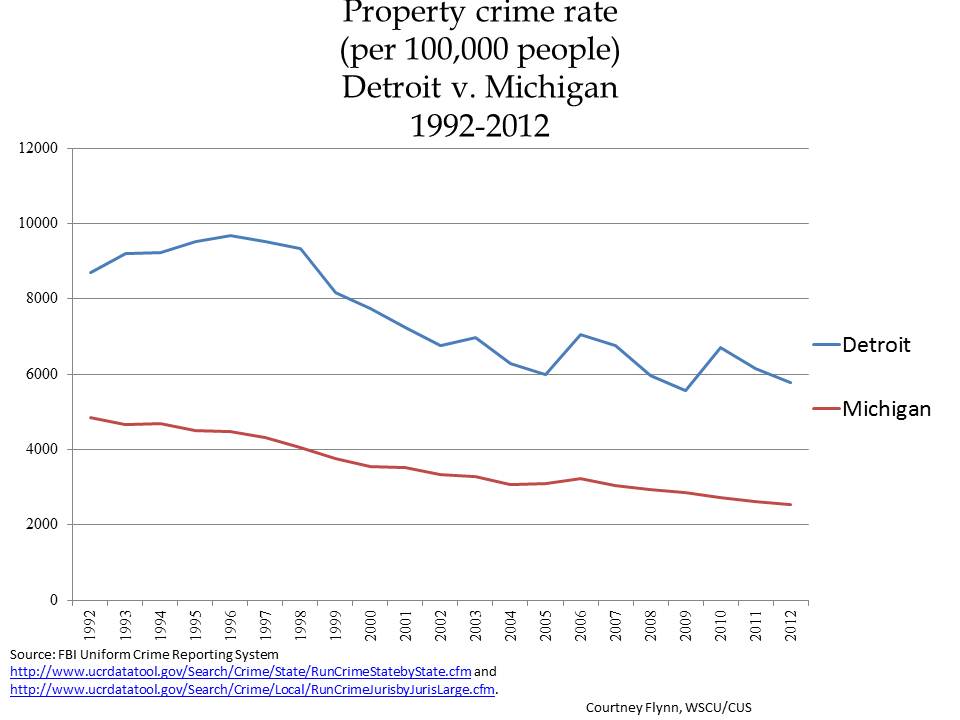
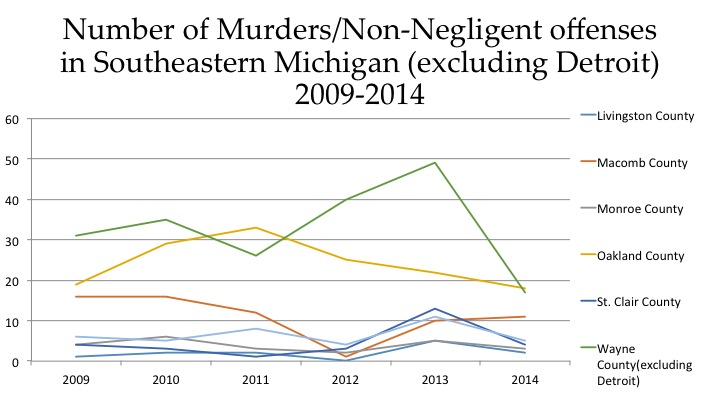
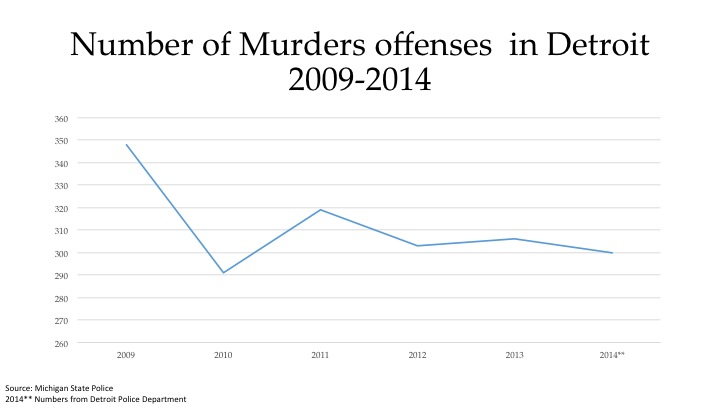
Detroit may no longer be grimly perched a top the Federal Bureau of Investigation’s murder-rate list (St. Louis took that spot for 2014), but regionally it still stands out. The city of Detroit has consistently had the highest number of murder/non-negligent manslaughter offenses throughout the region, even prior to 2009. While the six-year span from 2009-2014 the city’s murder offenses number peaked at 348 in 2009, the counties in the region did not experience the same trend. Rather, in the same time frame, the number of murder/non-negligent manslaughter offenses in Oakland County peaked in 2011 at 33, the only year in that time frame in which there were more offenses there than in Wayne County. In 2011 Wayne County’s number dropped to 26 from 35 the previous year; that same year Detroit’s number increased to 291 from 319.

From 2012 to 2013 all the counties in the region, with the exception of Oakland and Monroe counties, experienced an increase in the number of murder/non-negligent manslaughter offenses. Wayne County experienced the largest increase at 9; Oakland County’s number dropped by 10 that year. From 2013 to 2014 Wayne County again experienced a dropped, from 49 to 17. While these numbers do not include Detroit’s murder data, it does follow the same trend of Detroit’s murder numbers dropping to an all time low in 2014. In 2014, according to the Michigan State Police Data, it was Oakland County with the highest number of murders (excluding the city of Detroit) at 18. Although Oakland County had the highest county number in 2014 it has been experiencing a decrease since 2011, when it reached a peak of 33.

Slide3

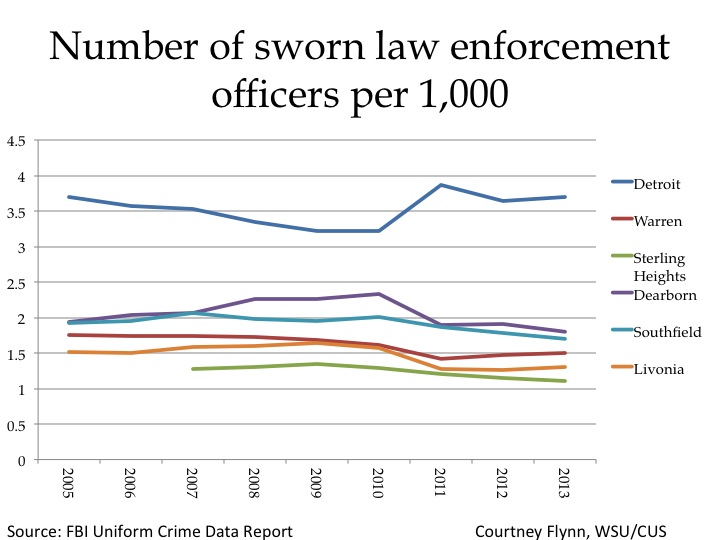
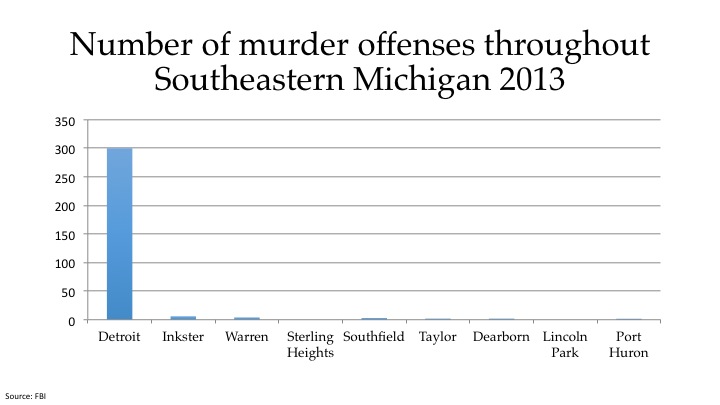
While Detroit may have the highest number of murder offenses in the region, it has experienced a decrease in that, and violent crime overall. In 2014, according to information provided by Police Chief James Craig, Detroit had the fewest number of criminal homicide offenses in the last 47 years. The chart shows just how drastic the number of murder offenses is between Detroit and other regional cities though. With Detroit’s murder offense number at 300 in 2014 the city police agency that reported the second highest murder offenses in the region was Inkster with a number of 6. Warren, which is the second largest city both in the region and the state, had four murder offenses and Sterling Heights, the fourth largest city in the state, had zero.

Throughout the state though Flint had the second highest number of reported murder offenses at 28 and Saginaw came in third with 11.

Slide5
Slide6


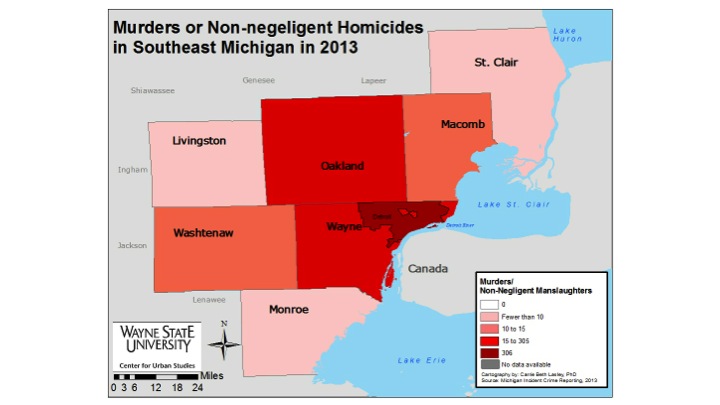
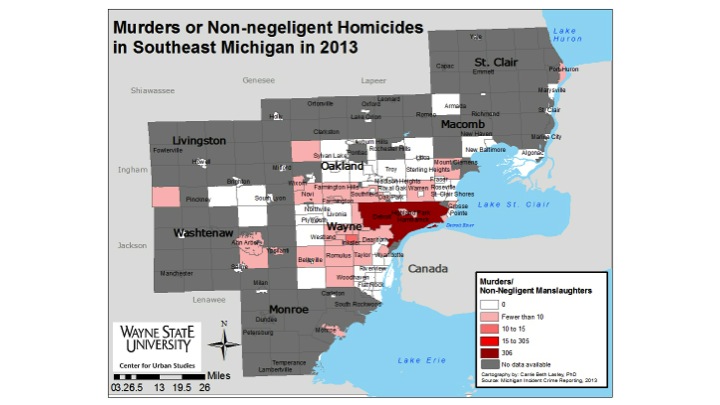
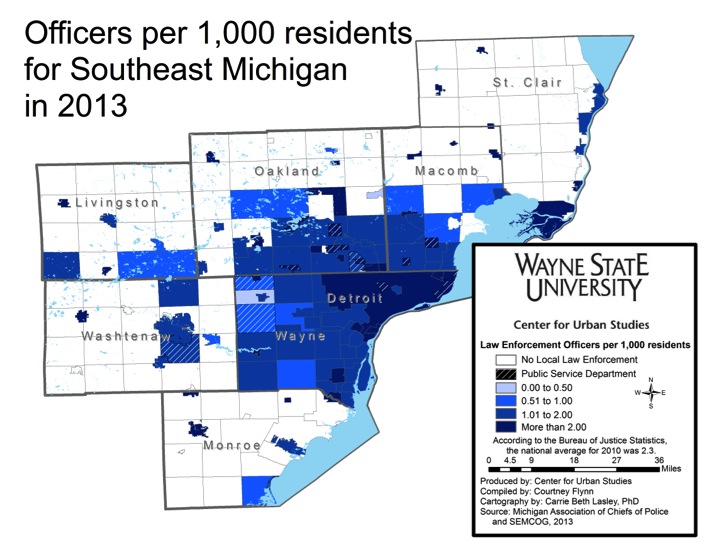
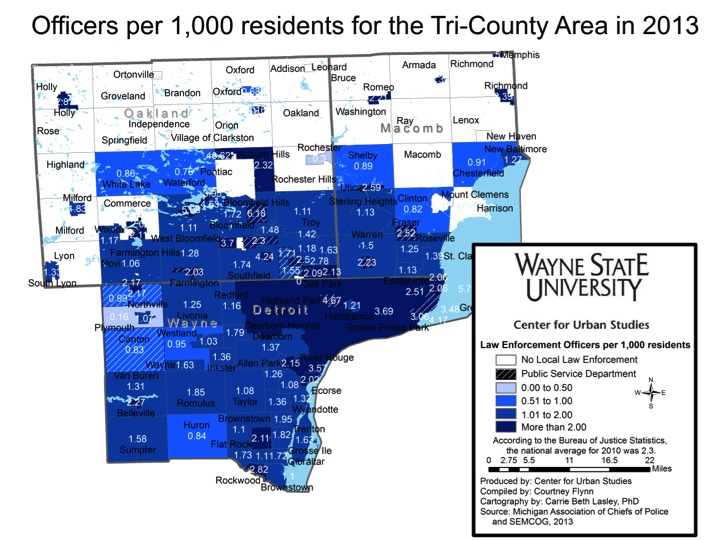
According to 2013 data from the Michigan State Police, which is mapped below, there were 306 murders/non-negligent manslaughter occurrences in the city of Detroit in 2013 and 96 everywhere else throughout the region. St. Clair County had the least, with just three in the county in 2013, two of which occurred in Port Huron. Wayne County had the highest number of murders/non-negligent manslaughter offenses in 2013, with 306 occurring in Detroit and 49 occurring elsewhere throughout the county. Even when removing Detroit data from Wayne County’s numbers, Wayne County would have still sat atop the list regionally. Of the 49 murders/non-negligent murder offenses that occurred in Wayne County, outside of Detroit, 15 occurred in Inkster, according to the Michigan State Police.

Slide8

Slide9

Michigan’s CPL application process being modified

Each county in Michigan has a gun board which uses its discretion to determine if Concealed Pistol License (CPL) applicants meet the qualifications to obtain or renew their license. Each gun board has a representative from the County Prosecutor’s Office, the County Sheriff’s Department, and the Michigan State Police (MSP). Until December 1, 2015 it is at the discretion of each county gun board to determine if an applicant is fit to obtain or renew a CPL. While each gun board has the authority to request applicants to appear before it, Macomb County is the only county in the state to require all new applicants to appear before its gun board.

On December 1, 2015, however, this present system will change.

Under legislation signed by Gov. Rick Snyder in March (Public Act 3 of 2015), county gun boards in the state of Michigan will cease to exist after November 30, 2015. Instead, local control will shift to the state. The County Clerk’s Office will still process and distribute licenses, but the MSP will determine whether or not an applicant is fit to hold a CPL. According to the new law, the MSP will verify the requirements an individual must meet in order to obtain a CPL by using the law enforcement information network and the national instant criminal background check system. Should the MSP find that an individual is not qualified to have a CPL, that information will be relayed to the County Clerk’s Office.

According to Gov. Rick Snyder, these changes will allow for a more unified process that will “better support the rights of firearm owners.” Opponents, however, have criticized the change because of the loss of local control over the process. To read more on this issue, click here.

While any person is able to apply for a CPL the state has the right to deny such requests for a variety of reasons. This process, which will be slightly modified beginning Dec. 1, 2015, is intended to protect the public and prevent potential misuse of a firearm.

The map below shows the percent of CPL applications denied by each county in the Southeastern Michigan region in 2013. As shown, Wayne County had the highest denial rate at 4.5 percent while St. Clair County had the lowest denial rate at .8 percent.

To obtain a CPL in the state of Michigan there is a list of requirements that must first be met. These requirements, according to the state of Michigan, include:

  • Being at least 21 years of age;
  • Michigan residency for at least 6 months prior to application;
  • Successful completion of a pistol safety training course;
  • No felony convictions;
  • No convictions of specific misdemeanors (including domestic violence);
  • No personal protection orders filed against the applicant;
  • No diagnosed mental illnesses at the time of the application

For a complete list of requirements, visit this site.

CPL Licenses Denied

As seen above, in 2013, Wayne County had the highest CPL denial rate in the region at 4.5 percent while St. Clair County had the lowest denial rate at .8 percent. While there is no specific reason given for Wayne County’s rate of CPL denials, we do know that in 2012 Wayne County had the highest probation, incarceration, and prison rates in the seven-county region. A person will be denied a CPL if they have a felony or certain misdemeanors.


Monroe County had highest rate of heroin deaths in 2012

Drug overdose death rates have risen steadily since 1970, increasing fivefold since 1990. According to the Center for Disease Control, the most common drugs associated with these deaths are heroin, cocaine and opioid painkillers. Of the three, heroin causes the highest number of deaths in Southeast Michigan, according to the Center for Disease Control.

[Footnote: From CDC: http://www.cdc.gov/homeandrecreationalsafety/pdf/poison-issue-brief.pdf ]

Slide03Slide04

While Wayne County had the highest number of heroin deaths recorded in 2012 (62), when adjusted for population Macomb and Monroe counties had the highest rates (rates were calculated using 2012 population estimates from the American Community Survey).

Heroin is inextricably linked to opioid use, as many heroin users start with abusing opioid prescriptions and then graduate to illicit drugs. In the last 20 years, there has been a tenfold increase in the medical use of opioid painkillers, and with this expansion, there has been an increasing rate of opioid overdoses. In Southeast Michigan, Wayne County had the highest number of opioid deaths and Monroe County had the highest rate.

[From CDC: http://www.cdc.gov/mmwr/preview/mmwrhtml/mm6339a1.htm

From CDC: http://www.cdc.gov/homeandrecreationalsafety/pdf/poison-issue-brief.pdf]

Slide06Slide07

In the mid-2000s, a number of policies were enacted throughout the United States aimed at decreasing opioid misuse. Michigan created a law in 2010 to discourage the practice of “doctor shopping” in order to obtain prescription drugs, while some drugs, like OxyContin, were retooled to deter abuse by making them more difficult to crush. Since the mid-2000s, heroin death rates have increased dramatically.

[From State of Michigan: http://www.nascsa.org/news/midrshopperlaw12.10.pdf

New England Journal of Medicine: http://www.nejm.org/doi/full/10.1056/NEJMc1204141]

Slide09Slide10

While the trends for the opiate death rates are sporadic, this is likely due to the low number of deaths recorded during the time period, where a single instance can cause a huge uptick. However, there were visible upward trends in Wayne, Macomb and Monroe counties, with smaller upward trends in Washtenaw and St. Clair counties.

The heroin trends, however, are more pronounced, with a clear increase occurring between 2005 and 2012. One interesting point of note is that although Wayne County had the highest number of heroin deaths its rates generally remained consistent. Macomb, Monroe, and St. Clair counties, on the other hand, start the millennium off with generally low rates that noticeably spiked, and continued to remain high. However, for both heroin and opiate deaths Macomb County decreased from 2011-2012.

From 2000-2012, heroin accounted for 1,764 deaths in the Southeast Michigan area, opiates accounted for 534, and cocaine accounted for 500. Wayne County had the highest number of cocaine related deaths in 2012, with 39. However, when adjusted for population, St. Clair County had the highest rate, followed closely by Wayne, Macomb and Monroe counties.

Slide12Slide13

One item of note is that across all drugs, Oakland County consistently had the lowest overdose rates. Further research as to why that is may be useful. Polices that have been suggested to reduce overdose deaths include enhanced use of antidotes like naxalone, better access to treatment programs, and Good Samaritan 911 laws (where people reporting overdoses are given immunity), among others, although the effects of these programs have yet to be adequately studied.

Footnotes:


Wayne County has highest rate of reported domestic violence incidents in Southeastern Michigan

According to the Michigan State Police, in every county in the region in 2013 the percentage of reported female victims was higher than the percentage of reported male victims. One reason for this is because men and boys are less likely to report domestic violence. Wayne County had the highest percentage of female victims in the region at 75.7%, along with the highest rate of domestic violence incidents.

In Southeastern Michigan, the most common relationship a domestic violence victim had with their abuser was being their was their boyfriend or girlfriend; in some cases the relationship also involved living together. Although this was the most common relationship, it does not discount the victims who experienced abuse from their spouse, child, sibling, parent, grandparent or grandchild. Domestic violence victims tend to have long-term relationships with their abusers.

The information described above and throughout this post is from the annual report the Michigan State Police (MSP) releases, detailing the number of domestic violence incidents by county. According to the MSP, domestic violence is “the occurrence of any of the following acts by a person that is not an act of self-defense: causing or attempting to cause physical or mental harm to a family or household member; placing a family or household member in fear of physical or mental harm; causing or attempting to cause a family or household member to engage in involuntary sexual activity by force, threat of force, or duress; and/or engaging in activity toward a family or household member that would cause a reasonable person to feel terrorized, frightened, intimidated, harassed, or molested.”

According to the Michigan State Police, “the term domestic violence is a pattern of learned behavior in which one person uses physical, sexual, and emotional abuse to control another person. Domestic violence can occur within relationships between spouses or former spouses, dating or formerly dating couples, individuals with a child in common, or residents or former residents of a common household.”

  • Male Victims of Violence. National Coalition Against Domestic Violence. Retrieved from: http://www.ncadv.org/files/MaleVictims.pdf

Slide03Slide04

In 2013, Wayne County had the highest rate of domestic violence incidents in the seven county region at 1,349.5 per 100,000 residents. The other two counties in the region where the rate of domestic violence incidents was above 1,000 per 100,000 residents were Monroe (1,117) and St. Clair (1,026.7). Livingston County had the lowest rate of domestic violence incidents in 2013 at 324.9 per 100,000 residents.

The rates were calculated using the number of reported domestic violence incidents, according to the Michigan State Police, multiplying that number by 100,000 and then dividing it by the 2013 county population estimates from the American Community Survey.

In addition to having the highest rate of domestic violence incidents, Wayne County also had the highest number of reported domestic violence incidents in the region in 2013: 26,521. Monroe County had the second highest number of reported incidents with 1,698. Livingston County had the lowest number of reported domestic violence incidents at 588.

Slide06Slide07

When examining the reported domestic violence incidents by the gender of reported victims, in 2013, Wayne County had the highest percentage of female victims at 75.7 percent, while Monroe County had the highest percentage of male victims at 32.2 percent. Subsequently, this means Wayne County had the lowest percentage of male victims at 24.2 percent and Monroe County had the highest at 32.2 percent. Livingston County had the second highest percentage of male victims at 31.8 percent. Monroe and Livingston counties were the only two in the region where the total percentage of reported female victims was under 90 percent.

Slide09

The MSP break down victim-to-offender relationships into 20 categories. Above are the top five most occurring categories of victim-to-offender relationships in 2013 in the region, according to the MSP. For the boyfriend/girlfriend category and ex-boyfriend/girlfriend category this includes couples who currently or did live together and homosexual couples.

Of all the types of victim-to-offender relationships that existed in reported domestic violence incidents in 2013, the most common in all seven counties was a boyfriend/girlfriend relationship. In Wayne County, the boyfriend/girlfriend category represented 8,498 of the total 27,297 reported relationships, or 31.1 percent, and the ex category accounted for 4,570 of the total reported relationships, or 16.7 percent. Washtenaw County had the second highest percentage of boyfriend/girlfriend victim-to-offender relationships with 805 of the 2,740, 29.4 percent, representing this category. Monroe County had the lowest percentage of boyfriend/girlfriend victim-to-victim relationships at 21.4 percent; this percentage is reflective of the 374 of the 1,745 reported boyfriend/girlfriend relationships.

When not comparing percentages, Livingston County had the overall lowest number of boyfriend/girlfriend victim-to-offender relationships at 138. There were 603 total reported relationship making the boyfriend/girlfriend victim-to-offender relationships equal 22.9 percent of the total reported relationships.

Other relationships the MSP categorized, aside from the ones represented in the chart above, include: grandparents, grandchildren, parents, step-parents, children and siblings, ex-spouses, and common-law spouses.

Note that the number of victim-offender relationships in the chart above is not equal to the number of victims shown in a prior map ,because there were incidents where there were several offenses, but only one offender, according to the Michigan State Police.

Detroit News deems Detroit as America’s deadliest city for children

According to a study published by the Detroit News, in 2010 the death rate for Detroit children 18 years and under was 120 per 100,000 residents. This was the highest rate in the country; Detroit was also the only city where the rate was over 100 children per 100,000 residents. Through the News’ findings it was determined the city is dangerous for children because of prematurity and violence. To read the study click here. To see our past coverage on infant mortality rates click here.

Detroit’s police force above 3 officers per 1,000 residents

In the following post, we will examine the number of sworn officers-which includes police officers, sheriff’s deputies and public safety officers-per 1,000 residents in the seven county region of Southeastern Michigan. As can be seen in the below maps, there are several municipalities that do not have their own police force. These are either patrolled by the county sheriff’s department or have a public safety department, which is comprised of both police and fire personnel.

The maps and graph below both show that the City of Detroit had one of the highest number of sworn officer per 1,000 residents of municipalities in the region. According to a local law enforcement chief, who serves on the Southeast Michigan Association of Police Chiefs, it is unofficially recommended there should be a minimum of one sworn police officer per 1,000 residents in municipalities.

The above map shows there is less than one sheriff’s deputy per 1,000 residents in every county in Southeastern Michigan. These figures were determined by taking the total number of sheriff’s deputies in each county department and dividing it by the total population of each county; these results were then multiplied by 1,000.

Oakland and St. Clair counties had the highest rates at .56 and .53 per 1,000 residents, respectively.

While no county in the region holds up to the one sworn officer per 1,000 residents standards, it should be noted that many municipalities within each county either have their own police department or pay the sheriff’s department for coverage. The county sheriff’s departments are required to cover areas with no police coverage.

The above two maps show the number of local law enforcement officers per 1,000 residents in 2013. The City of Detroit was one of 104 municipalities (out of 123) in the seven-county region to have more than one officer per 1,000 residents. In 2013 there were about 3.7 officers per 1,000 Detroit residents.

The Lake Angelus Police Department had the highest rate at about 43 officers per 1,000 residents. However, this small lakeside community only had 298 full-time residents with 13 total sworn officers. Aside from this anomaly, Lake Orion had the highest rate in 2013 with a rate of 5 sworn officers per 1,000 residents.

Within the seven county region, areas such as South Rockwood (6.3) and Yale (5.7) had well above the suggested number of officers per 1,000 residents, assuming the 1 per 1,000 is an appropriate benchmark.

Of six of the largest communities in the in Tri-County region, Detroit has consistently had the highest number of sworn officers per 1,000 residents since 2005, according to FBI data. The rate of officers in this time ranged from 3.2 to about 3.9.

In January of 2013 Interim Police Chief Chester Logan stated he was skeptical about releasing, then current, officer numbers, according to an MLive article. In the same article, Logan also said the city had 40 percent fewer officers at the beginning of 2013 than 10 years prior. While this statistic has since been widely used throughout the media, it also caused some to dig deeper into the operations of the department.

In an August 2013 article produced by the Mackinac Center for Public Policy, confusion over the deployment of Detroit’s patrol officers were brought to light. For example, city officials were quoted in August of 2013 as saying 33 percent of the entire department in 2012 were involved in policing and the rest performed administrative functions. Police officials were quoted, however, as saying that 68 percent of the department was involved in policing in 2012.A report conducted by the Emergency Manager’s Office in the summer of 2013 concluded the discrepancy could not be resolved, according to the article.

While the discrepancy over the use of police has not been resolved, it should be noted the Detroit Police Department has benefited from several grants in recent years. For example, in September 2013 the federal government announced it was providing the City of Detroit with $1.8 million to help pay for 10 police officers. Other grants awarded to the city helped with purchasing new technology for the police department and violence prevention programs.

In 2011, all the above police departments experienced a decrease in the rate of officers per 1,000 residents, with the exception of Detroit. In 2010 the City of Detroit had 3.2 officers per 1,000 residents and in 2011 it had 3.8. Detroit’s rate increase though was not reflective of an increase in the number of officers, but a decline in the population. This is true for all police departments, except for Warren, from 2010 to 2013 in the above chart.

Since 2011, Warren and Livonia have experienced a rate increase. The two cities have been able to sustain their police forces, and increase their officer to population ratio, through increased taxes and department reorganizations. In August of 2012 Warren voters approved a police and fire service millage. Also in 2012 the City of Livonia continued to reorganize its police department, which brought in additional non-officers to perform administrative duties so more patrol officers could be on the street.

Sterling Heights (data wasn’t available for 2005 and 2006) had the lowest rates, ranging from about 1.1 to 1.3. Although Sterling Heights began to lose officers when the recession began in 2008, because property values were declining, residents approved a millage in 2013 to support the police and fire departments. This millage approval allowed the Sterling Heights Police Department to keep 45 officers on staff that were initially slated to be laid off.

Motor vehicle theft increases while overall property crime rate declines

In addition to violent crimes, the FBI also tracks property crimes on an annual basis. This post shows how property crimes have decreased in both Detroit and the State of Michigan during 2012.  Not only have the overall property crime rates decreased, but so have the burglary and larceny-theft rates. Motor vehicle theft on the hand experienced an increase from 2011 to 2012 for the City of Detroit.

According to the FBI, property crime “includes the offenses of burglary, larceny-theft, motor vehicle theft, and arson.  The object of the theft-type offenses is the taking of money or property, but there is no force or threat of force against the victims.”

There was a decrease in the reported property crime rate for both Detroit and Michigan from 2011 to 2012. In 2012, Detroit’s property crime rate was reported at 5,792 compared to 6,143.5 in 2011. Michigan’s property crime rate was reported at 2,530 in 2012, down from 2,621.1 in 2011.

According to the FBI burglary is defined as, “the unlawful entry of a structure to commit a felony or theft.  To classify an offense as a burglary, the use of force to gain entry need not have occurred.”

In 2012, both the City of Detroit and the State of Michigan followed similar trends of experiencing a decrease in the burglary rate. In 2012, Detroit’s burglary rate was 2,097.5 compared to 2,242.2 in 2011. Michigan’s burglary rate was 664.4 in 2012 compared to 725 in 2011. Note the increase in the rate with the worsening economic climate after 2005, followed by a decline as the economy improved after 2011.

According to the FBI, larceny theft is defined as “the unlawful taking, carrying, leading, or riding away of property from the possession or constructive possession of another.”

In 2012, the larceny rate for Detroit was 2,228.3 and the state’s rate was 1,612; both rates have seen significant declines since 1992.

According to the FBI, motor vehicle theft is defined as “the theft or attempted theft of a motor vehicle.”

While the motor vehicle theft rate experienced a decline from 2006 to 2009 it has since increased. In 2012 the motor vehicle theft rate in the City of Detroit was 1,626 and in 2011 it was reported to be 1,594 per 100,000 residents.

The State of Michigan has experienced a steady decline in its motor vehicle theft rates since 2006 (496.6). In 2012 the rate was 157.2.

The above chart shows the rate of criminal offenses (per 100,000 people) reported in 2012 for the property crimes addressed in this post for the City of Detroit and the next four most populous cities that are part of the Detroit Metropolitan Statistical Area (MSA). Of the five communities, Detroit had the highest rate of offenses reported for all of the crimes, with the exception of larceny. Dearborn has the highest larceny rate in 2012.

Number of gun permits issued in Metro-Detroit area increasing

In the state of Michigan, residents age 18 and older are legally allowed to purchase a pistol(1) with a purchase license from a private seller. At the age of 21, residents are allowed to purchase a firearm(2) from a Federal Firearms License dealer. However, no license is required to purchase a long gun(3) but the purchaser must be 18 years of age or older and have no criminal or mental illness health history.

Despite the decline in population in the Metro-Detroit area, the number of total gun permits and concealed pistol permits issued has been increasing substantially. This increase began in 2005 for Detroit and Wayne County and in 2007 for Oakland and Macomb counties.

(1)A pistol is a handgun where the chamber is integrated into the barrel.

(2)A firearm which is a portable, barreled weapon that launches one or more projectiles.

(3)A long gun is in the category of firearms where the barrel is longer and the gun itself is meant to braced against the shoulder while firing.

Slide03

The above chart shows the rate, per 100,000 residents, of the total number of gun permits issued in 2012. This rate is based on the December population estimates released from the Southeastern Michigan Council of Governments. As can be seen, Macomb County had the highest rate of gun permits issued in 2012 at 3,189 and Detroit had the lowest at 1,227.

Slide05

The total number of gun permits issued in the City of Detroit began to increase in 2005 when 3,486 permits were issued. By 2012, 8,406 permits were issued despite the city’s declining population. By the end of April in 2013, 3,076 permits were issued, according to information provided by Michigan State Police.

Like the City of Detroit, the total number of gun permits issued in Wayne County also began to increase to in 2005. In that year 16,212 permits were issued and in 2012, 41,522 were issued, again in the context of a declining population. In 2012, 20 percent of the gun permits issued in Wayne County were issued in Detroit. By the end of April in 2013, 18,034 permits were issued, according to the Michigan State Police.

Since 1990, the total number of gun permits issued in Macomb County has consistently been below the number of permits issued in Wayne County. However, while the population in Wayne County has been declining, Macomb County’s population has been increasing, as have the total number of gun permits issued. Still the rate of gun permits in Macomb is much higher than the other counties. The number of permits issued in Macomb County began to increase in 2007.  In that year, 11,564 were issued and in 2012, 27,906 were issued. By the end of April of 2013, 12,973 gun permits were issued.

The total number of gun permits issued in Oakland County since 1990 has also been below the number of permits issued in Wayne County. However, more permits have been issued in Oakland County than Macomb County, with the exception of 1997 and 1998. Along with the increasing number of gun permits issued in Oakland County, the population has also been increasing. The number of permits issued in Oakland County began to increase in 2007; that year, 15,211 were issued. By 2012, 342,624 were issued and by the end of April in 2013, 16,467 were been issued, according to the Michigan State Police.

Slide13

To obtain a concealed pistol permit in the state of Michigan, one must be at least 21 years old and have been a Michigan resident for at least six months prior to applying for the license. The applicant must also have also completed a pistol training course and not have been convicted of a felony, a violent crime, or certain misdemeanors. An applicant must also be mentally stable, which means not having been committed for mental illness, being diagnosed with a mental illness or been charged with a crime where mental illness was deemed a factor. Exact details on the type of misdemeanors an applicant cannot have been convicted of within a certain time frame, along with other specifics on applying for a permit, can be found at Michigan.gov.

When a person obtains a concealed pistol permit, he or she is still not allowed to carry the weapon in federal buildings, schools, daycare centers, child-related centers and agencies, hospitals, dormitories, religious centers, sports arenas, bars, and dormitories and classrooms of colleges and universities.

While Macomb County had the highest rate of total gun permits issued in 2012, it had the lowest rate, per 100,000 residents, of concealed pistol permits issued.  The rate at which concealed pistol permits were issued in 2012 for Macomb County was 988 per 100,000 residents. For Oakland County the rate was 1,012 and for Wayne County it was 1,017.

The number of concealed pistol permits issued for the City of Detroit was not available on the Michigan State Police website.

Slide15

The total number of concealed pistol permits issued over the years has followed the same increasing trend as the number of gun permits.  The data on the number of concealed pistol permits issued is tracked annually from July 1 to June 30. Overall, there has been a higher number of concealed pistol permits issued in Wayne County than Oakland and Macomb counties. In 2012, 18,195 were issued in Wayne County, 12,407 were issued in Oakland County and 8,395 were issued in Macomb County.

Detroit among the most dangerous and segregated cities

In a recent study released by NeighborhoodScout four Detroit neighborhoods were considered to be among the most dangerous in the United States. Three Detroit neighborhoods-West Chicago and Livernois Avenue; Mack Avenue and Helen Street; and Gratiot Avenue and Rosemary-were considered the three worst. The Detroit neighborhood encompassed by Wyoming Street and Orangelawn Street was ranked number eight.

These rankings were devised through FBI data on violent crimes (murder, forcible rape, armed robbery, and aggravated assault) and exclusive data developed by NeighborhoodScout, according to the website.

To see the rankings and a map of the neighborhoods click here.

In addition the dangerous neighborhood rankings, Detroit was also categorized as the most segregated city by Business Insider. Census data from 2010 was examined for this article by a two professors, John Logan and Brian Stults, and a dot map was created to show where certain races live in and around Detroit. The data shows that Detroit’s inner city is almost exclusively black, with a small Hispanic population, while the outlying suburbs has a highly concentrated white population.

This map, and maps of other segregated cities in the U.S. can be viewed here.

Causes of deaths for the Southeastern Michigan area:Homicide, Unintentional Injury & Suicide

This post shows the homicide, unintentional injury, and suicide death rates for the Southeastern Michigan area and the Metro-Detroit area from 1980 to 2010. The Southeastern Michigan area is comprised of Livingston, Macomb, Monroe, Oakland, St. Clair, Washtenaw, and Wayne counties. The Metro-Detroit area consists of Wayne, Macomb, and Oakland counties. While the City of Detroit data is included with the Wayne County data, we also examine just Detroit data in these charts.

The rates for the seven-county region were calculated on a five year rolling average while the rates for the Metro-Detroit area are presented on an annual basis. The Michigan Department of Community Health provided all information, and all rates are per 1,000. Sometimes the series are interrupted because of gaps in the data.

In the following charts you will see:

•Detroit and Wayne County have the highest homicide rate. The rates for these two areas have been increasing in recent years but are not near their peaks.
•The unintentional death rate for those under 25 has been decreasing.
•The suicide rate for those under 25 has also been decreasing, until a recent increasing trend, but the rate for those 25-74 is increasing in some areas.
homicide1
homicide2
homicide3
homicide4
homicide5

The homicide rate, when examined at both the five year rolling average for the seven-county region and the annual rate for the tri-county region, is highest in Detroit and Wayne County in all age groups. In Detroit and Wayne County the rates began to decrease from their peaks in the late-80s to mid-90s. However, for those under 25 in Detroit and Wayne County, the homicide rate began to increase again in recent years when looking at the five year rolling average (as displayed in the chart with data from Southeastern Michigan). When looking at the other counties across age groups, the homicide rate has remained fairly low and stable.

There was only enough information on the homicide rate for those 75 and older for the City of Detroit and Wayne County because the number of murders in the other counties was either so low, or non-existent, that a rate could be determined. In the information that was available, Detroit consistently had higher rates.

injury1

injury2

injury3

injury5

injury5

injury6

According to the Center for Disease Control, unintentional injuries are unplanned injuries that occur suddenly; they are typically associated with crashes, falls, fires, burns, drowning, poisoning, and aspirations. The death rate associated with unintentional injuries was highest for those 75 and older, although rates for the seven-county region have fluctuated across time. The largest increase can be seen in the Oakland County annual rate data; the annual unintentional injury death rate increased from a series low of 35.6 in 1981 to a peak 177.3 in 2010, with a great deal of variation.

Also, the graphs for both for the Southeastern Michigan area and the Metro-Detroit area show an overall decreasing trend in deaths related to unintentional injuries for those under the age of 25 from 1980 to early-2000s.

The City of Detroit had the highest death rates associated with unintentional injuries for the 25-74 age group. Since the early-2000s, there appears to be an increasing trend of deaths related to unintentional injuries for the 25-74 age groups for all counties in the Southeastern Michigan area, with the exception of Oakland and Washtenaw counties.

suicide1

suicide2

suicide3

suicide4

In Southeastern Michigan, the suicide rate has been higher for the 25-74 age group compared to those under 25 from 1980 to 2010. St. Clair County had the highest suicide rate for those 25-74 years old, peaking at 21.5 for the 2006-10 time frame. The rates for those 25-74 years old for St. Clair County and Macomb County have been increasing since the mid-90s, when looking at the five-year averages. When just looking at the tri-county area, it can be seen the suicide rate began to increase in the mid-2000s for the 25-74 age group. It did start to decrease in 2009 though.

For the under 25 age group, St. Clair County had the overall highest rate at 9.1, both in the 1989-1992 and 1990-93 time frames. Overall, data shows there has been a slight decreasing trend in suicides in this age group from the late-80s to the early-2000s. Since then, there appears to be an increasing trend, except in Oakland County. Monroe and Livingston were also showing declines, but their data appears to be missing for recent years.