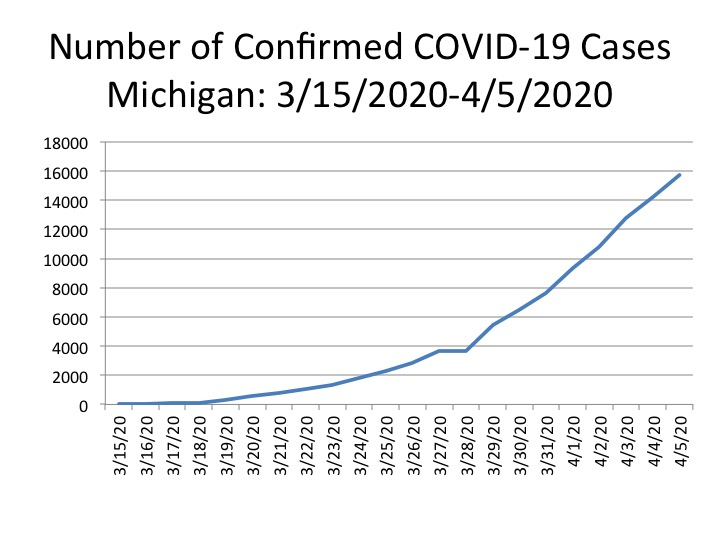
The number of confirmed cases and deaths related to coronavirus-19 (COVID-19) has been on the rise since early March. As of Sunday evening, April 5, there were 15,718 confirmed cases in the State of Michigan and 617 deaths, according to data from the State. Gov. Gretchen Whitmer’s office anticipates the peak of the COVID-19 outbreak to be in late April or early May while Dr. Deborah Birx of the White House’s COVID-19 task force said that the peak in Michigan, and more specifically Wayne and Oakland counties, should come within about the next week. One thing that the data certainly does show though is that the numbers continue to rise, and Wayne and Oakland counties have the highest number of cases (7,518 and 3,035 respectively as of April 5, 2020).
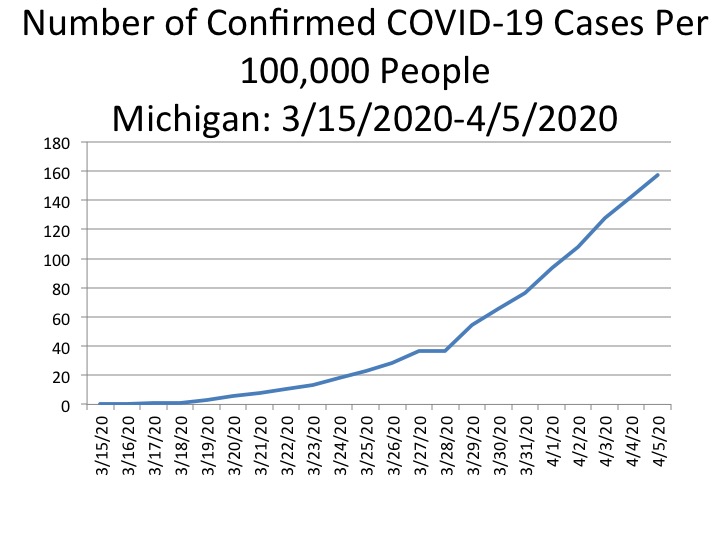
The first chart below shows the raw number of confirmed cases throughout all of Michigan, and as has been noted, the continued increase in the number of cases from day-to-day. The second chart below shows the number of confirmed cases per 100,000 people; Michigan has a population of 9,986,857. This chart follows the same trend as the first chart; the highest number of cases per 100,000 people was April 5 with 157.4 cases per 100,000 people.
The data for all the charts in this post is from covidtracking.com, which tracks day-to-day cases numbers, deaths and other related COVID-19 data for all states. Day-to-day data for Michigan and its counties is not readily available, only the most recent data is published on a daily basis. Drawing Detroit has started tracking the day-to-day data.
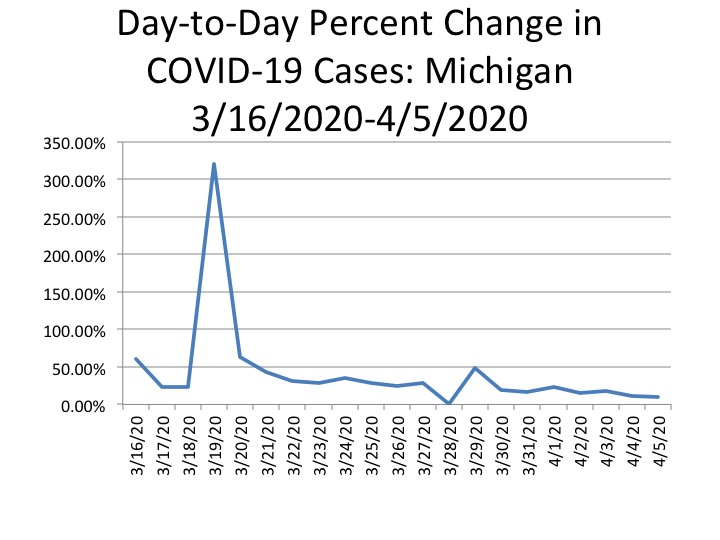
The third chart below shows the percent change in confirmed COVID-19 cases from day-to-day. The percent change continues to be positive, however, that percentage has been decreasing since April 3. On April 3, the percent change in the confirmed number of cases between that day and the previous day (April 2) was 18 percent. Since then the percent change from the day-to-day number of confirmed cases was 11.6 percent (April 4) and 10.5 percent (April 5). Note that as the base rises, it is mathematically difficult to maintain the same rate of increase. On April 5, the most recent date for which data was available, there were 15,718 confirmed cases in the state, an increase of 1,493 cases from the previous day. April 5 had the lowest percent change in confirmed cases thus far while March 19 had the highest percent change at 320 percent. On March 18 there were 80 confirmed COVID-19 cases and on March 19 there were 336 cases. It should be noted that on March 28 the same number of cases and deaths were reported for the State of Michigan.
The second chart below shows the percent change in confirmed COVID-19 cases from day-to-day. The percent change continues to be positive, however, that percentage has been decreasing since April 3. On April 3, the percent change in the confirmed number of cases between that day and the previous day (April 2) was 18 percent. Since then the percent change from the day-to-day number of confirmed cases was 11.6 percent (April 4) and 10.5 percent (April 5). Note that as the base rises, it is mathematically difficult to maintain the same rate of increase. On April 5, the most recent date for which data was available, there were 15,718 confirmed cases in the state, an increase of 1,493 cases from the previous day. April 5 had the lowest percent change in confirmed cases thus far while March 19 had the highest percent change at 320 percent. On March 18 there were 80 confirmed COVID-19 cases and on March 19 there were 336 cases. It should be noted that on March 28 the same number of cases and deaths were reported for the State of Michigan.
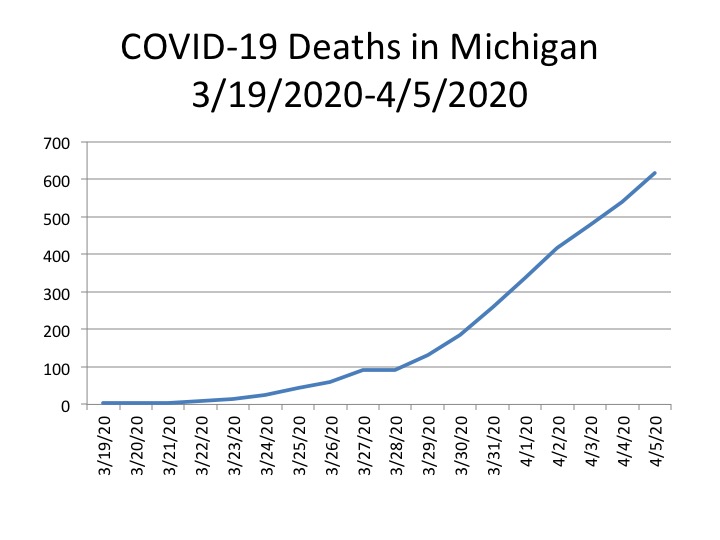
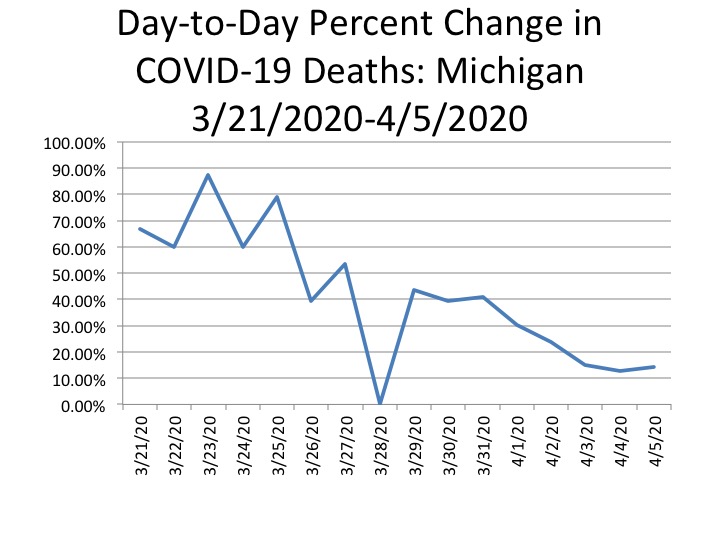

Although the number of cases continues to climb, and is expected to for at least another week, the slowly decreasing percent change in the day-to-day confirmed cases could indicate that the spread of COVID-19 might be slowing down. Data on total cases is, however, dependent on the number of people tested, which depends on the number of tests available and the number of people able to be tested. Both of these remain limited. Given this, the data on deaths seems the more reliable indicator. Those data give a modicum of hope, but no certainty.
Next week we will look at similar data at the county level for Southeastern Michigan and the City of Detroit.