New information on vacancies in Detroit provides a mixed picture. There were 1,490 fewer vacant Detroit properties of all kinds between September 2018 and September 2019, according to the U.S. Postal Service. However, between June 2019 and September 2019 the number of residential vacancies increased by 61 (discussed below). Overall in the month of September of 2019 there were 82,738 vacant addresses.
Although there was a decrease in the number of vacant addresses, the percentage of vacant addresses in Detroit has remained between 21 and 22 percent since June of 2011. Vacancy rates reached 20 percent in December of 2010. The peak vacancy rate in Detroit, according to U.S. Postal Service data, was in March of 2015 when it was 22.8 percent; at that time it was equivalent to 88,017 vacant addresses.
Looking backward, (we have USPS data back through 2005) the lowest vacancy rate in Detroit was in December of 2005. At that point, the rate was 10.03 percent, and that was equivalent to 38,981 vacant properties. So, overall we witnessed more than a doubling of vacancies with a gradual decline to 82,738 from a peak of 88,017.
When examining only residential vacancy rates that rate was 21.34 percent in September of 2019, which was equivalent to 74,818 vacant residential addresses. The residential vacancy rate between September of 2019 and 2018 decreased by less than 1 percent, and the total number decreased by 2,239 residential addresses. The five-year difference was a decrease of 7,230 residential vacancies. The highest residential vacancy rate was 23.5 percent in March of 2015; the lowest residential vacancy rate was in February of 2008 at 15.8 percent. Following the peak residential vacancy rate in 2015, those numbers have been on the decline.
In addition to these changes, in September of 2019 there was not a change in the number of “no stat” addresses–properties denoted by mail carriers as being either “vacant” or “no-stat.” In September of 2019 the percent of no-stat properties was 6.2 percent. These no-stat properties are ones that carriers on urban routes mark as vacant once no resident has collected mail for 90 days. Addresses in rural areas that appear to be vacant for 90 days are labeled no-stat, as are addresses for properties that are still under construction. So, urban addresses labeled are those a carrier deems as unlikely to be occupied again any time soon. That is, both areas where property is changing to other uses and areas of severe decline may have no-stat addresses.
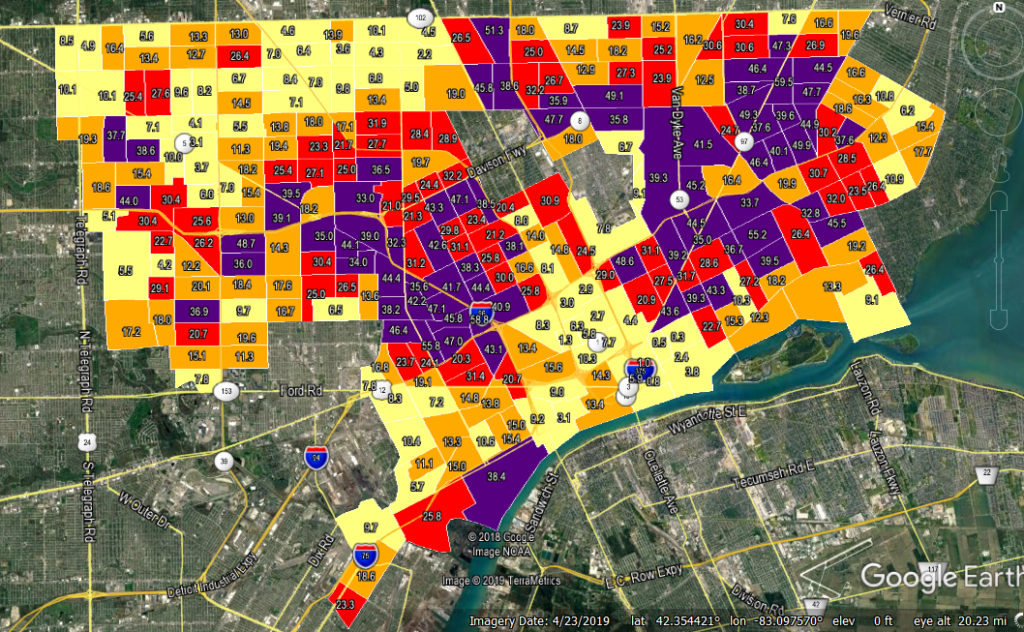
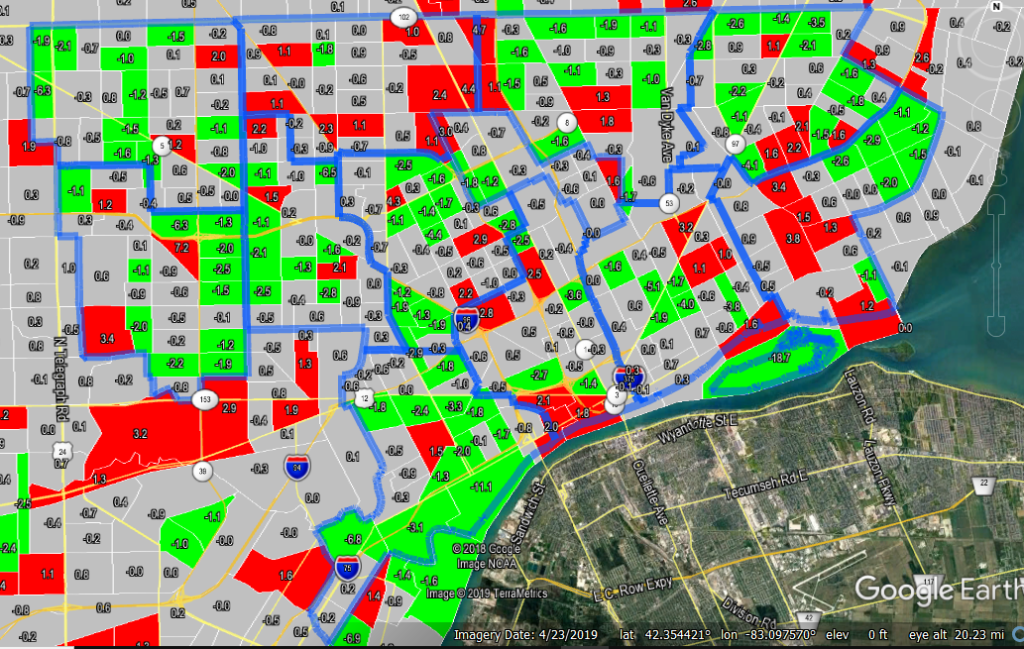
The maps below demonstrate both the overall Detroit address vacancy rates (including residential and business vacancy rates) by Census Tract for September 2019 (first map) and the change in vacancy rates between September 2019 and September 2018 (second map). In total, there were about 65 Census Tracts in Detroit with total vacancy rates above 35 percent. The Census Tract with the highest vacancy rate in September of 2019 was located north of I-94, between there and I-96, with a rate of 55.8 percent. There were two large clusters of Census Tracts with vacancy rates above 35 percent, one cluster was located along I-96 south and west of the Davison Freeway, and the other was located on the eastside of the city along Gratiot Avenue.
While most of the Census Tracts in the City experienced a decrease in the number of vacancies from September 2018 to September 2019, there were about 40 tracts scattered all across the city that had an increase. The Census Tract with the highest increase was located on the City’s far west side and there was an increase of 7.2 percent. The tract with the largest vacancy rate decrease was located in Southwest Detroit and there was a decrease of 11.1 percent.
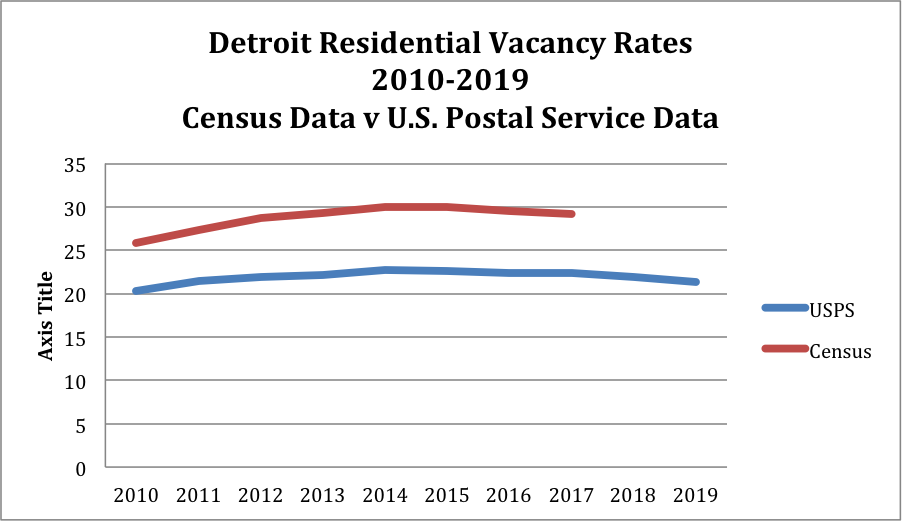
In addition to the U.S. Postal Service tracking vacancy data so does the U.S. Census Bureau. The chart below shows the differences that each agency reports in vacancy rates. The Census Bureau only tracks vacant houses while the U.S. Postal Service tracks residential properties, businesses and total vacancy rates. In the chart below only residential rates are examined. As the data shows, the Census regularly has higher residential vacancy rates as compared to the U.S. Postal Service. The most recent data for the Census data (2017) shows that the City’s residential vacancy rate was 29.2 percent and that was in 2017. The Postal Service’s equivalent rate was 22.4 percent at that time. The Census data is based on a sample of about 72,000 housing units. The U.S. Postal Service data is collected by postal service workers, if a residence is deemed occupied it means it requires mail service. It is deemed vacant if it does not require mail service. One potential reason for the difference in vacancy rates is the fact that the Census data is based on samples while the U.S. Postal Service relies on postal carrier’s actual observations of the properties.