USPS Reports Decreased Vacancy Rates in Detroit

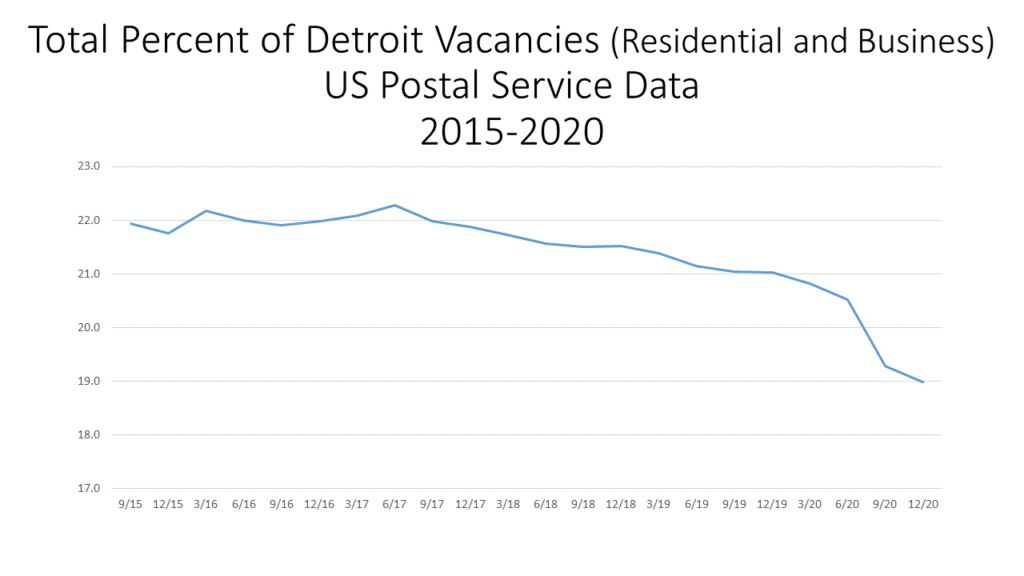
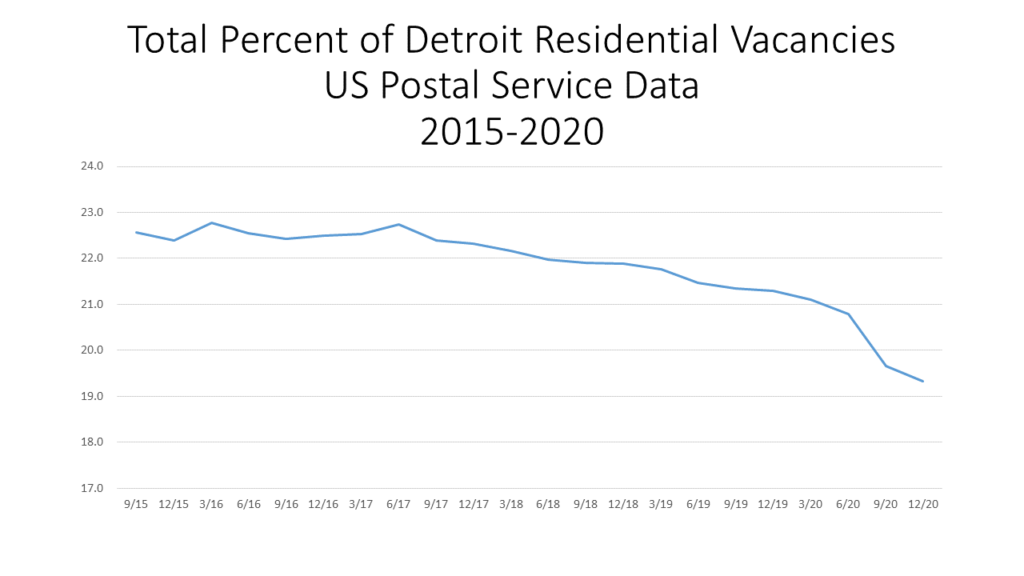
In December of 2020 the US Postal Service reported 74,313 total vacant properties in the City of Detroit, equivalent to a 19 percent vacancy rate. This rate is the lowest report rated since 2015, as can be seen in the first chart below. Additionally in 2020 the Postal Service reported 317,272 occupied addresses.

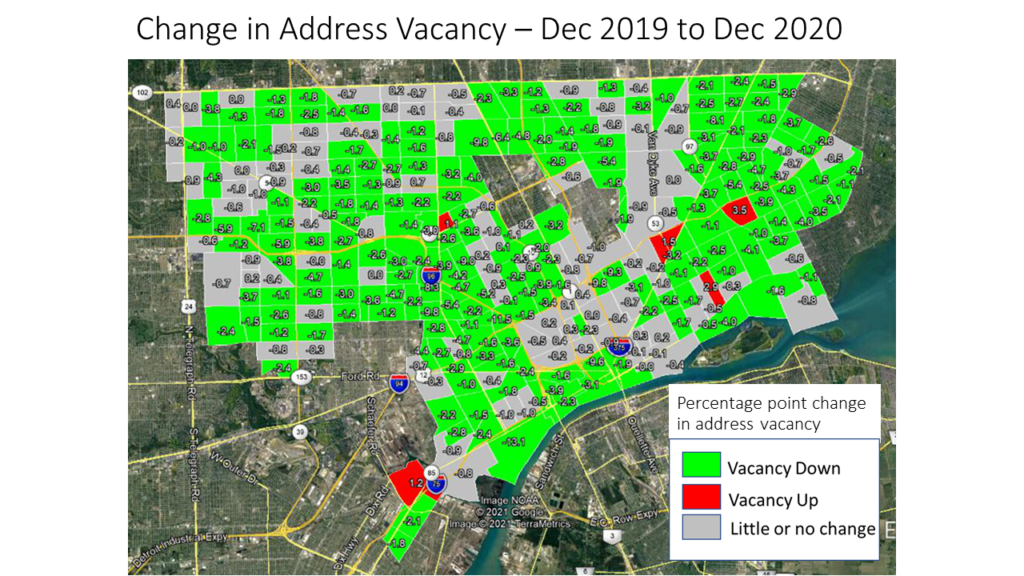
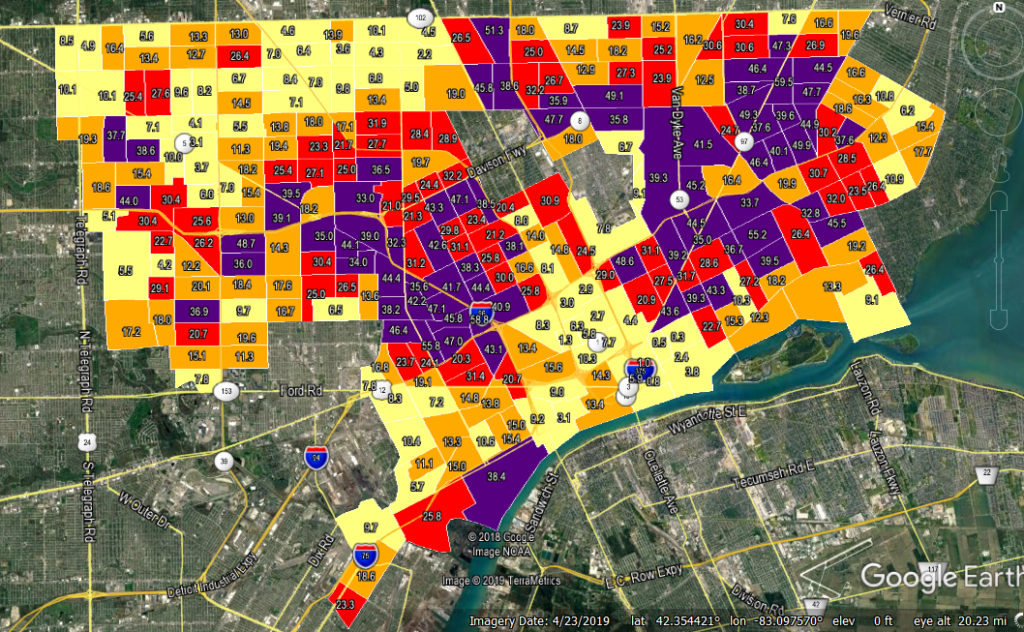
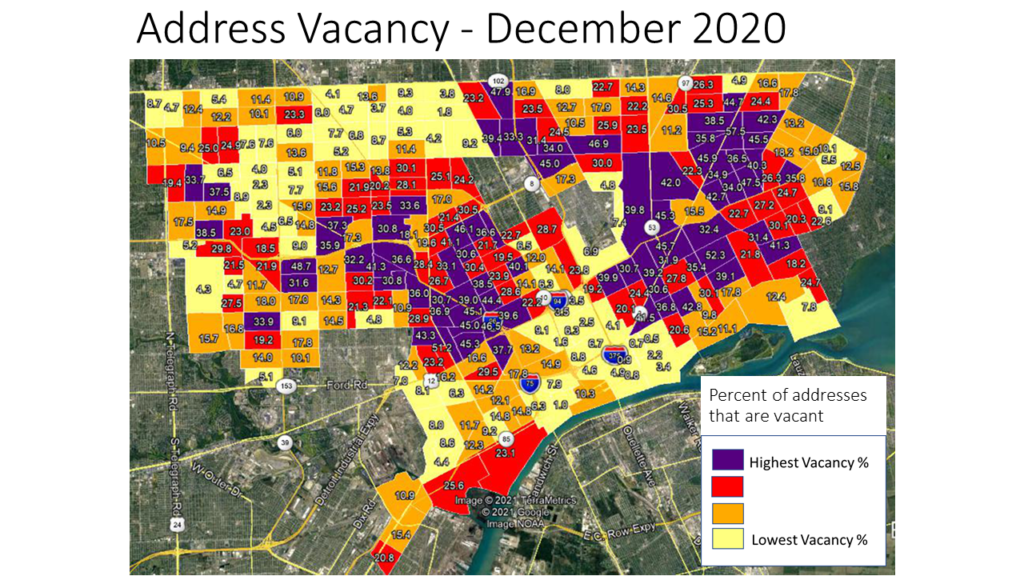
According to the first map below, while the overall vacancy rate in December of 2020 was 19 percent, there were several areas in the City with much higher rates. The highest rates stemmed off of I-96 and Gratiot Avenue in the City of Detroit, with the highest overall rate for a Census Tract being 52.3 percent in the Morningside/Chandler Park area. Conversely, vacancies remained the lowest in the Downtown Detroit area and Green Acres/Pembroke/Bagley areas. High vacancy rates in the City ranged from 31-52.3 percent and low vacancy rates ranged from 1.9 to 9.3 percent. Between September and December of 2020 the vacancy rate decreased by 0.3 percent. Additionally, the vacancy rate had an annual 2 percent decrease plus a 2.8 percent decrease over a five year time period. The second map below shows the long-term trends; all but seven Census Tracts experienced a decrease in vacancy or little to no change between 2019 and 2020. The Chandler Park area had the highest increase in vacancy rates between December 2019 and 2020 at 3.5 percent.

The USPS provides aggregate vacancy and no-stat counts of residential and business addresses that are collected by postal workers and submitted to on a quarterly basis the Department of Housing and Urban Development. While occupancy status is recorded, USPS does not capture any information about the nature of the vacancy or the address itself, other than whether it is a residential or business address. To the USPS, the address is either occupied and requires mail service or is vacant and does not. An address is deemed vacant if it did not collect mail for 90 days or longer. In addition to occupied and vacant addresses there are also “no stat” addresses. A “no stat” address is deemed that if it is under construction and not yet occupied or is in an urban area and identified by a carrier as not likely to be active for some time.
As noted, overall vacancy rates in the City of Detroit have been declining, and this also true at both the residential and business levels. Residential vacancy rates in September of 2015 were 22.6 percent, which was equivalent to 81,666 residential vacancies. By December of 2020 that number of vacancies decreased to 19.3 percent, or 67,442 total vacancies.

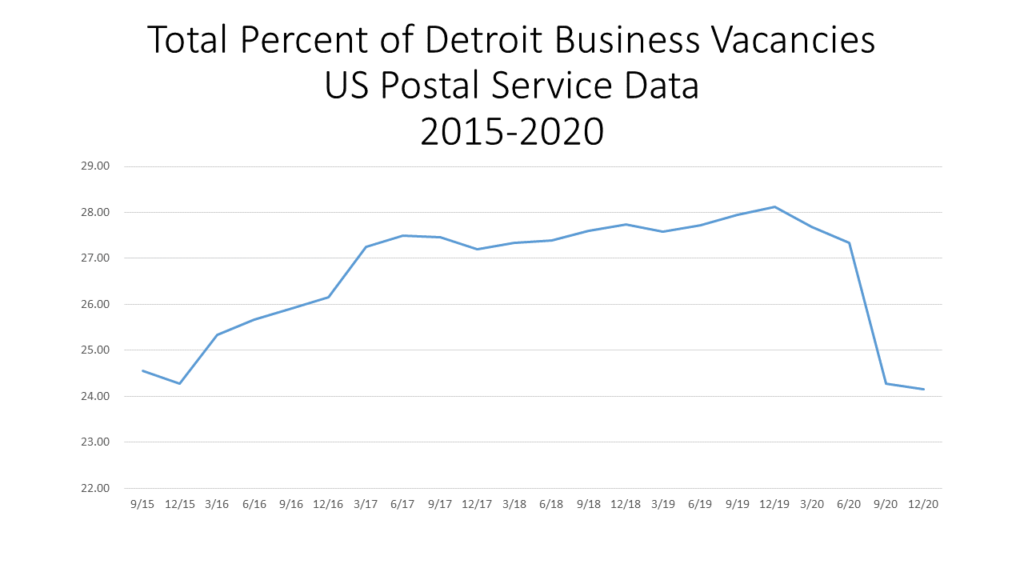
For business vacancies there was a total of  6,871 vacant businesses out of 28,438 total businesses in the City, this was equivalent to 24.2 percent. In September of 2015 the vacancy rate was 24.6 percent for a total of 7,337 vacant businesses out of 29,885.

Examining both charts below we see that there has been a steadier decline in residential vacancy rates than business vacancy rates. Between 2015 and 2019 business vacancies were actually climbing, and reached a high of 28 percent in December of 2018. Then, through the Pandemic declined substantially, though it is not clear why.
According to the USPS there was 27,878 “no stat” addresses reported in Detroit in December of 2020, an increase of 3,884 from the year prior.

Inner-Ring Detroit Suburbs Have Highest Vacancy Rates in 2019

In 2019, Highland Park had the highest vacancy rate in Southeastern Michigan at 34 percent, according to the American Community Survey; the vacancy rate is the percentage of all available units in a rental property, such as a hotel or apartment complex, that are vacant or unoccupied. Clay Township (St. Clair County) had the second highest vacancy rate at 30 percent and Detroit had the third highest rate at 27percent. There were only seven communities in the region with vacancy rates at or above 20 percent; of those communities four were Detroit or an inner-ring suburb (Highland Park, River Rouge and Eastpointe) and the remaining three were outer-ring suburbs (Clay, Burtchville and Lyndon townships). While there were a handful of outer-ring suburbs with high vacancy rates, those with the lowest vacancy rates were all outer-ring suburbs. Orchard Lake Village had the lowest vacancy rate in 2019 at 1.4 percent, followed by Clarkston at 1.6 percent and Plymouth and Augusta townships at 1.8 percent. The inner-ring suburb with the lowest vacancy rate was Southfield Township at 4.1 percent, followed by Allen Park at 4.9 percent. 

In knowing that the Detroit inner-ring suburbs had among the highest vacancy rates in the region, it is not surprising that Wayne County had the highest vacancy rate at the county-level at 15.5 percent. However, St. Clair County had the second highest vacancy rate at 12 percent; St. Clair County is home to the community with the highest vacancy rate (Clay Township). When breaking down the type of vacancies that makeup each county’s overall percentage though Wayne County did not rank the highest amongst any of the categories. The breakdown of vacancy types-housings units for sale, housings units for rent and “other” (described below)-is only available at the county level. So, while we cannot fully understand the specifics of vacancy rates at the municipal level, the county data does give us some insight.

According to the data, Livingston County had the highest percentage of vacant homes for sale at 18 percent, followed by Macomb County at 14 percent and then Wayne County at 10 percent. For rental vacancies, Oakland County had the highest percentage at 31 percent and Macomb County at 26 percent; Wayne County had an 11 percent vacancy rate for rentals. Overall we see that rental units tend to have higher vacancy rates than homes for sale; the rental vacancy rate may grow even higher in areas such as Detroit where demand for rentals is down just as new apartment buildings are opening, according to the Detroit Free Press.

A property is labeled as “other” vacant by the U.S. Census Bureau when it does not fit into one of the categories discussed above. According to the U.S. Census Bureau “other” properties are typically vacant because the owner does not want to rent or sell it; it is being used for storage; the elderly homeowners are living in a nursing home; it’s in an estate settlement; it is being repaired or renovated or it is in foreclosure. According to the data at the County level, St. Clair County had the highest percentage of “other” vacant properties (as described above) at 88 percent, followed by Wayne County at 79 percent. Macomb County had the lowest percentage at 60 percent. This data was only available at the county level.

While the breakdown of vacancy rates is only available at the County level it does shed some light on why certain communities may have some of the highest vacancy rates. For example, we know that communities such as Highland Park and Detroit have higher vacancy rates due houses being abandoned and people leaving those cities for outer-ring suburbs. Furthermore, according to Next Gen City, the highest vacancy rates are in areas that have the highest population of black residents; Detroit and Highland Park have the highest black populations in the State of Michigan. As the COVID-19 pandemic continues to affect the economy it will interesting to see how vacancy rates change in the future.

Detroit Vacancies Decline Over Long-Term, Slow Uptick Recently in Numbers

New information on vacancies in Detroit provides a mixed picture. There were 1,490 fewer vacant Detroit properties of all kinds between September 2018 and September 2019, according to the U.S. Postal Service. However, between June 2019 and September 2019 the number of residential vacancies increased by 61 (discussed below). Overall in the month of September of 2019 there were 82,738 vacant addresses.

Although there was a decrease in the number of vacant addresses, the percentage of vacant addresses in Detroit has remained between 21 and 22 percent since June of 2011. Vacancy rates reached 20 percent in December of 2010. The peak vacancy rate in Detroit, according to U.S. Postal Service data, was in March of 2015 when it was 22.8 percent; at that time it was equivalent to 88,017 vacant addresses.

Looking backward, (we have USPS data back through 2005) the lowest vacancy rate in Detroit was in December of 2005. At that point, the rate was 10.03 percent, and that was equivalent to 38,981 vacant properties. So, overall we witnessed more than a doubling of vacancies with a gradual decline to 82,738 from a peak of 88,017.

When examining only residential vacancy rates that rate was 21.34 percent in September of 2019, which was equivalent to 74,818 vacant residential addresses. The residential vacancy rate between September of 2019 and 2018 decreased by less than 1 percent, and the total number decreased by 2,239 residential addresses. The five-year difference was a decrease of 7,230 residential vacancies. The highest residential vacancy rate was 23.5 percent in March of 2015; the lowest residential vacancy rate was in February of 2008 at 15.8 percent. Following the peak residential vacancy rate in 2015, those numbers have been on the decline.

In addition to these changes, in September of 2019 there was not a change in the number of “no stat” addresses–properties denoted by mail carriers as being either “vacant” or “no-stat.” In September of 2019 the percent of no-stat properties was 6.2 percent.  These no-stat properties are ones that carriers on urban routes mark as vacant once no resident has collected mail for 90 days. Addresses in rural areas that appear to be vacant for 90 days are labeled no-stat, as are addresses for properties that are still under construction. So, urban addresses labeled are those a carrier deems as unlikely to be occupied again any time soon. That is, both areas where property is changing to other uses and areas of severe decline may have no-stat addresses.

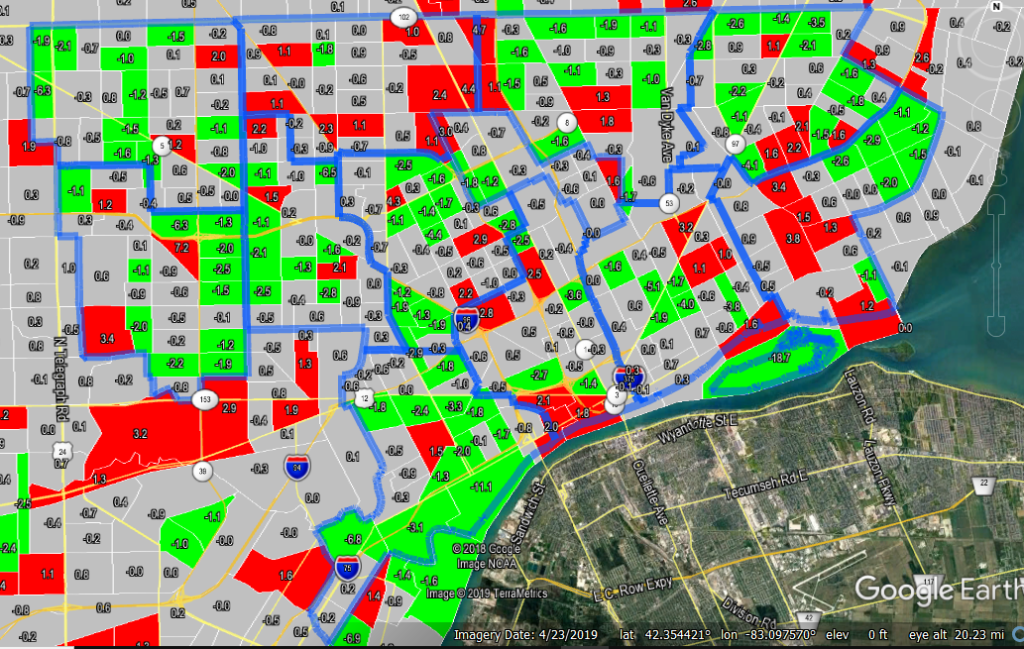
The maps below demonstrate both the overall Detroit address vacancy rates (including residential and business vacancy rates) by Census Tract for September 2019 (first map) and the change in vacancy rates between September 2019 and September 2018 (second map). In total, there were about 65 Census Tracts in Detroit with total vacancy rates above 35 percent. The Census Tract with the highest vacancy rate in September of 2019 was located north of I-94, between there and I-96, with a rate of 55.8 percent. There were two large clusters of Census Tracts with vacancy rates above 35 percent, one cluster was located along I-96 south and west of the Davison Freeway, and the other was located on the eastside of the city along Gratiot Avenue.

While most of the Census Tracts in the City experienced a decrease in the number of vacancies from September 2018 to September 2019, there were about 40 tracts scattered all across the city that had an increase. The Census Tract with the highest increase was located on the City’s far west side and there was an increase of 7.2 percent. The tract with the largest vacancy rate decrease was located in Southwest Detroit and there was a decrease of 11.1 percent.

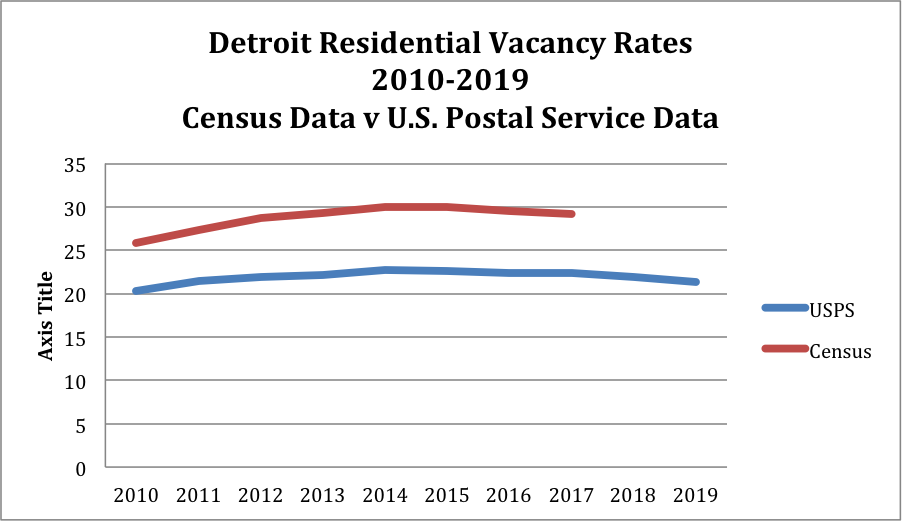
In addition to the U.S. Postal Service tracking vacancy data so does the U.S. Census Bureau. The chart below shows the differences that each agency reports in vacancy rates. The Census Bureau only tracks vacant houses while the U.S. Postal Service tracks residential properties, businesses and total vacancy rates. In the chart below only residential rates are examined. As the data shows, the Census regularly has higher residential vacancy rates as compared to the U.S. Postal Service. The most recent data for the Census data (2017) shows that the City’s residential vacancy rate was 29.2 percent and that was in 2017. The Postal Service’s equivalent rate was 22.4 percent at that time. The Census data is based on a sample of about 72,000 housing units. The U.S. Postal Service data is collected by postal service workers, if a residence is deemed occupied it means it requires mail service.  It is deemed vacant if it does not require mail service. One potential reason for the difference in vacancy rates is the fact that the Census data is based on samples while the U.S. Postal Service relies on postal carrier’s actual observations of the properties. 

Vacancy Rates in Detroit Remain Stagnant

In the City of Detroit in September 2016 the total percentage of vacancies was 21.9 percent, according to the U.S. Postal Service. This vacancy percentage was nearly unchanged from the 22 percent total vacancy rate the U.S. Postal Service reported in June of 2016. Similarly, when looking at the percentage of residential vacancies and business vacancies in the City these too nearly went unchanged between June and September. The U.S. Postal Service reports that the September 2016 residential vacancy rate was 22.4, down 0.1 percent. The September 2016 business vacancy rate was 25.9, up .02 percent from June.

Overall, in the month of September there were 87,762 reported total vacancies, 80,002 of which were residential, 7,670 of which were businesses and 104 of which were considered “other.” Between June and September, the total 0.1 percent vacancy decrease was equivalent to a decrease of 579 vacant addresses; there was a decrease of 641 vacant residential addresses and an increase of 62 vacant business addresses.

The first two maps below show, by Census Tract, the total number of vacancies and the total percentage of vacancies. The Census Tract with the highest number of total vacancies is on the east side, just north of Belle Isle. This Census Tract had 906 vacancies, which was 50.6 percent of the total number of structures in that Census Tract.

As the first map shows, majority of the Census Tracts with vacancies above 400 were located either on the cities east side, or just west of the downtown area of Detroit. When looking at the total percentage of vacancies in Detroit by Census Tract we see there is a slight shift in which Census Tracts have among the highest amount of vacancies in terms of percentage versus total numbers. This is directly related to the total number of structures in each Census Tract. For example, just east of Hamtramck there is a Census Tract with 229 vacant addresses, a number that does not put in amongst the Census Tracts with the highest vacancy numbers. However, these 229 vacant addresses in that Census Tract mean there is a 42.9 percent vacancy rate. Just south of that Census Tract is another where there are 307 vacancies which make up 18 percent of the structures there.

slide4

slide5

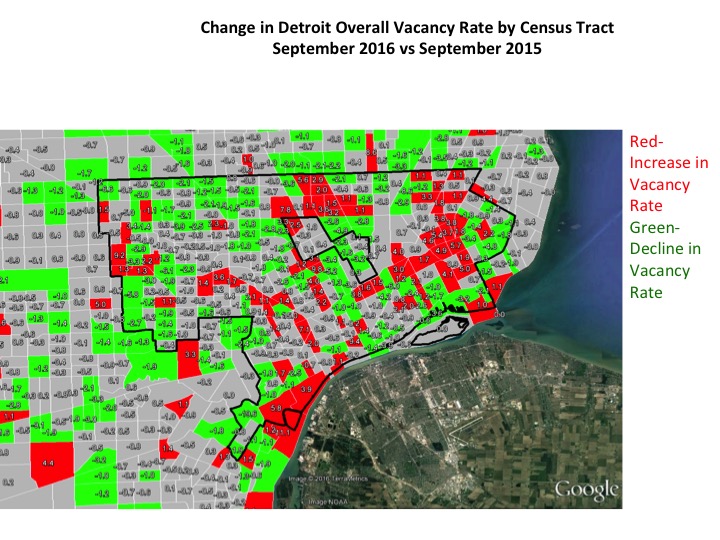
When comparing the total number of vacancies between September 2015 and 2016 we see that there are several Census Tracts that experienced an increase in the total number of vacancies. It was a Census Tract just north of Highland Park that experienced the greatest increase at 7.8 percent. Vacancy increases over the last year occurred the most on the City’s east side, however they were not isolated there.

Overall, while there were Census Tracts with vacancy rate increases there was a total decrease of 5,446 vacant addresses between September 2015 and September 2016.

In addition to these changes, in September of 2016 there was a decline in the number of “no stat” addresses; that number decreased by 2084 in the last year. Mail carriers denote properties as being either “vacant” or “no-stat.” Carriers on urban routes mark a property as vacant once no resident has collected mail for 90 days. Addresses are classified as “no-stat” for a variety of reasons. Addresses in rural areas that appear to be vacant for 90 days are labeled no-stat, as are addresses for properties that are still under construction. Urban addresses are labeled as no-stat when the carrier decides it is unlikely to be occupied again any time soon — meaning that both areas where property is changing to other uses and areas of severe decline may have no-stat addresses.

slide7

USPS: Detroit’s Vacancy Rate at 22.5%

There were 2,363 fewer vacant Detroit residential properties between June 2015 and June 2016, according to the U.S. Postal Service. Between March 2016 and June 2016 the number of residential vacancies decreased by 1,282. Overall in the month of June of 2016 there were 80,643 vacant residential addresses, which is equivalent to a 22.5 percent residential vacancy rate, according to the U.S. Postal Service. Also, for June 2016 the total number of residential addresses decreased by 4,630 from June 2015 and by 2,030 from March 2016.

Although there was a decrease in the number of vacant addresses, the percentage of vacant addresses in Detroit has remained in the 22.5-22.9 percent range since June of 2015. The data presented below shows that residential vacancy rates have experienced an overall increase since September 2012, when the U.S. Postal Service reported Detroit’s residential vacancy rate was 21.9 percent. However, there has been a decrease since March of 2015 when there was a peak residential vacancy rate of 23.5 percent. While the residential vacancy rate in Detroit has increased since September 2012 the number of residential addresses has experienced an overall decline of 6,441. The decrease occurred while the total of number of vacant residential addresses increased by 1,026 in the same time period (going from 79,612 in September 2012 to 80,643 in June 2016) . However, similar to the vacancy rate, the total number of vacant Detroit residential addresses peaked in March of 2015 and has since started to decline.

In addition to these changes, in June of 2016 there was a decline in the number of “no stat” addresses; that number decreased by 1,992 in the last year. Mail carriers denote properties as being either “vacant” or “no-stat.” Carriers on urban routes mark a property as vacant once no resident has collected mail for 90 days. Addresses are classified as “no-stat” for a variety of reasons. Addresses in rural areas that appear to be vacant for 90 days are labeled no-stat, as are addresses for properties that are still under construction. Urban addresses are labeled as no-stat when the carrier decides it is unlikely to be occupied again any time soon — meaning that both areas where property is changing to other uses and areas of severe decline may have no-stat addresses.

The maps below demonstrate both the overall Detroit address vacancy rates (including residential and business vacancy rates) by Census Tract for June 2016 and the change in vacancy rates between June 2016 and June 2015. In total, there were about 70 Census Tracts in Detroit with total vacancy rates above 33 percent. The Census Tract with the largest increase in its vacancy rate between June 2015 and June 2016 was located in Southwest Detroit and had a total vacancy rate increase of 11.1 percent.

slide3 slide4 slide5 slide6 slide7

Detroit’s vacancies decline, according to US Postal Service

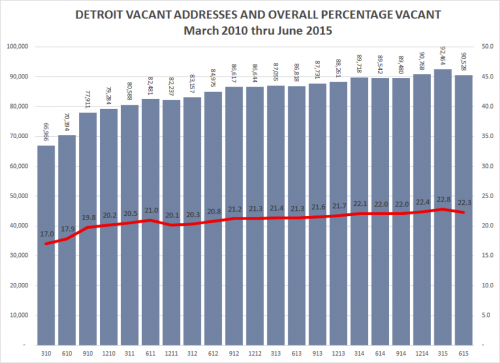
The most recent (June 2015) quarterly statistics from the U.S. Postal Service showed a decline in the number of vacant addresses in the city of Detroit. The total number of vacant addresses decreased by 1,936 from 92,464 to 90,528 for the period March 2015 to June 2015. The total number of residential addresses increased by 831 from 361,171 to 362,002. The total vacancy rate declined from from 22.8% percent to 22.3 percent.

However, the number of addresses classified as “no-stat” increased sharply by 1,563. Mail carriers denote properties as being either “vacant” or “no-stat.” Carriers on urban routes mark a property as vacant once no resident has collected mail for 90 days. Addresses are classified as “no-stat” for a variety of reasons. Addresses in rural areas that appear to be vacant for 90 days are labeled no-stat. So are addresses for properties that are still under construction, and urban addresses that the carrier decides are unlikely to be occupied again any time soon — meaning that both areas of high growth and severe decline may be labeled no-stat.

Source: United State Postal Service via HUD, March 2015.

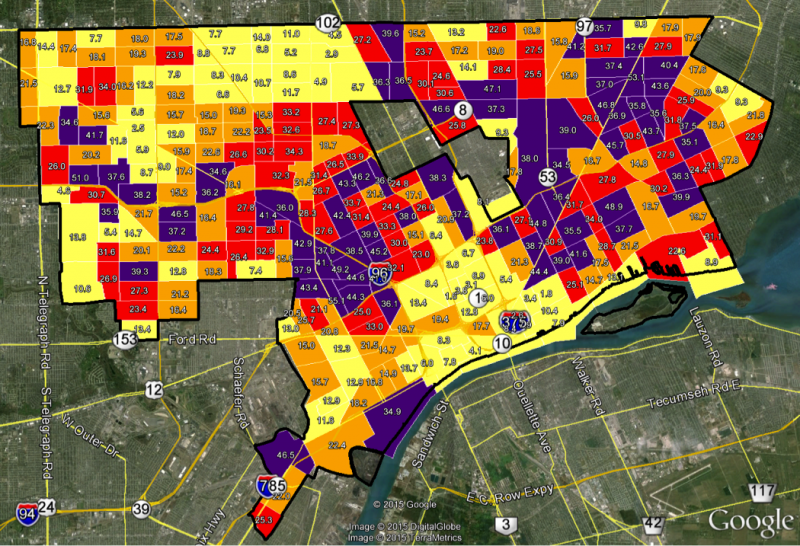
June 2015 Address Vacancy Rates by Census Tract

(percentage of all addresses that are vacant)

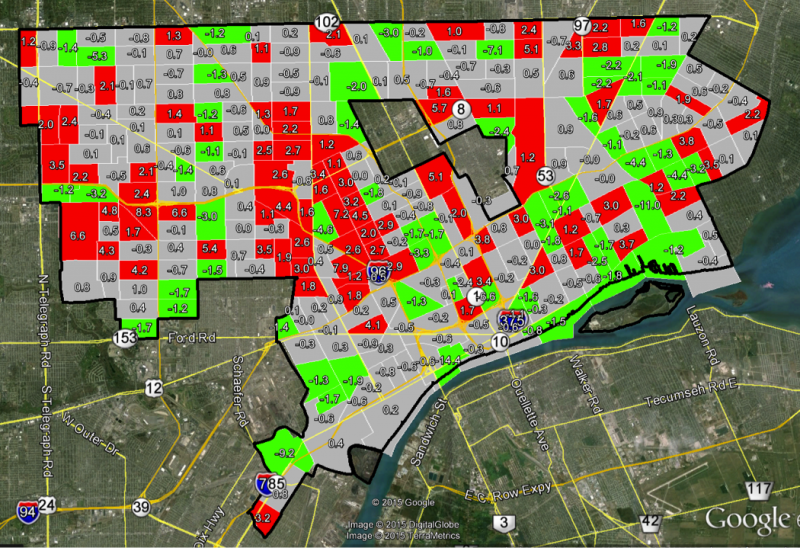
Change in Address Vacancy Rates: June 2015 versus June 2014

(percentage point change)

Red = Increase in address vacancy rate

Green = Decline in address vacancy rate (improvement)

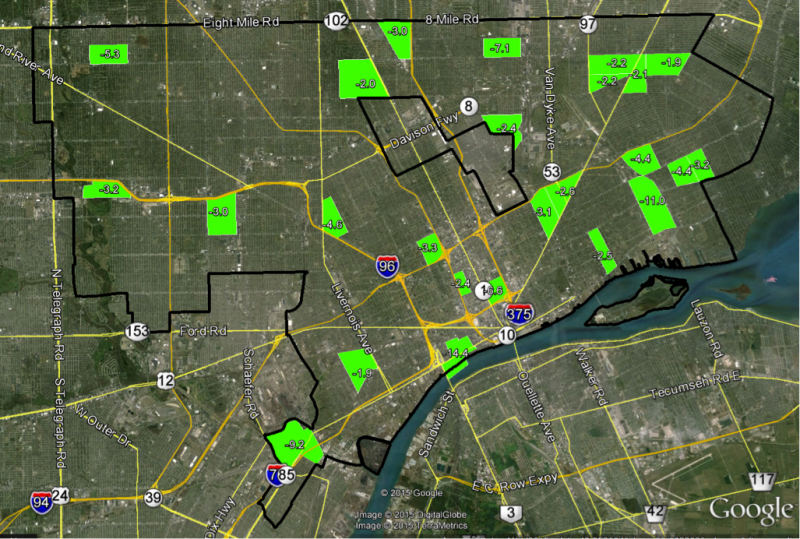
Top 25 Best Performing Neighborhoods for June 2015 versus June 2014

The map below illustrates the Detroit neighborhoods showing the largest percentage point reductions in their address vacancy rate. A reduction in the vacancy rate may result from an increase in occupancy or by way of demolition activity (which also reduces the number of vacant addresses). Concentrated demolition activity in the McNichols/Gratiot area has reduced the address vacancy rate but these areas still rank among the highest in the city at nearly 40 percent vacant.

For a map of demolitions, see the City’s Demolition Data Lens page at https://data.detroitmi.gov/view/vcn9-abmp

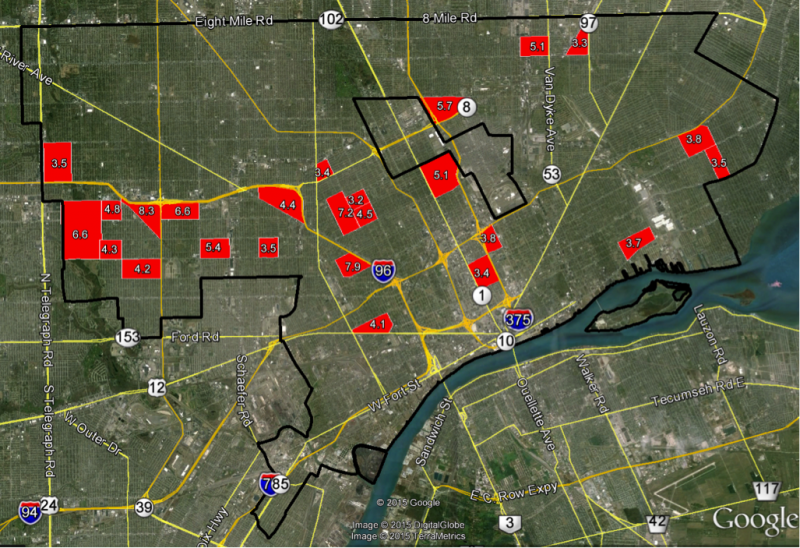
Top 25 Worst Performing Neighborhoods for June 2015 versus June 2014

The highlighted neighborhoods showed the largest increases in their vacancy rates between June 2014 and June 2015. Sixteen of the top 25 census tracts which showed increases in address vacancy are located on the west side of the city. Two eastside neighborhoods near Van Dyke and Outer Drive also showed sharp increases in address vacancy.