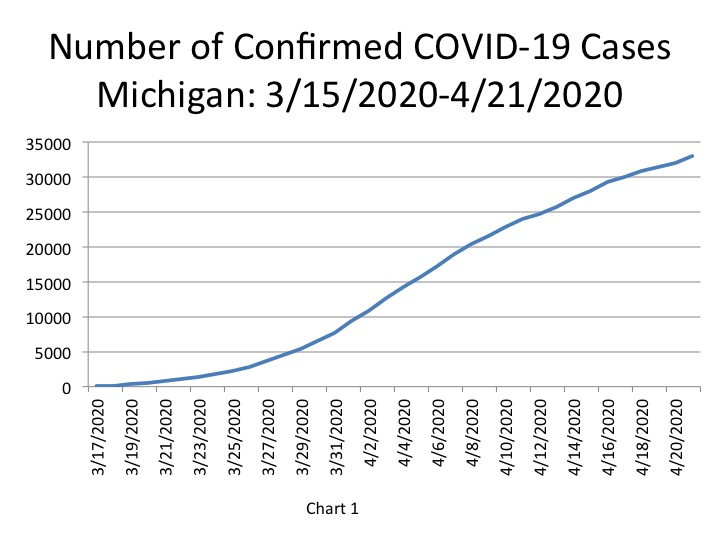
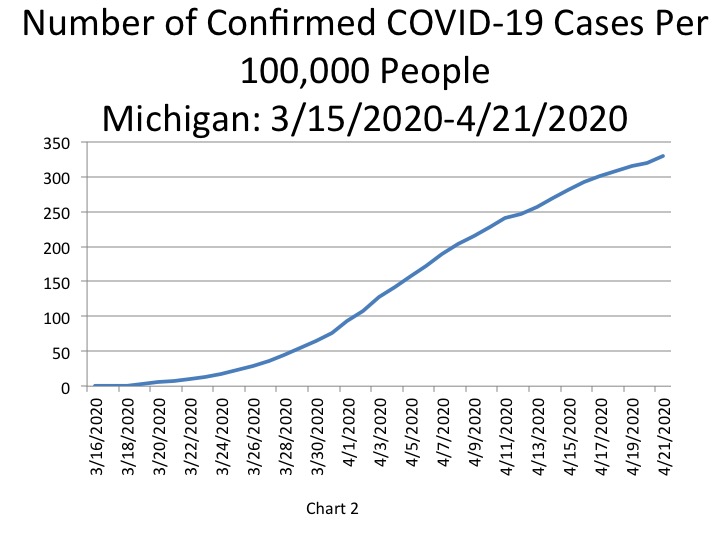
The total number of COVID cases in Michigan increased to 32,967 (Chart 1) compared to 32,000 cases the day before. This was equivalent to 330 cases per 100,000 people (Chart 2) on April 21.
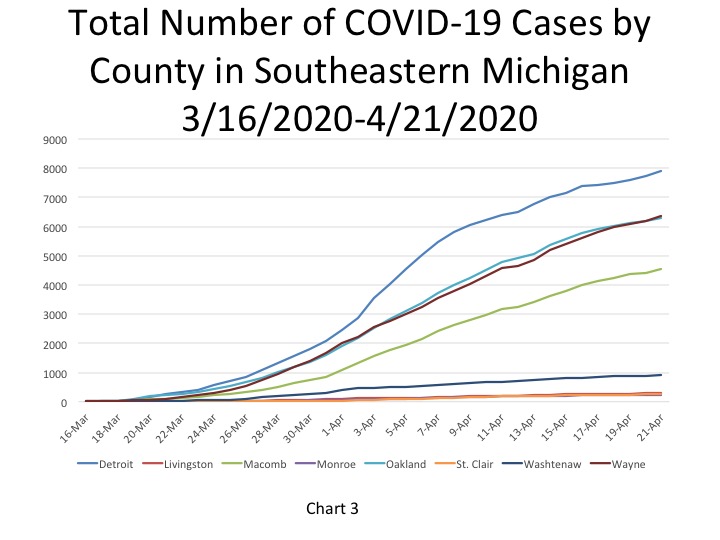
Of the total COVID cases, the City of Detroit had 7,904 cases, Wayne County (excluding Detroit) had 6,351 cases, Oakland County had 6,306 cases, and Macomb County had 4,544 cases (Chart 3). On April 21 the total number of COVID cases in Wayne County (except Detroit) exceeded the total number of cases in Oakland; Wayne County had 45 more cases. The number of confirmed cases in Washtenaw, Livingston, Monroe and St. Clair counties combined totaled 1,701, with Washtenaw County accounting for 900 of those cases, according to the most recent data from the State.
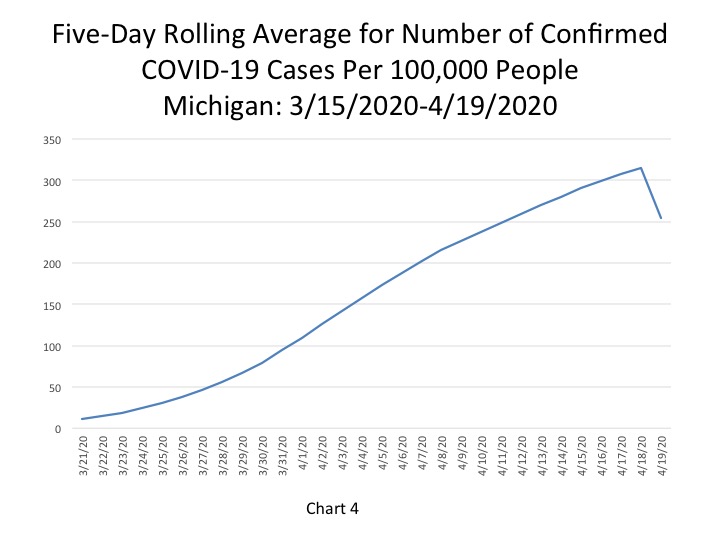
Chart 4 is a new addition to our data sets and shows a 5-day rolling average on the number of cases per 100,000 people. The 5-day simple moving average smooths out the number of cases, which is less sensitive to changes in testing, helping to adjust for changes or increases in testing or fluctuations in the quality of reporting or failure to report. Technically, we take information from the two days before and two days after in addition to information from the reported data and sum that information and divide by 5. This data set shows that peak for the per capita number of coronavirus cases in the state of Michigan was reached on April 18 with 314 cases per 100,000 people. As of April 19 the 5-day rolling average rate decreased to 254 cases per 100,000 people. For this data set April 19 is the most updated date since each number averages out two days prior to a date, the actual date and two days after.
The daily data highlighted in these posts is from Michigan.gov/coronavirus, where data is updated daily at 3 p.m. Historical data was supplied from covidtracking.com, which republishes COVID data from the State.
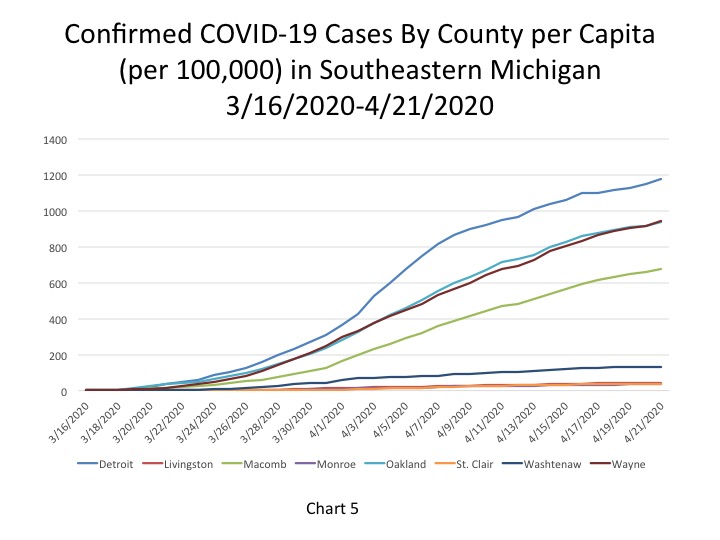
The City of Detroit showed total COVID per capita cases of 1,175 per 100,000 people on April 21, an increase from 1,150 the day before (Chart 5). Wayne County reported 944 cases per 100,000 people and Oakland County’s cases per 100,000 was 937. Macomb County had 658 COVID cases per 100,000 people. Each county and Detroit experienced increases between April 20 and 21.
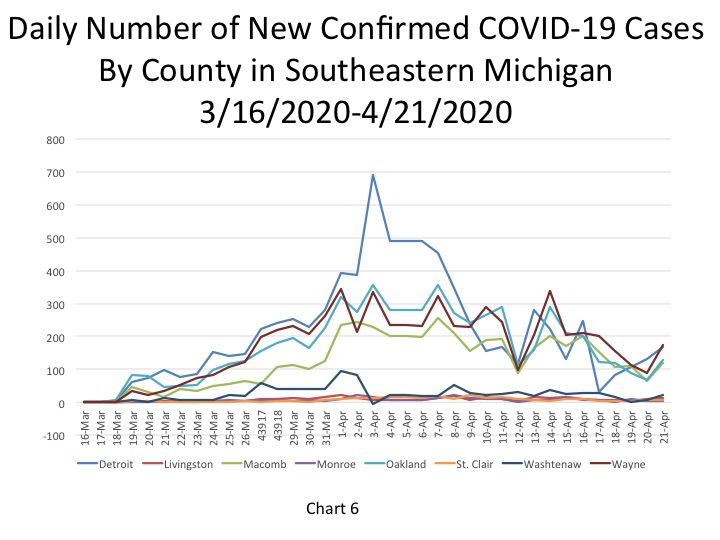
Chart 6 shows that the number of additional cases in Wayne, Oakland and Macomb counties about doubled between April 20 and 21. This could have been due to testing, as more centers are opening. The numbers show that there were 175 new cases in Wayne County on April 21, 128 in Oakland County, and 119 in Macomb County. The City of Detroit reported the highest number of new COVID cases at 168; although this was an increase from April 20, it is still among the lowest number of new cases reported since late March. Monroe and St. Clair counties only reported 5 and 7 new cases, respectively.
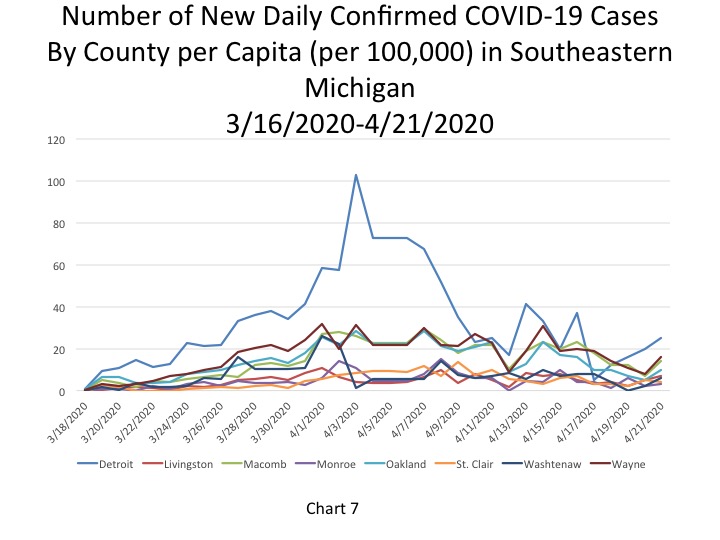
According to the data, the number of new COVID cases per 100,000 people for Macomb, Oakland and Wayne counties doubled between April 20 and 21 (Chart 7). On April 21 Wayne County reported 16 new COVID cases per 100,000 people, Oakland County reported 10, and Macomb County reported 14 new cases per 100,000 people. Detroit had 25 new COVID cases per 100,000 people on April 21, an increase from the rate of 20 reported on April 20.
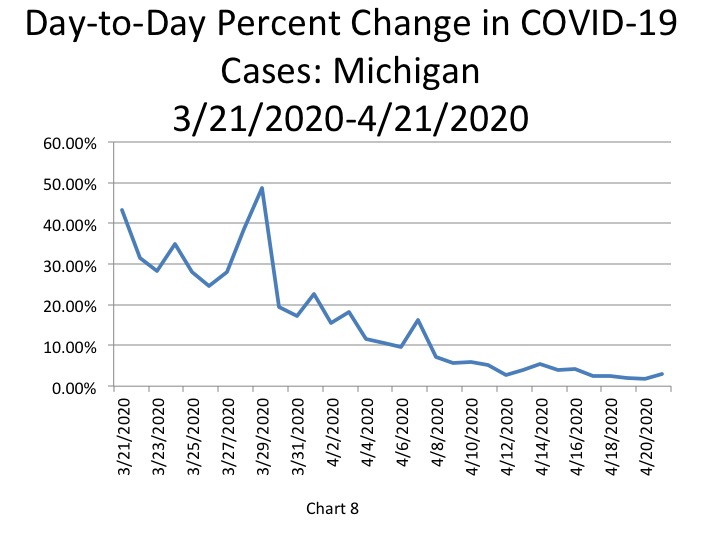
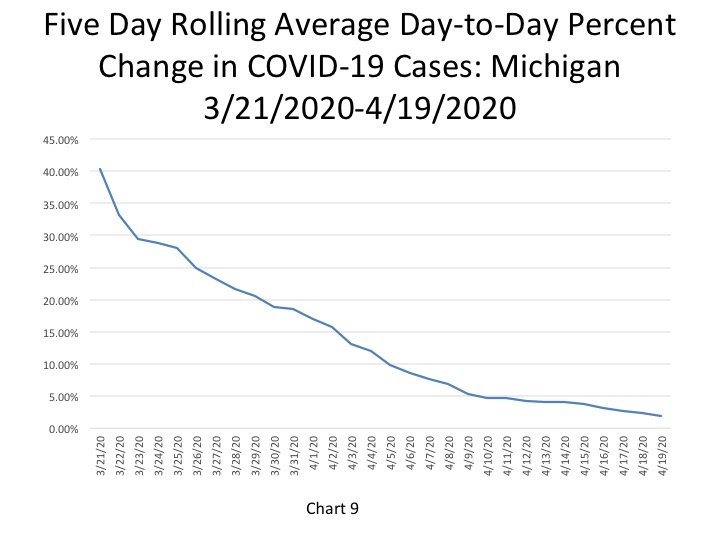
In addition to the raw data of confirmed cases, we also show the percent change in the number of cases reported day-to-day and the five day rolling average for the percent change. In Chart 8 we see the raw data in the percent change, which shows that on April 21 the percent change from April 20 was 3 percent, this was rate that nearly doubled from the day’s prior change of 1.8 percent. Chart 9, the 5-day rolling average percent change chart, shows a much smoother decrease in the percent change overall. On April 19 the percent change in day-to-day cases was 1.9 percent.
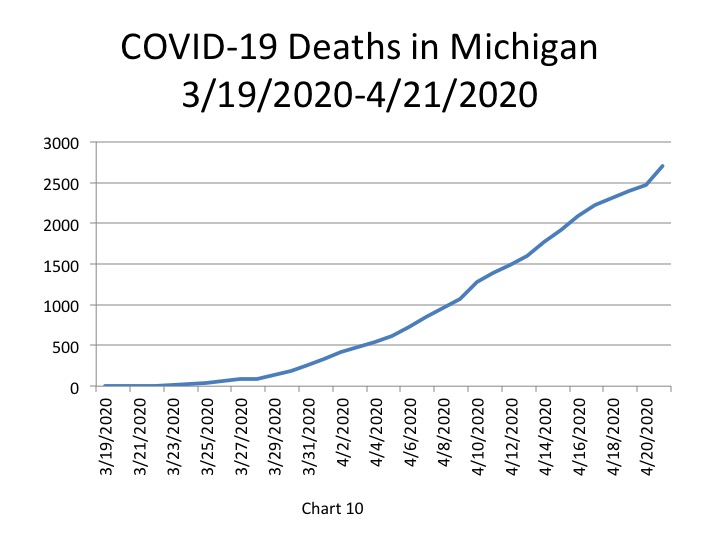
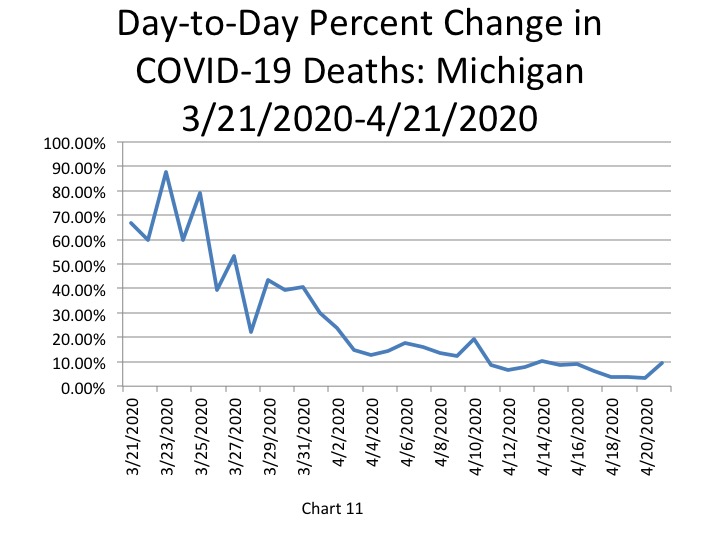
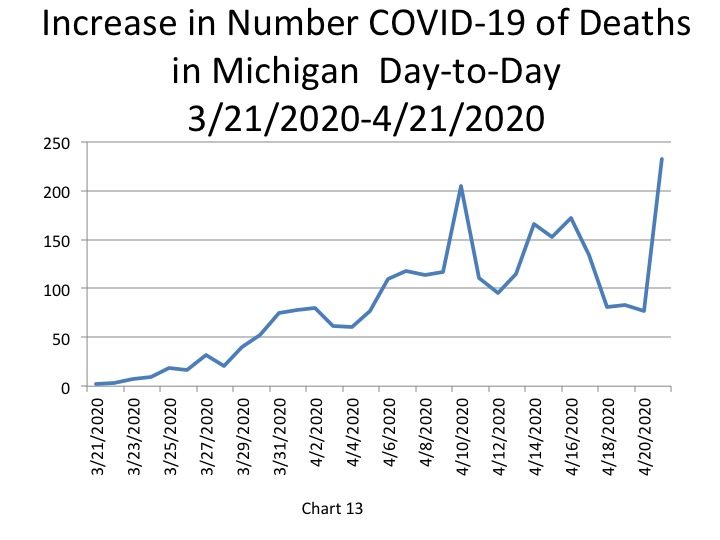
It was reported by the State of Michigan that on April 21 the total of COVID-19 deaths reached 2,700. This was a 9.4 percent increase from April 20 (Chart 11). The 2,700 total deaths reported for April 21 was 232 deaths higher than what was reported on April 20 (Chart 13). The 232 new COVID deaths on April 21 is the highest number of new daily deaths reported yet. However, that 232 death statistic included 95 older deaths that were revealed after comparing death certificates to the State’s database of confirmed cases.
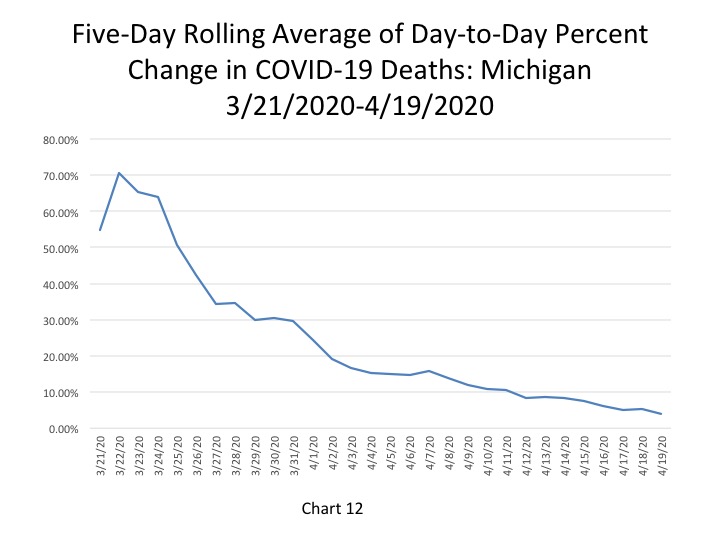
Chart 12 is another chart we have added to our series. This chart is also a 5-day rolling average chart and averages out the percent change in the number of COVID deaths in Michigan. When comparing Chart 12 to Chart 11, we see that the 5-day rolling average version shows a much smoother decrease in the percent change in COVID deaths. It also shows that the percent change in COVID deaths is likely still decreasing, even though the raw data shows otherwise. The 5-day rolling average shows that on April 19 the percent change in COVID deaths was 3.9 percent, a decrease from 5.3 percent change reported the day prior. The raw data showed a 9.4 percent increase in COVID deaths, which was an increase from the day prior.
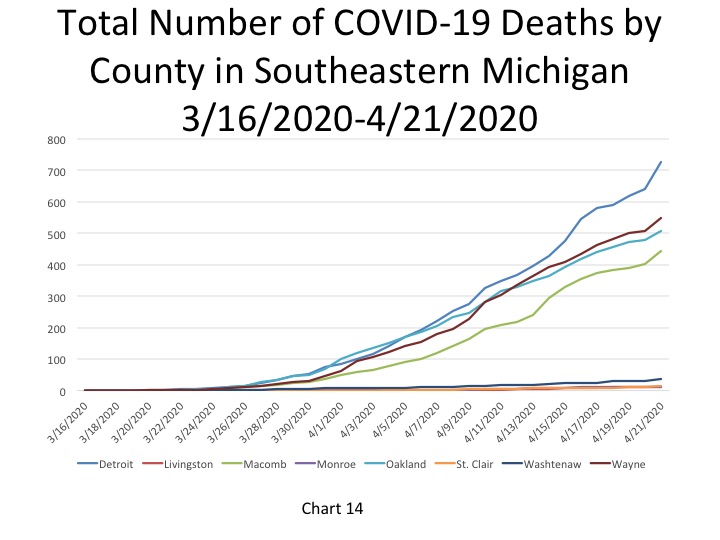
Of the total deaths reported, the number of COVID deaths in Detroit increased by 87 between April 20 and April 21. On April 21 the total COVID deaths across time for Detroit was 728 (Chart 14). Also on April 21, the Michigan Department of Health and Human Services also reported 550 total deaths in Wayne County (excluding Detroit), 506 in Oakland County and 445 in Macomb County (Chart 14).
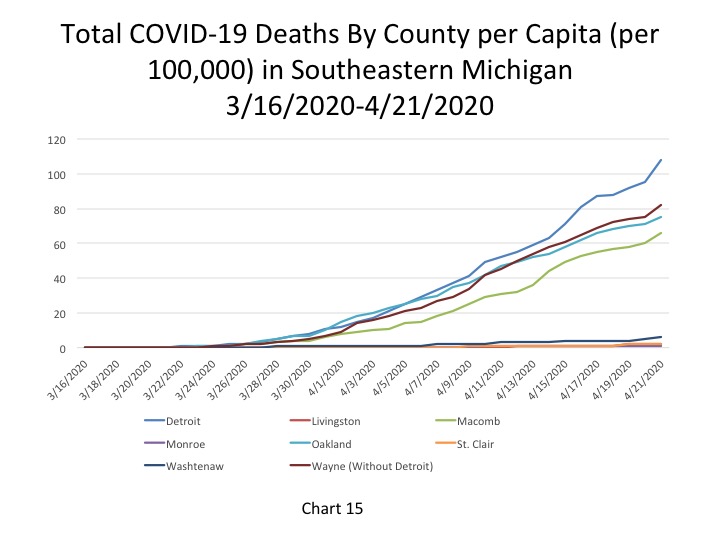
The total number of COVID fatalities per capita broke 100 on April 21 at 108 COVID deaths per 100,000 people in Detroit. Wayne County had 82 COVID deaths per 100,000 people on April 21 , Oakland County had 75, and Macomb County had 66 (Chart 15).
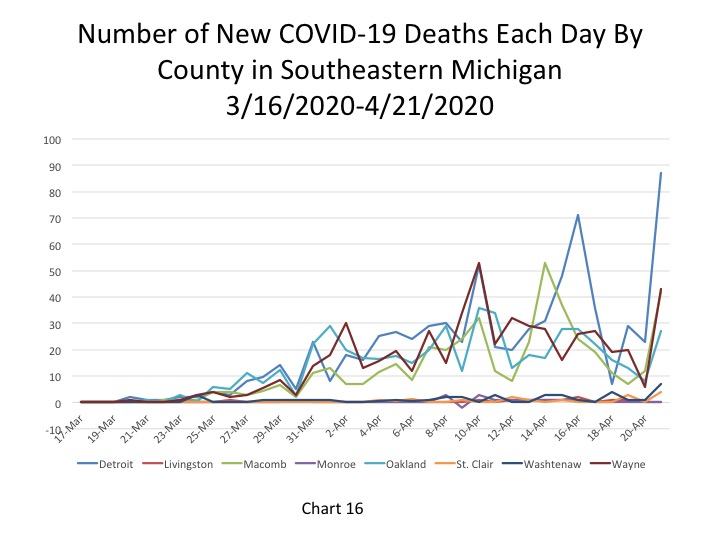
The 87 new COVID deaths Detroit reported on April 21 was the highest in the region and 44 deaths higher than the next highest county, which was Wayne County with 43 new COVID deaths (Chart 16). Macomb County reported 43 new deaths and Oakland County reported 27 new deaths. Livingston and Monroe counties reported no new deaths. Note that this increase could again be partly a lag in reporting from the weekend.
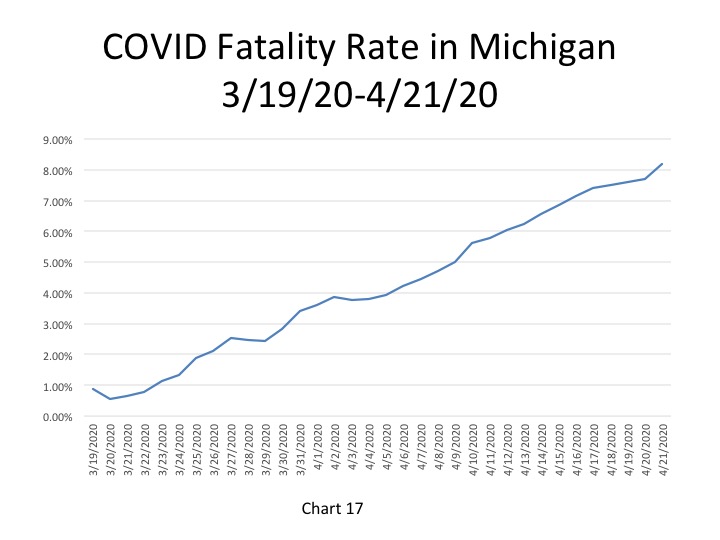
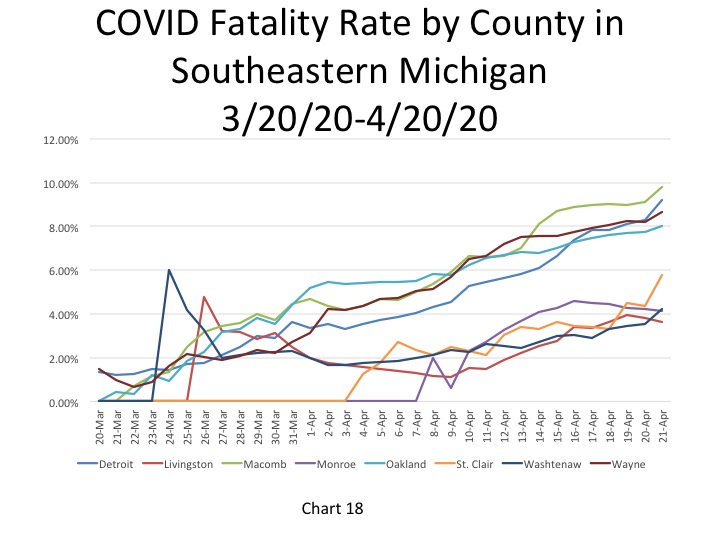
The final two charts-Charts 18 and 19-below show the case death rates for the State of Michigan and for Detroit and the seven counties in Southeastern Michigan. To determine the rates we divided the reported deaths from each day by the number of total COVID cases each day.
On April 21 the COVID case fatality rate in Michigan was 8.2 percent; an increase from the 7.7 percent death rate reported the day before.
The fatality rate in Macomb County continued to increase on April 21; it was reported at 9.8 percent. In Detroit the fatality rate was 9.2 percent, in Wayne County it was 8.7 percent and in Oakland Count it was 8 percent on April 21. Livingston and Monroe counties were the only two to experience a decrease in fatality rates.
Our new data sets further highlight that the spread of the virus is slowing, and our per capita 5-day rolling average chart for the number of cases even suggests we may be over the current peak. Additionally, Detroit Mayor Mike Duggan acknowledged on April 21 that the Stay-at-Home order has allowed the number of new cases and deaths in the City to begin to flatten out. Spikes are evident in the data, but the number of deaths in Detroit has averaged out to 36 over the last several days, according to Duggan.