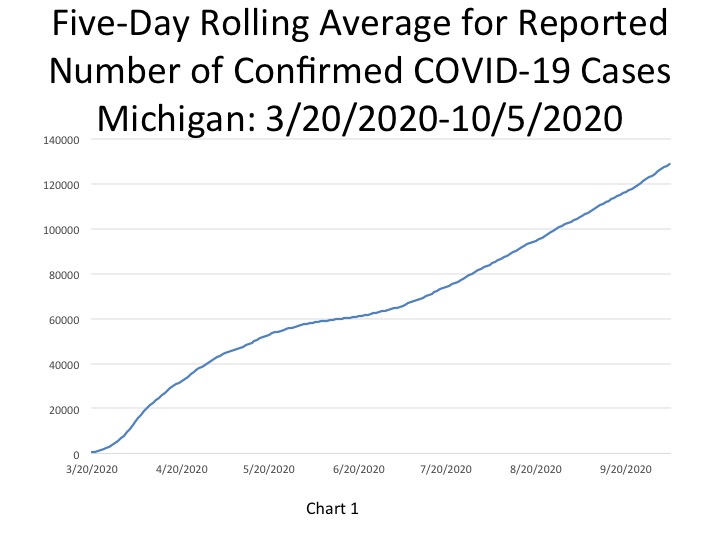
Michigan reported 1,016 new COVID cases on Oct. 7, 2020, bringing the total number of cases Michigan reported to 130,842. In Chart 1 we show that the State total for the number of COVID cases on Oct. 5 was 129,077–a five-day rolling average. The five-day rolling average for the total number of COVID cases (Chart 1) reflects a smoother curve and adjusts for fluctuations in testing and/or the quality of reporting or failure to report.
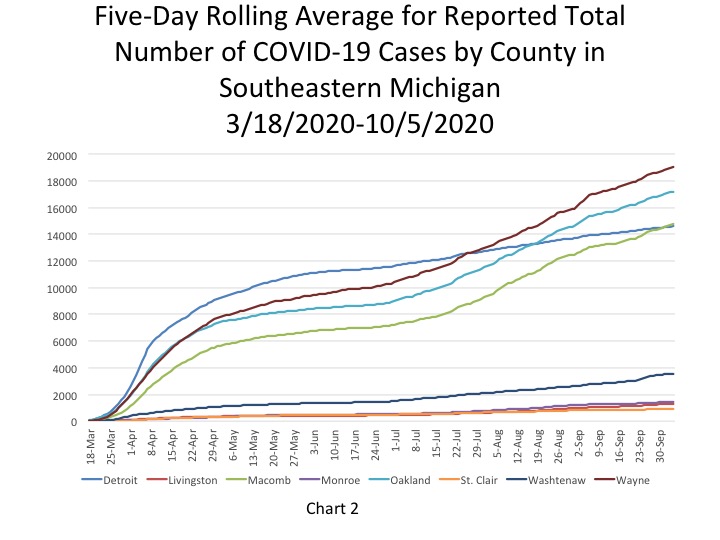
Chart 2 shows that, based on the five-day rolling averages, the growth of new COVID cases in Wayne, Oakland and Macomb counties continues to increase at higher rates than the other counties in the region and than Detroit, which once had the highest number cases until late July. Wayne County’s case numbers surpassed Detroit then, Oakland County’s case numbers surpassed Detroit in mid-August and Macomb County’s case numbers surpassed Detroit’s this month. On Oct. 5, Wayne County reported the highest number of cases in the region at 19,031. Oakland County reported 17,192 cases and Macomb County reported 14,754. Detroit reported 14,597 COVID cases on Oct. 5
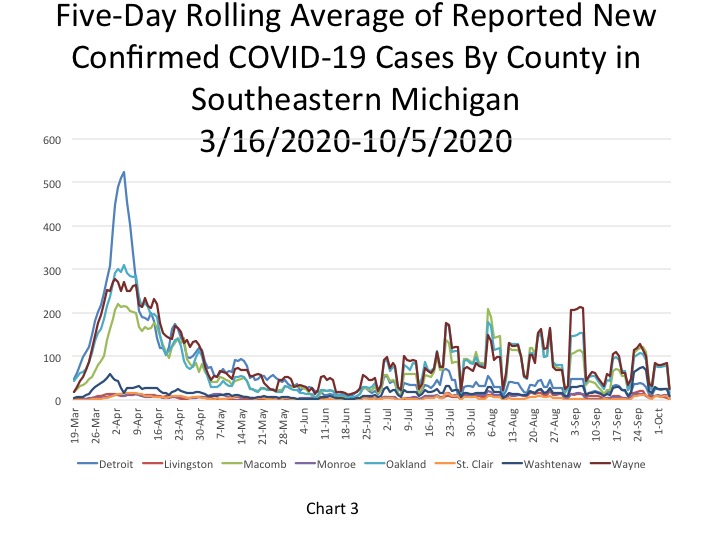
In addition to having the highest number of total COVID cases Wayne County in the region, Charts 3 and shows that it also had the highest number of daily cases on Sept. 21. Wayne County reported 25 new cases on Oct. 5, as did Macomb County. For at least the last week Wayne and Macomb counties have reported the highest number of new daily confirmed cases regionally. On Oct. 5 Oakland County reported 16 new cases and Detroit reported 10 new cases; these numbers may not have been fully updated by the State at the time of reporting. For example, on Oct. 4 the five-day rolling average for the number of new confirmed cases for Wayne County was 85, for Macomb County it was 78, for Oakland County it was 77 and for Detroit it was 25.
The daily data highlighted in these posts is from Michigan.gov/coronavirus, where data is updated daily at 3 p.m. Historical data were supplied from covidtracking.com, which republishes COVID data from the State. Additionally, the case totals do not reflect the number of people who have recovered, just those who have been infected. In early June the State changed how it reports its data on the website, making data more accurate in the long-term but more complicated to track as well. The State regularly updates older data and as we continue to publish regular updates on COVID the State’s changes to past data many not always be reflected in our posts. The data published in new posts is accurate for the day we received it on though.
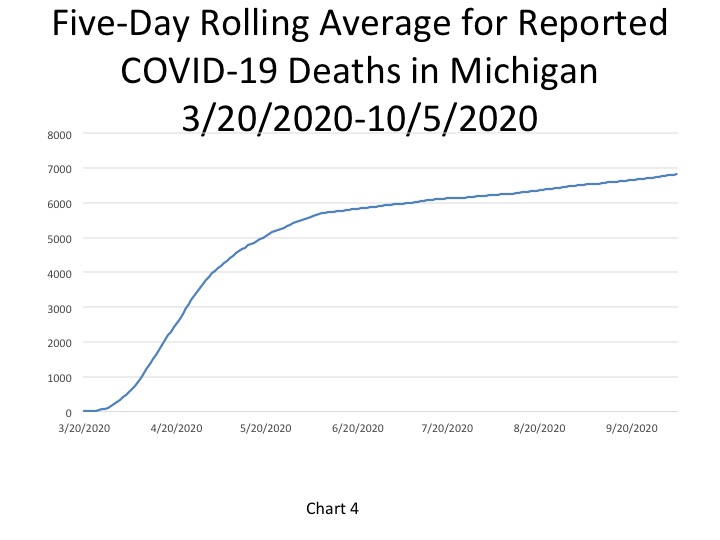
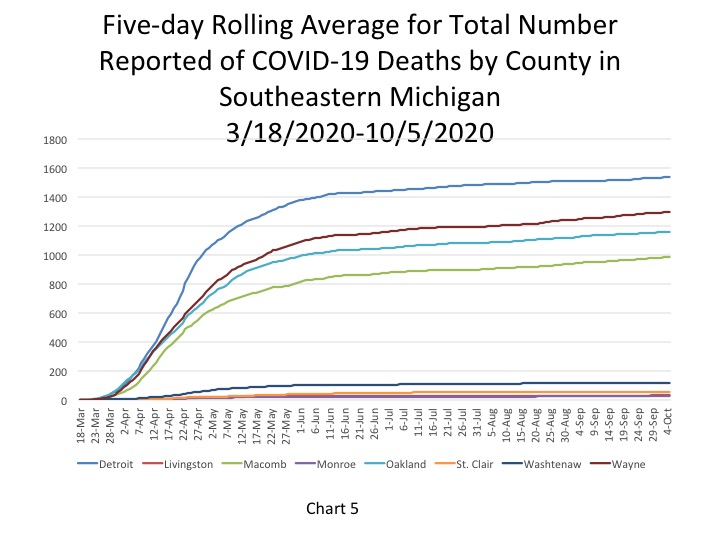
In Chart 4, the five-day rolling average for the number of deaths, shows the number of deaths in the State of Michigan reached 6,821 on Oct. 5. The actual cumulative COVID-19 deaths on Oct. 7 was 6,847, an increase of 8 deaths from the prior day. Chart 5 (a 5-day rolling average) further hones in on how majority the number of COVID related deaths has continued to remain flat for some time in Southeastern Michigan. On Oct. 5, the City of Detroit reported 1,537 deaths. Wayne County had the second highest total at 1,296 deaths on Oct. 5.
Michigan continues to battle the pandemic and while the recent Michigan Supreme Court ruling has left several answers about the Governor’s executive orders answered, one thing remains certain. We all must continue to wear masks, keep a responsible distance from others and respect scientific facts. Although the Governor’s orders are set to expire at the end of this month, the Michigan Department of Health and Human Services has since issued an order mandating masks, and certain local government units have followed suit.