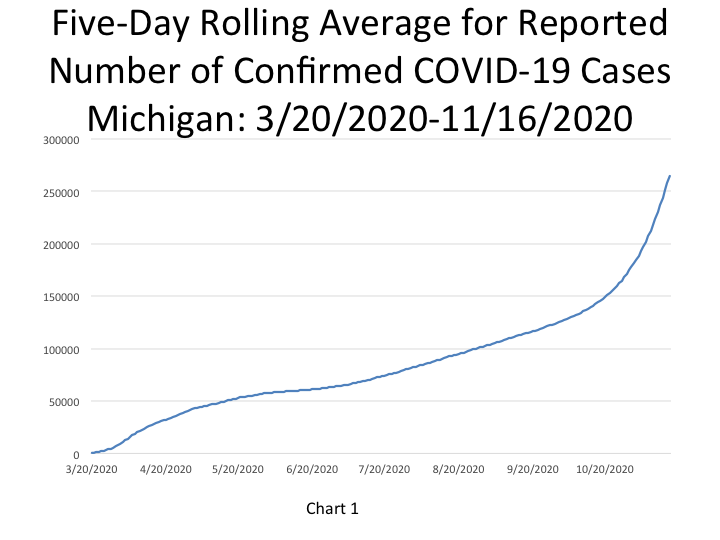
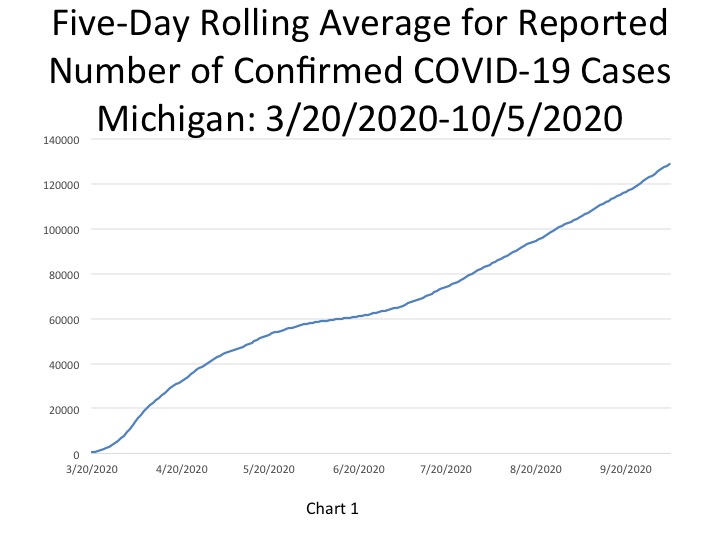
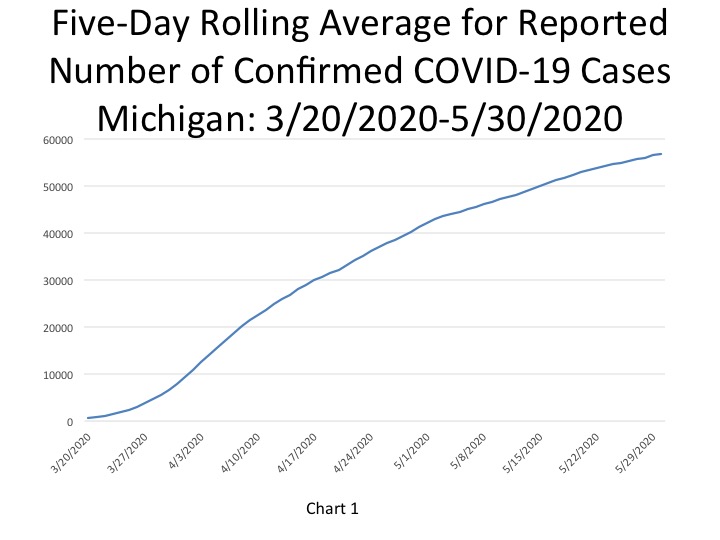
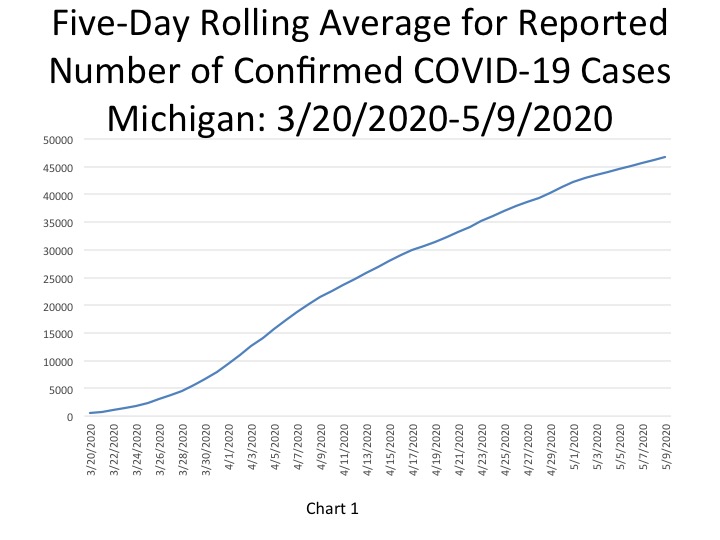
Michigan reported 5,772 new COVID cases on Nov. 18, 2020, bringing the total number of confirmed cases to 277,806. In Chart 1 we show that the State total for the number of confirmed COVID cases on Nov. 16 was 264,884–a five-day rolling average. The five-day rolling average for the total number of COVID cases (Chart 1) reflects a smoother curve and adjusts for fluctuations in testing and/or the quality of reporting or failure to report. This chart also shows that the curve continues to increase at a much higher rate than previously.
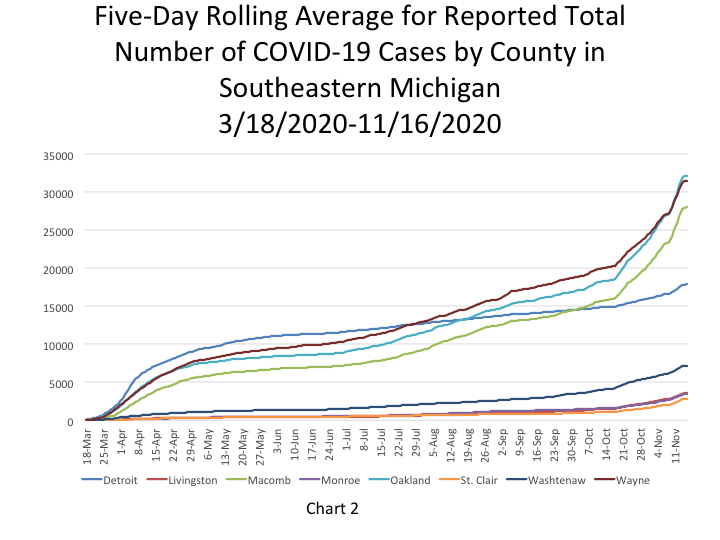
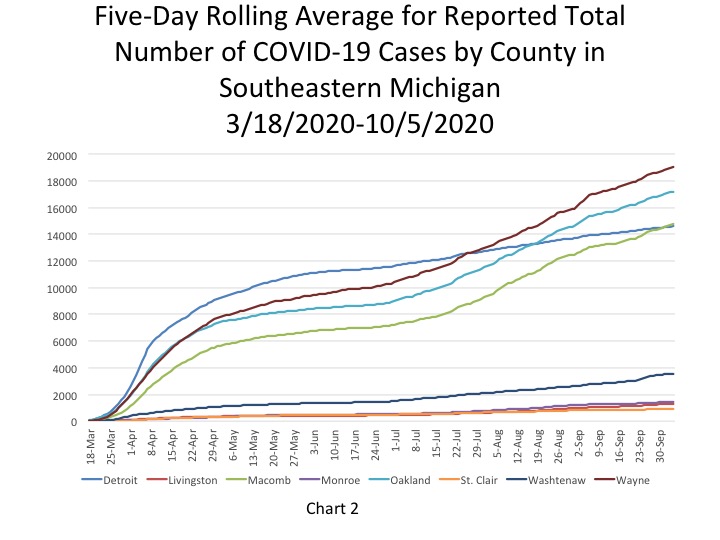
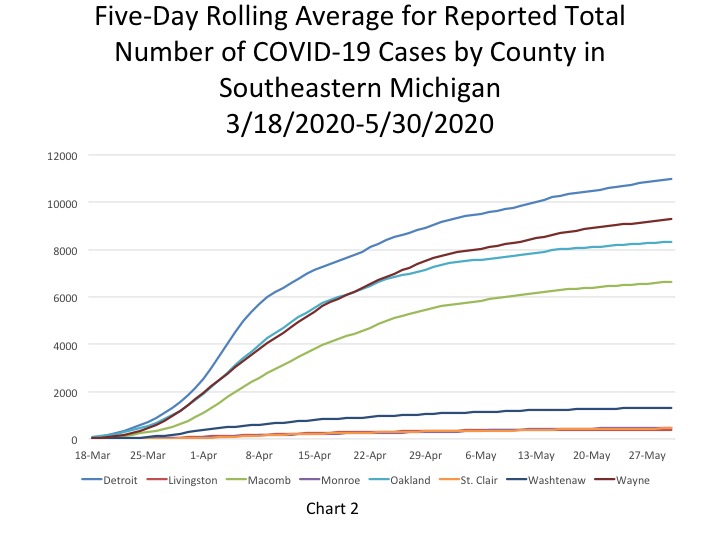
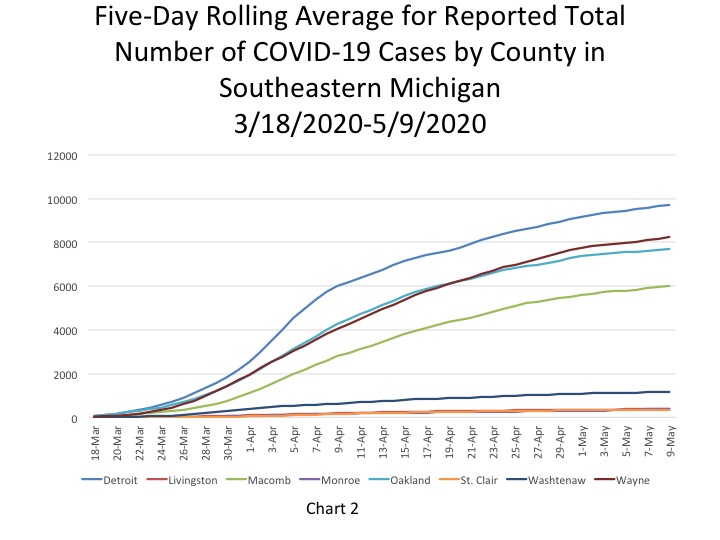
Chart 2 shows that on Nov. 16, according to the five-day rolling average, Oakland County reported the highest number of confirmed COVID cases in Southeastern Michigan at 32,190; Oakland County surpassed Wayne County as having the highest number of confirmed cases on Nov. 11. Wayne County reported the second highest number of cases on Nov. 16 at 31,527. Macomb County reported 28,088 COVID cases on Nov. 16 and Detroit reported 17,893.
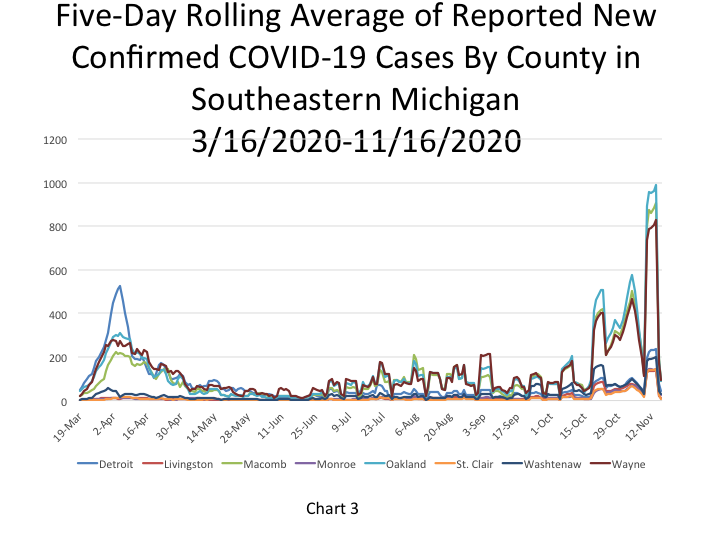
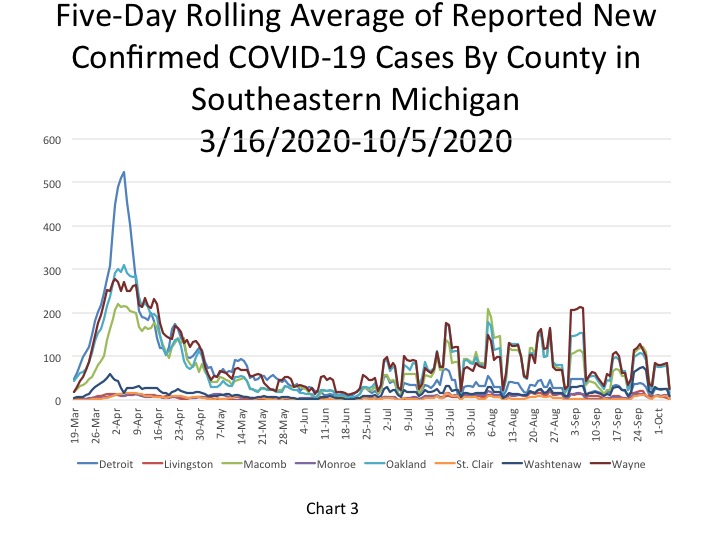
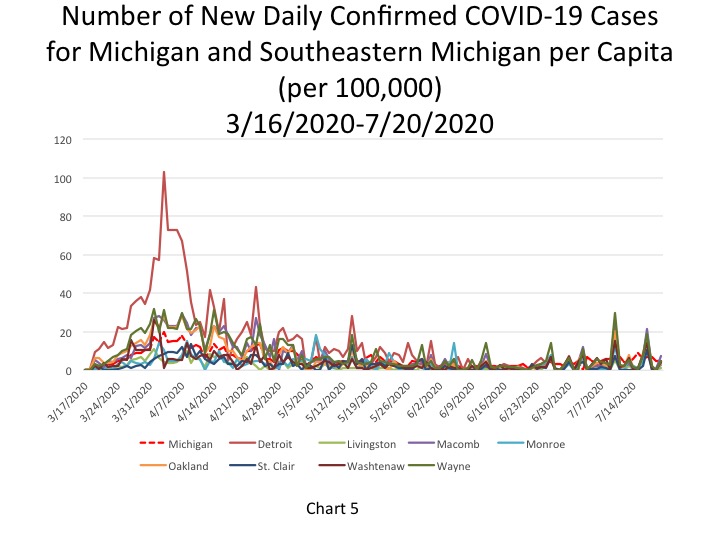
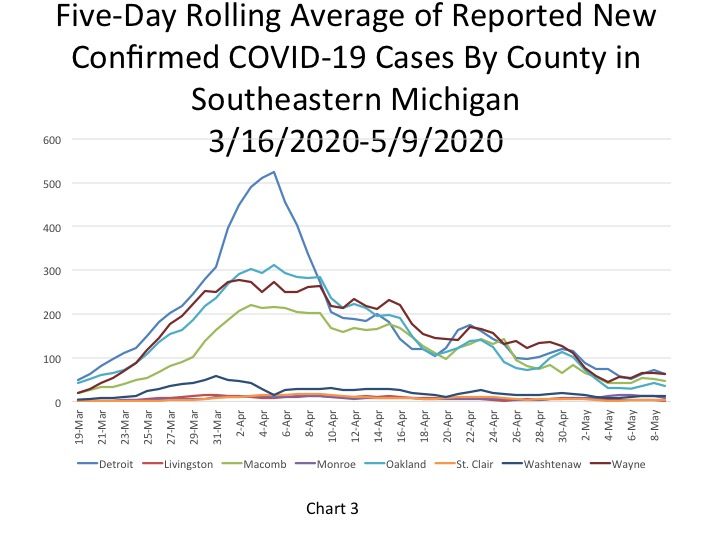
As shown in Chart 3, new daily numbers continue to spike above early daily highs, although there has been a decrease in the last few days. Wayne County reported the highest number of new daily confirmed cases on Nov. 16 at 93, followed by Macomb County with 92 new confirmed cases and Oakland County with 91. Detroit reported 43 new daily confirmed COVID cases on Nov. 16. These numbers are also based on a five-day rolling average.
The daily data highlighted in these posts is from Michigan.gov/coronavirus, where data is updated daily at 3 p.m. Historical data were supplied from covidtracking.com, which republishes COVID data from the State. Additionally, the case totals do not reflect the number of people who have recovered, just those who have been infected. In early June the State changed how it reports its data on the website, making data more accurate in the long-term but more complicated to track as well. The State regularly updates older data and as we continue to publish regular updates on COVID the State’s changes to past data many not always be reflected in our posts. The data published in new posts is accurate for the day we received it on though.
The chart below (Chart 4) shows that Macomb County has the highest number of COVID confirmed cases per capita. According to the data released on Nov. 18, Macomb County had 33,506 COVID cases per million people. Wayne County had the second highest number of confirmed cases per million people at 31,496. Detroit had 12,068 confirmed COVID cases per million people; no other counties in the region had fewer number of cases per capita.
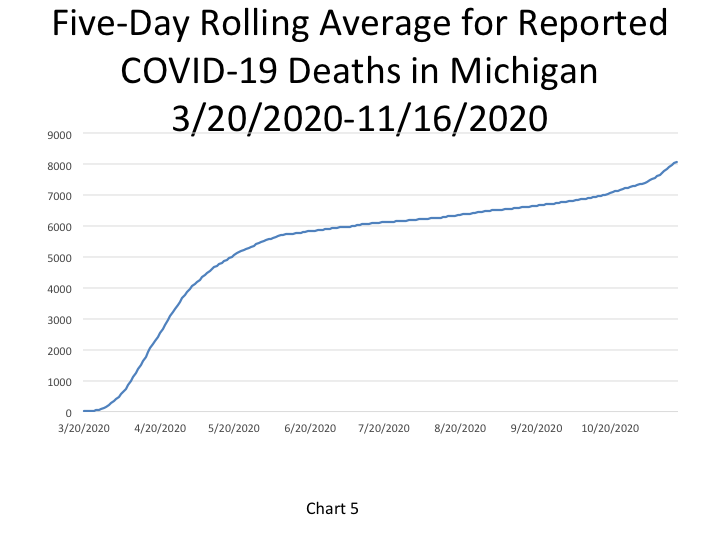
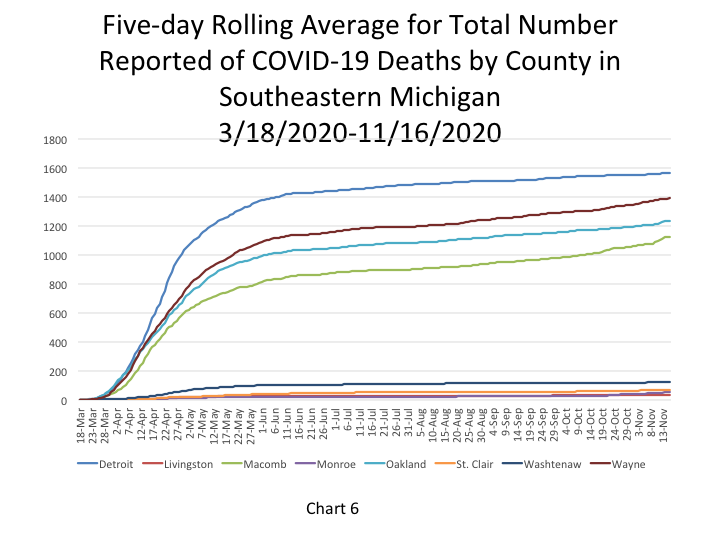
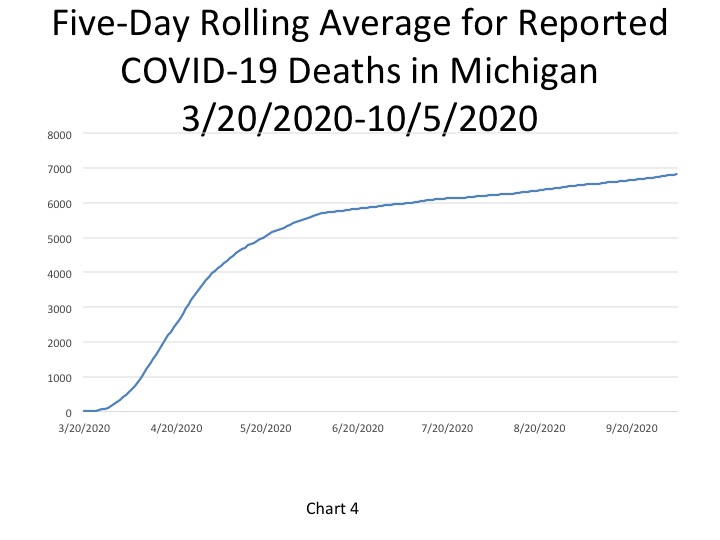
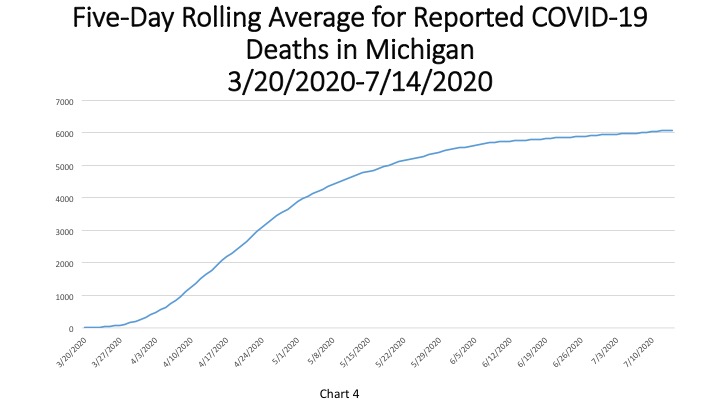
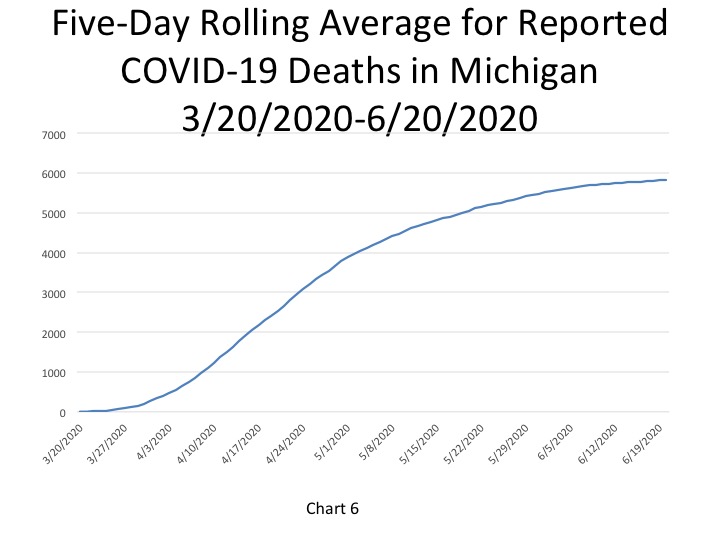
In Chart 5, the five-day rolling average for the number of deaths, shows the number of deaths in the State of Michigan reached 8,078 on Nov. 16. The actual cumulative COVID-19 deaths on Nov. 18 was 8,190, an increase of 62 deaths from the prior day. Chart 6 (a five-day rolling average) shows that on Nov. 16, the City of Detroit reported 1,565 deaths. Wayne County had the second highest total at 1,389 deaths on Nov. 16. Death related numbers overall remain flat, however hospitalizations are rapidly increasing according to Bureau of Epidemiology at the Michigan Department of Health and Human Services Director Sarah Lyon-Callo.
Yesterday (Nov. 18) marked the beginning of a three week pause on certain operations such as indoor dining, high school and college in-person learning and recreational activities such as movie theater going and indoor skating. This pause is meant to slow the spread of the virus in Michigan, which has been particularly rampant the last several weeks. Currently, Michigan has sixth highest number of COVID-19 cases in the country and the fifth highest number of deaths. A pause will not suffice in slowing the spread though; continued diligence in wearing a mask, washing hands, keeping a distance from others and not participating in group activities it what is truly needed to bring new daily case numbers back down.
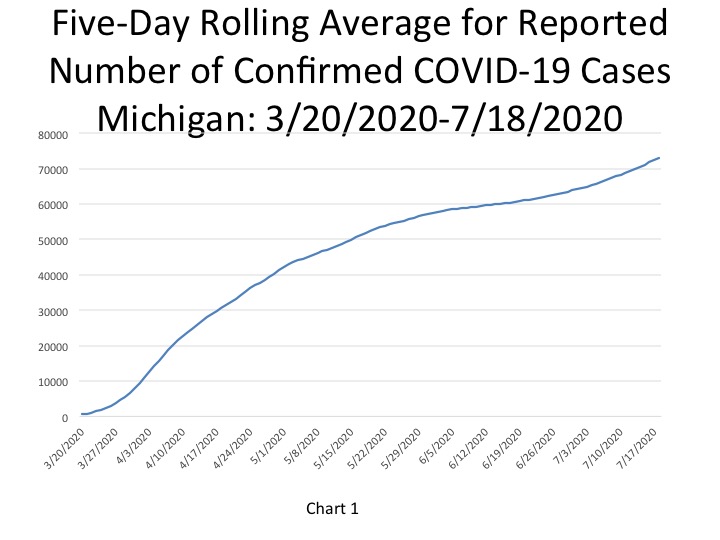
Michigan reported 1,016 new COVID cases on Oct. 7, 2020, bringing the total number of cases Michigan reported to 130,842. In Chart 1 we show that the State total for the number of COVID cases on Oct. 5 was 129,077–a five-day rolling average. The five-day rolling average for the total number of COVID cases (Chart 1) reflects a smoother curve and adjusts for fluctuations in testing and/or the quality of reporting or failure to report.
Chart 2 shows that, based on the five-day rolling averages, the growth of new COVID cases in Wayne, Oakland and Macomb counties continues to increase at higher rates than the other counties in the region and than Detroit, which once had the highest number cases until late July. Wayne County’s case numbers surpassed Detroit then, Oakland County’s case numbers surpassed Detroit in mid-August and Macomb County’s case numbers surpassed Detroit’s this month. On Oct. 5, Wayne County reported the highest number of cases in the region at 19,031. Oakland County reported 17,192 cases and Macomb County reported 14,754. Detroit reported 14,597 COVID cases on Oct. 5
In addition to having the highest number of total COVID cases Wayne County in the region, Charts 3 and shows that it also had the highest number of daily cases on Sept. 21. Wayne County reported 25 new cases on Oct. 5, as did Macomb County. For at least the last week Wayne and Macomb counties have reported the highest number of new daily confirmed cases regionally. On Oct. 5 Oakland County reported 16 new cases and Detroit reported 10 new cases; these numbers may not have been fully updated by the State at the time of reporting. For example, on Oct. 4 the five-day rolling average for the number of new confirmed cases for Wayne County was 85, for Macomb County it was 78, for Oakland County it was 77 and for Detroit it was 25.
The daily data highlighted in these posts is from Michigan.gov/coronavirus, where data is updated daily at 3 p.m. Historical data were supplied from covidtracking.com, which republishes COVID data from the State. Additionally, the case totals do not reflect the number of people who have recovered, just those who have been infected. In early June the State changed how it reports its data on the website, making data more accurate in the long-term but more complicated to track as well. The State regularly updates older data and as we continue to publish regular updates on COVID the State’s changes to past data many not always be reflected in our posts. The data published in new posts is accurate for the day we received it on though.
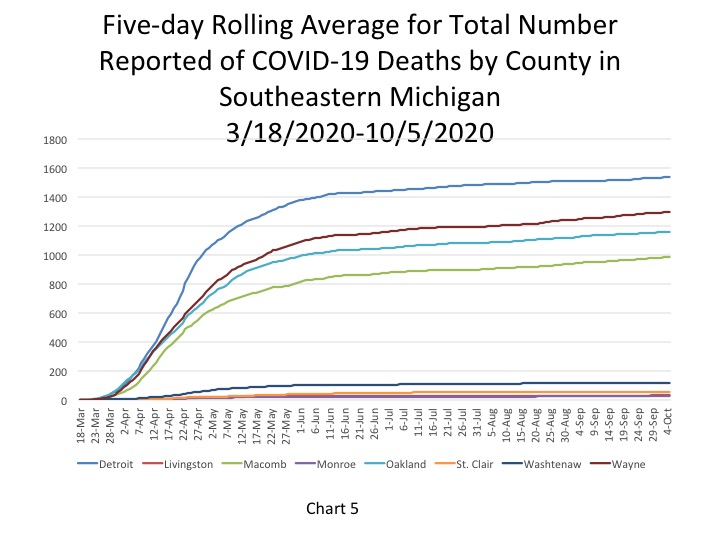
In Chart 4, the five-day rolling average for the number of deaths, shows the number of deaths in the State of Michigan reached 6,821 on Oct. 5. The actual cumulative COVID-19 deaths on Oct. 7 was 6,847, an increase of 8 deaths from the prior day. Chart 5 (a 5-day rolling average) further hones in on how majority the number of COVID related deaths has continued to remain flat for some time in Southeastern Michigan. On Oct. 5, the City of Detroit reported 1,537 deaths. Wayne County had the second highest total at 1,296 deaths on Oct. 5.
Michigan continues to battle the pandemic and while the recent Michigan Supreme Court ruling has left several answers about the Governor’s executive orders answered, one thing remains certain. We all must continue to wear masks, keep a responsible distance from others and respect scientific facts. Although the Governor’s orders are set to expire at the end of this month, the Michigan Department of Health and Human Services has since issued an order mandating masks, and certain local government units have followed suit.
On July 20, the State of Michigan reported a total of 74,152 cases, an increase of 489 cases from the day prior. In terms of the number of new daily cases, the 489 new COVID cases reported on July 20 is a small increase from the 483 new cases reported on July 19. Of the new 489 new COVID cases, 202 were documented in Southeastern Michigan. In total, 41 percent of the new COVID cases were in Southeastern Michigan, meaning case numbers are increasing at a higher rate outside of the region than locally. In Chart 1 we show that the State total for the number of COVID cases on July 18 was 73,068–a five-day rolling average. The five-day rolling average for the total number of COVID cases (Chart 1) reflects a smoother curve and adjusts for fluctuations in testing and/or the quality of reporting or failure to report.
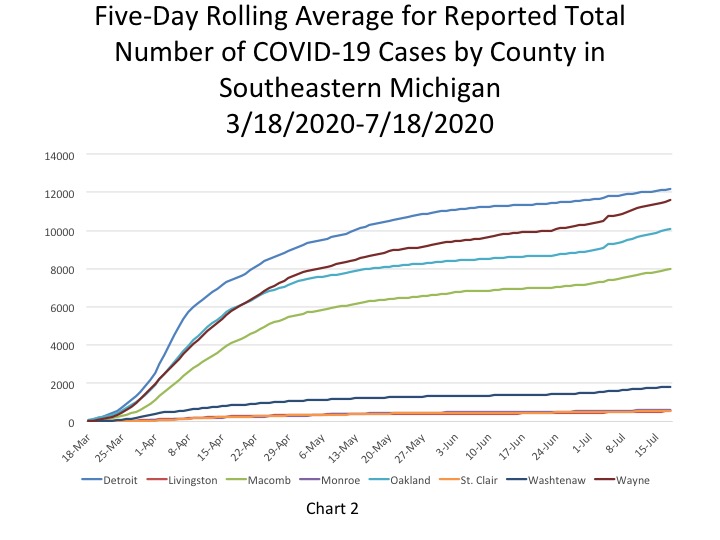
Chart 2 shows that, based on the five-day rolling averages, the growth of new COVID cases in Southeastern Michigan continues to increase, with the numbers in Wayne County continuing to inch closer to those being reported in Detroit. On July 18, Wayne County’s numbers reached 11,595. Detroit, which continues to have the highest overall number of cases, reported 12,178 COVID cases as of July 18. Oakland County reported 10,110 cases and Macomb County reported 8,013.
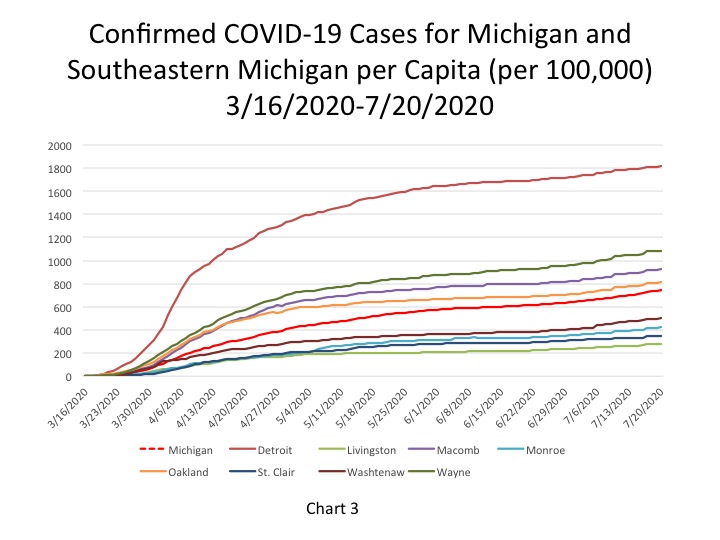
The City of Detroit had 1,817 COVID cases per 100,000 people as of July 20, an increase from 1,812 on July 19 (Chart 3). This is based upon a reported increase of 32 new COVID cases between July 19 and July 20, bringing the total number of COVID cases in Detroit to 12,223. Wayne County reported 11,085 cases per 100,000 people, and Oakland County had 810 cases per 100,000 people. These per capita rates were based upon 11,686 total cases for Wayne and for 10,191 Oakland. Macomb County reported 928 cases per 100,000 people, which is based upon 8,107 cases.
The daily data highlighted in these posts is from Michigan.gov/coronavirus, where data is updated daily at 3 p.m. Historical data were supplied from covidtracking.com, which republishes COVID data from the State. Additionally, the case totals do not reflect the number of people who have recovered, just those who have been infected. In early June the State changed how it reports its data on the website, making data more accurate in the long-term but more complicated to track as well. The State regularly updates older data and as we continue to publish regular updates on COVID the State’s changes to past data many not always be reflected in our posts. The data published in new posts is accurate for the day we received it on though.
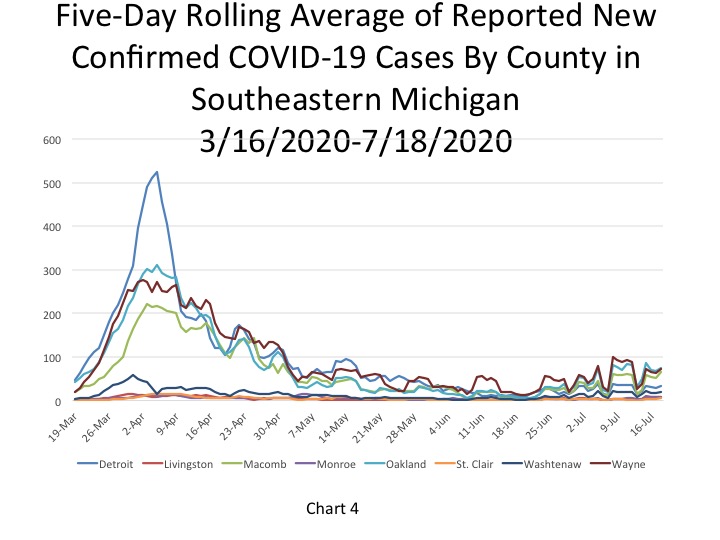
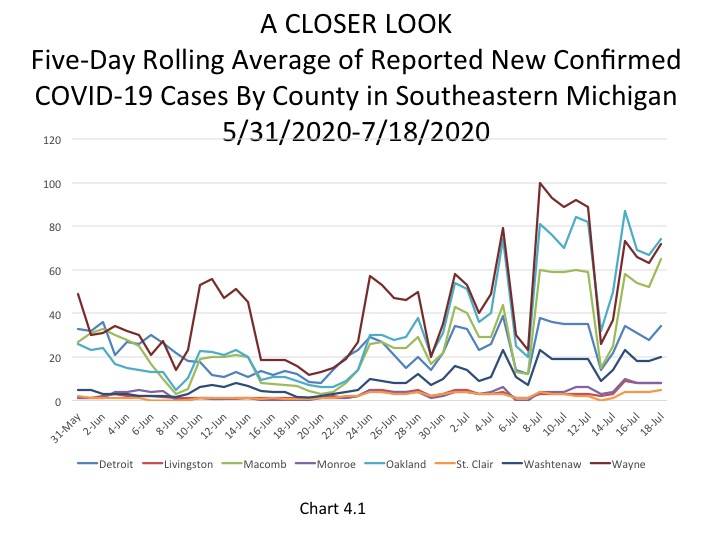
Chart 4 shows that Oakland County has been reporting the highest number of daily cases, according to the five-day rolling average, in about the last week. On July 18, Oakland County reported 74 new daily cases; Chart 4.1 also shows this, but at a more zoomed in level. The charts also show that Detroit reported 34 new cases on July 18, which is lower than the new cases reported out of Macomb and Wayne counties as well. Macomb County reported 62 new cases and Wayne County reported 72.
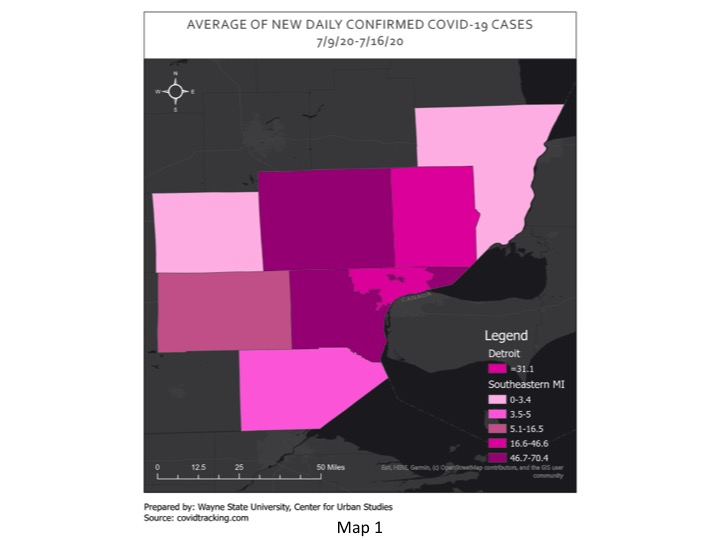
Map 1, which shows the average number of new daily COVID cases between July 9 and July 16 for Southeastern Michigan, highlights how Wayne County had the highest average number of new cases at 70.4, but Oakland County was right behind it with an average of 68.8. new cases. The map also shows that for Detroit the average number of new cases last week was 31.1 and it was 46.6 for Macomb County. As the data above shows, all four of those entities, and the remaining counties in the region all reported lower average weekly numbers for new daily COVID cases between July 9-16 than what was reported on July 18.
On July 20, the per capita rate for the number of new daily COVID cases per 100,000 people was 5 for the State, which was equivalent to 482 new cases (Chart 5). Detroit and Wayne County also each reported a per capita rate of 5 new daily COVID cases per 100,000 people on July 20, which was equivalent to 32 and 50 new cases, respectively. Macomb County was the only entity in the region to report a higher per capita rate than the State. Macomb County reported a per capita rate of 7 which was equivalent to 65 new daily cases. Oakland County reported a per capita rate of which was equivalent to 42 new cases. In Southeastern Michigan there were 202 new COVID cases reported on July 20.
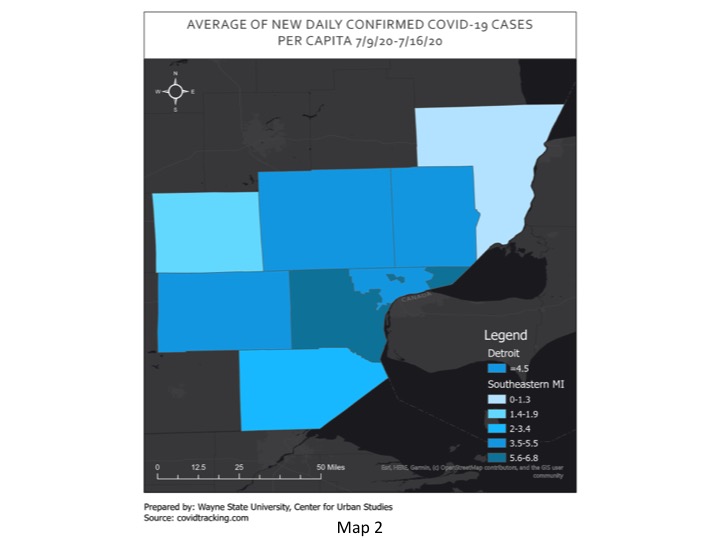
Map 2 mimics the message of Map 1, with Wayne County having the highest average number of daily confirmed COVID cases per 100,000 between July 9 and July 16. During that week Wayne County had an average of 6.8 daily COVID cases per 100,000 people. Detroit averaged a per capita rate of 4.5 during that time frame.
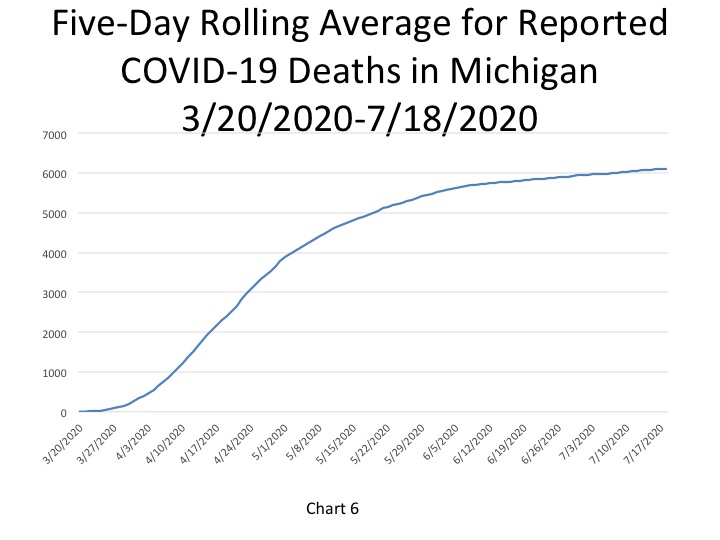
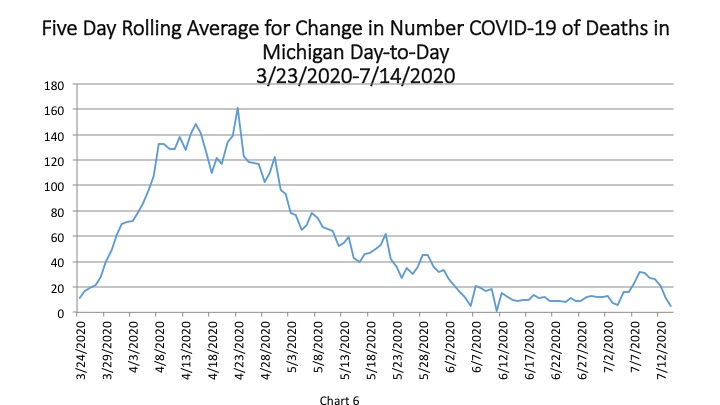
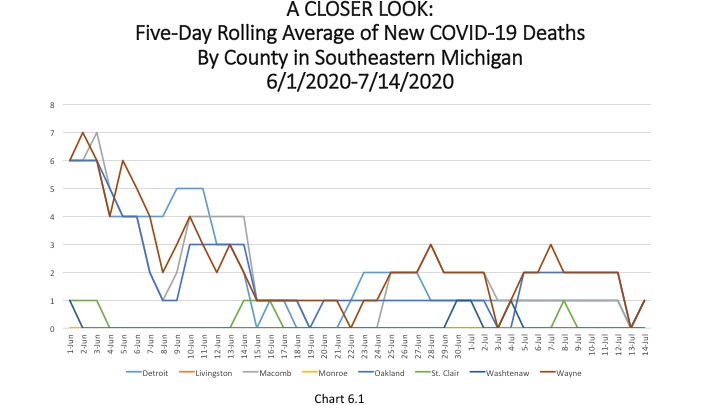
In Chart 6, the five-day rolling average for the number of deaths in Michigan, shows the number of deaths in the State of Michigan reached 6,114 on July 18. The actual cumulative COVID-19 deaths on July 20 was 6,126, an increase of 7 deaths from the prior day. Of the 7 deaths that were reported on July 20, 4 occurred in Southeastern Michigan.
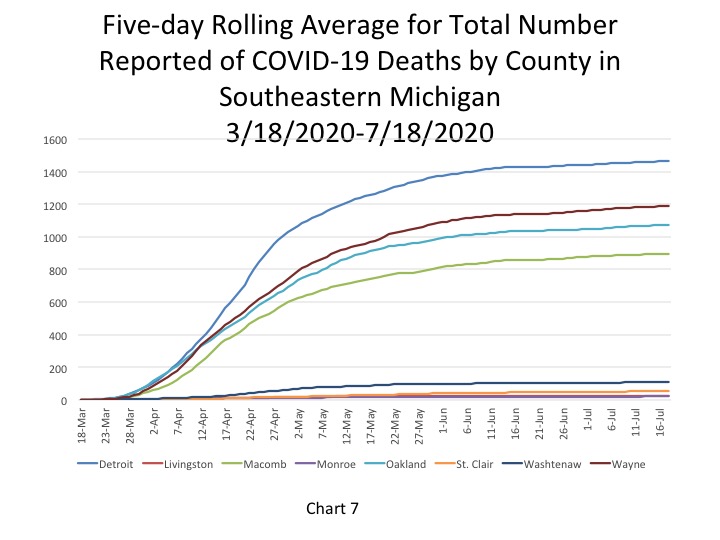
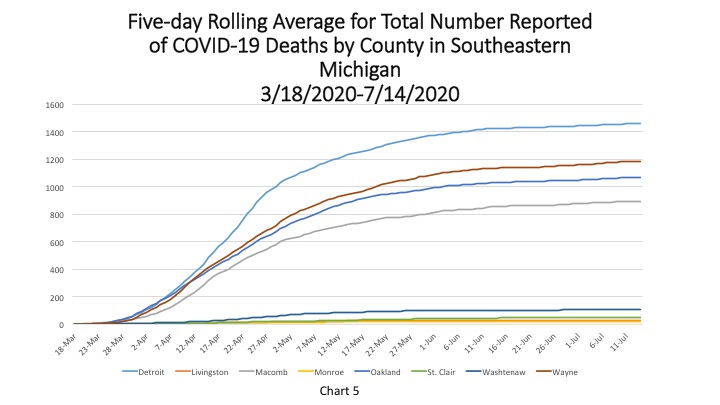
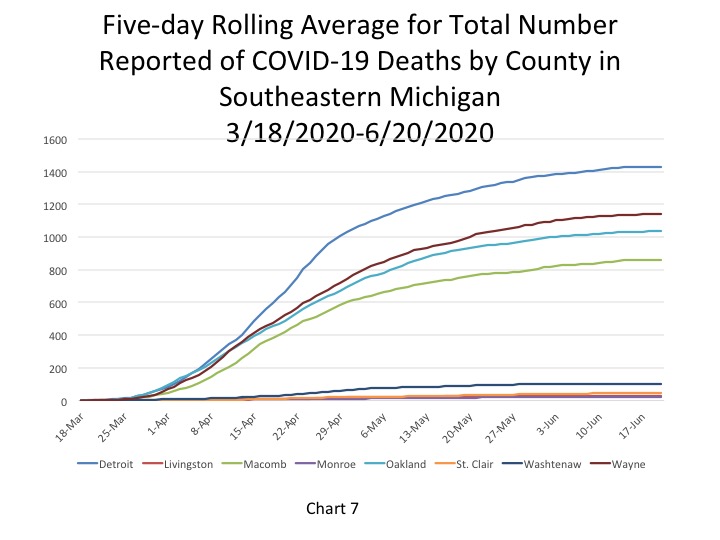
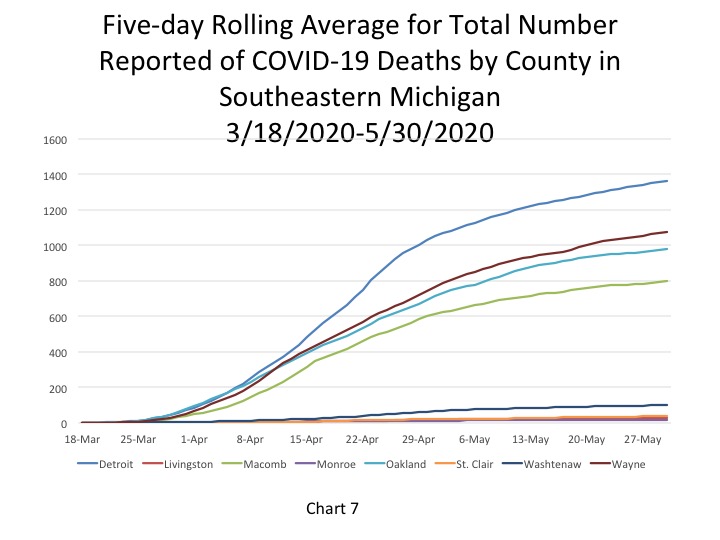
Chart 7 (a 5-day rolling average) further hones in on where the majority of the COVID deaths in Michigan have occurred, and continue to occur, in Southeastern Michigan. As of July 18, the City of Detroit had reported 1,467 deaths. Wayne County had the second highest total at 1,190 deaths on July 18.
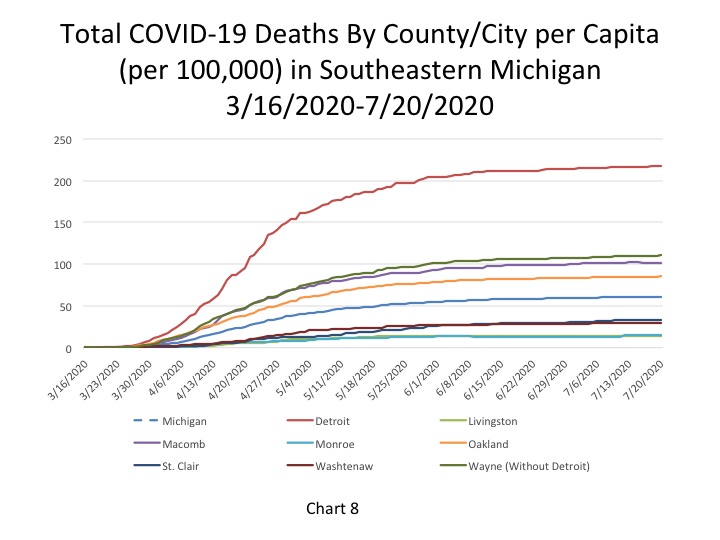
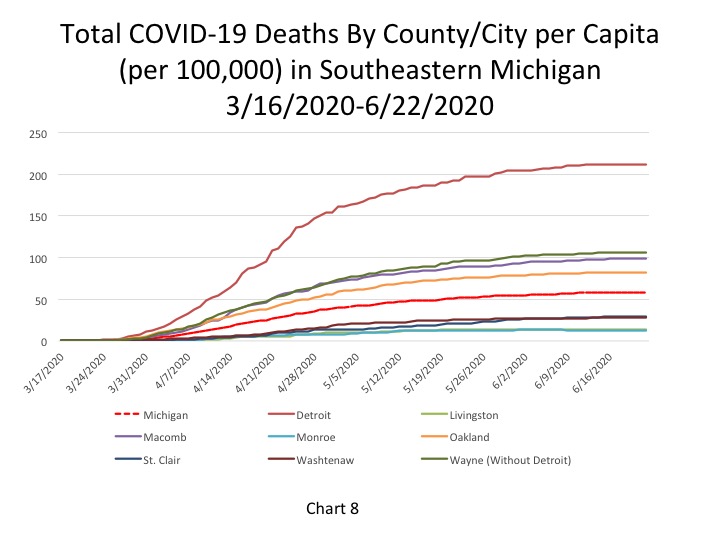
The per capita rates for the number of total COVID deaths in Southeastern Michigan continues to remain fairly stagnant across the region. Detroit reported 218 total COVID deaths per 100,000 people on July 20, which was equivalent to 1,468 deaths. Wayne County reported a per capita rate of 111 (1,191 deaths), Macomb County reported a per capita rate of 103 (892 deaths) and Oakland County reported a per capita rate of 86 (1,076 deaths). The State of Michigan reported a per capita rate for the number of total COVID deaths at 61 per 100,000 people, which was equivalent to 6,126 total deaths.
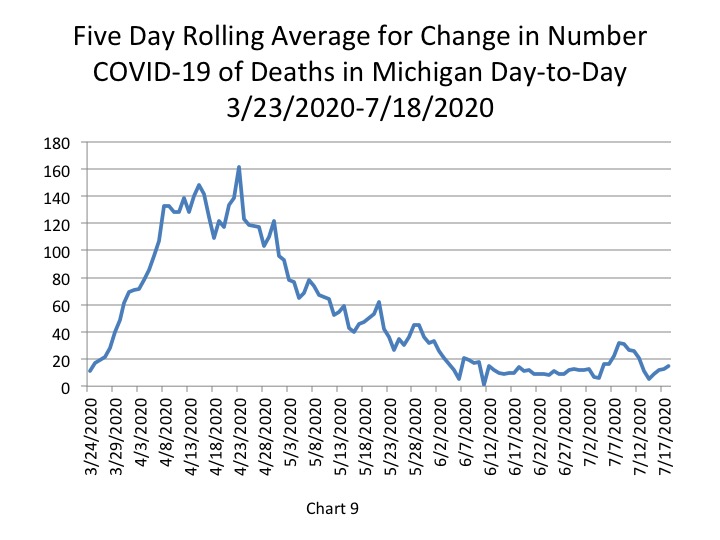
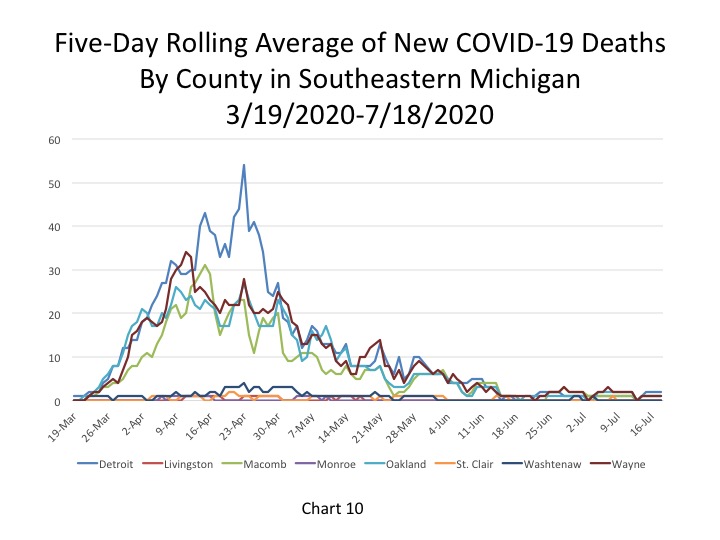
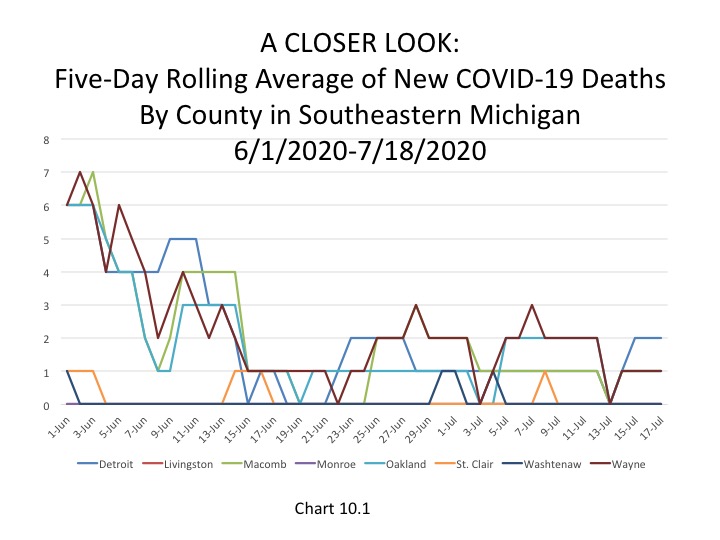
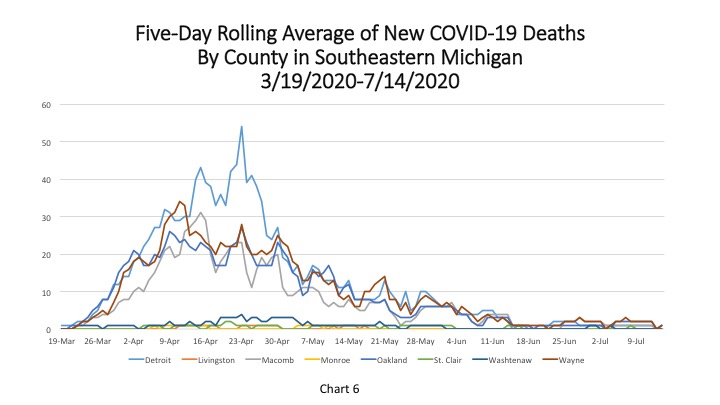
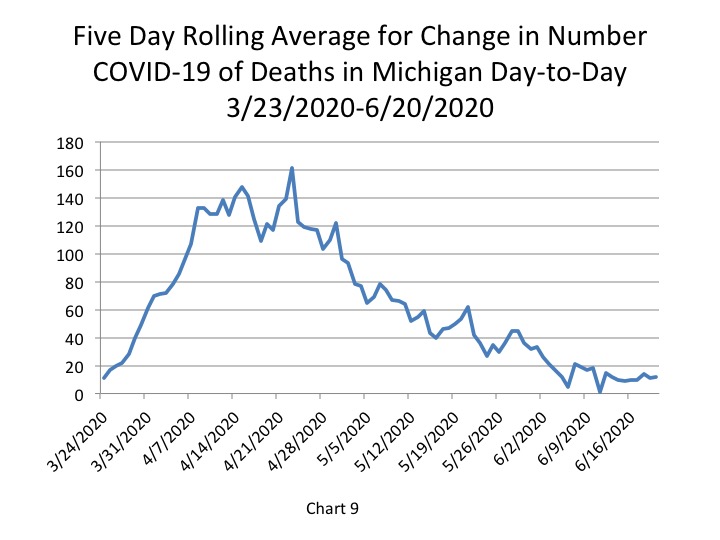
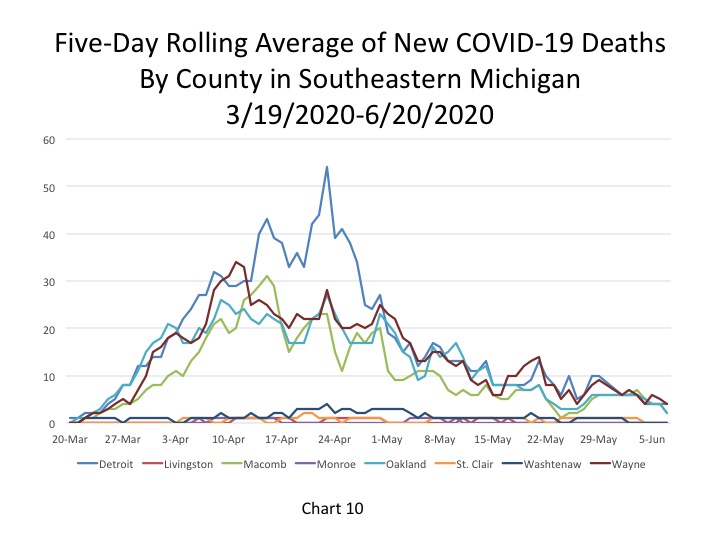
Chart 9, the five day rolling average of deaths, shows the number of new statewide deaths was reported at 15 on July 18. Furthermore, Chart 10 and Chart 10.1 shows how the number of deaths in Southeastern Michigan continues to remain low. Chart 10.1 shows a more in-depth look at the number of new daily COVID deaths in the last month so viewers can better discern where in the Southeastern Michigan the numbers are increasing, decreasing or remaining the same. Detroit reported 2 new daily deaths on July 18 while Macomb, Oakland and Wayne each reported 1.
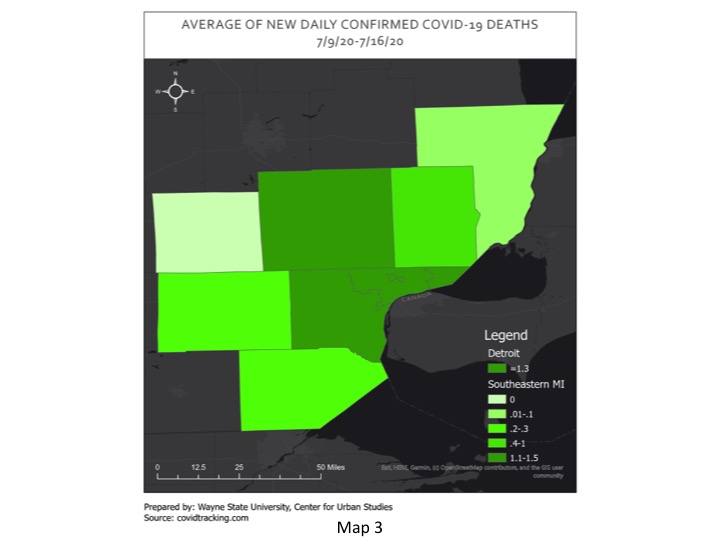
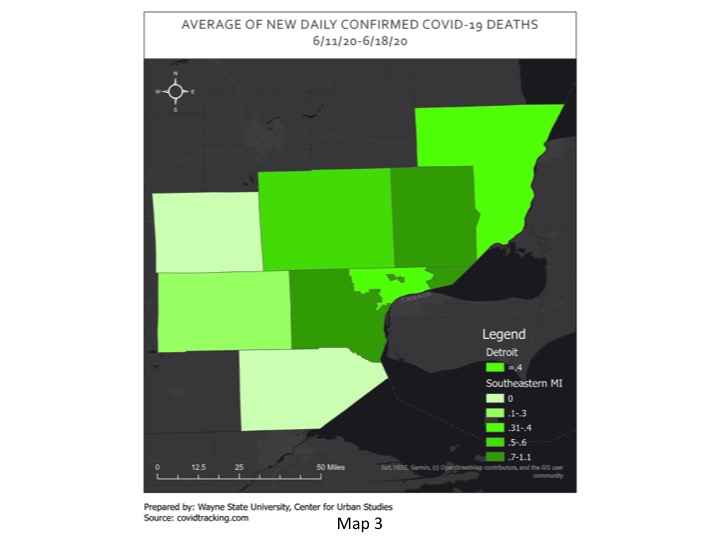
In Map 3, Wayne and Oakland counties had the highest average number of daily COVID deaths between July 9 and July 16 at 1.5 and Detroit averaged 1.3 deaths. Macomb County averaged 1 death during that time frame. The averages last week reported in the map are similar to the daily death numbers that have been being reported in Southeastern Michigan.
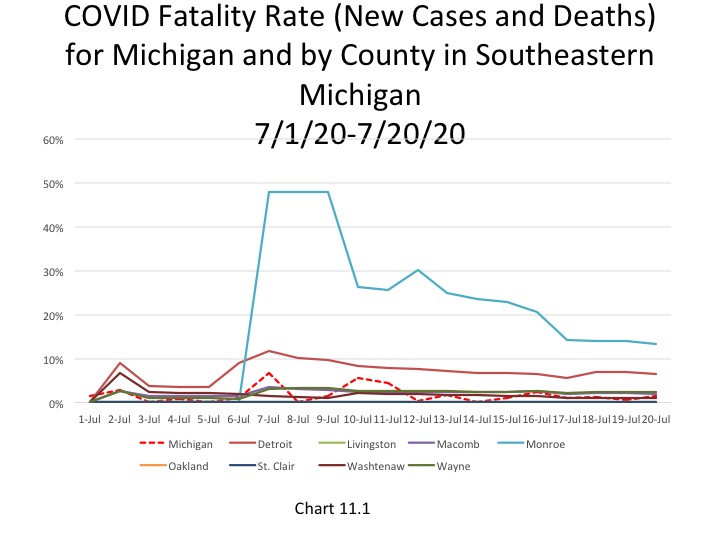
Chart 11.1 shows the fatality rate for just the month of July with the cumulative number of new cases and deaths for only this month. This chart was created in recognition that case and death numbers are lower than they were even a month ago and to highlight how even if case numbers spike death numbers continue to remain low. Using only July cumulative data for the new number of cases and deaths, Monroe County has recently had the highest fatality rate, which was reported at 13.4 percent on July 20, which is based on 13 new cumulative deaths since the beginning of July and 97 new cumulative cases. The overall fatality rate for most of the region is much higher than the new recent cumulative look we are exploring. For example, the City of Detroit had an overall fatality rate of 12 percent on July 20 but with a more recent look, which includes lower new daily case and death numbers, it was 6.45 percent (as shown in the chart below).
On July 20 the State of Michigan reported 489 new COVID cases, which is amongst the lowest daily total reported in about a week. With weekend numbers reaching close to 700, the decline is welcomed but also means we—as a State and a society—have a ways to go to get to a more manageable number of new daily case numbers.
The coronavirus pandemic has impacted the daily lives of everyone-from their work and school schedules to the way we obtain goods and services to how we recreate and interact with others. These changes directly relate to national and local mobility trends, especially since several Executive Orders in Michigan have either mandated or encouraged people to stay home and telecommute whenever possible.
The data we present here show the changes in mobility in Southeastern Michigan. These data were produced by Google, which is creating mobility reports for each State during this pandemic. The data presented below highlights the percent change in visits to places like grocery stores and parks in the seven counties that make up Southeastern Michigan. The list below is the percent change in mobility to these places between the first of April to mid-May for the State of Michigan. The maps below also reflect that timeframe and show the percent change in mobility trends at the county level for Southeastern Michigan compared to what baseline for mobility was to these places before the pandemic hit.
Shifts in Mobility Trends: Michigan
Residential: +8%
Workplaces: -28%
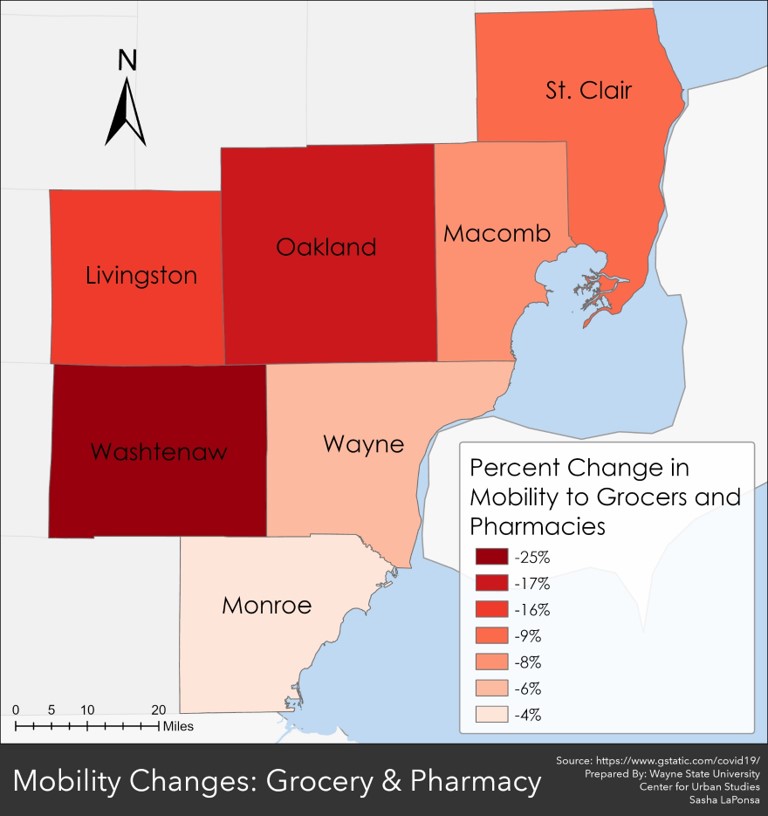
Grocery and pharmacy: -6%
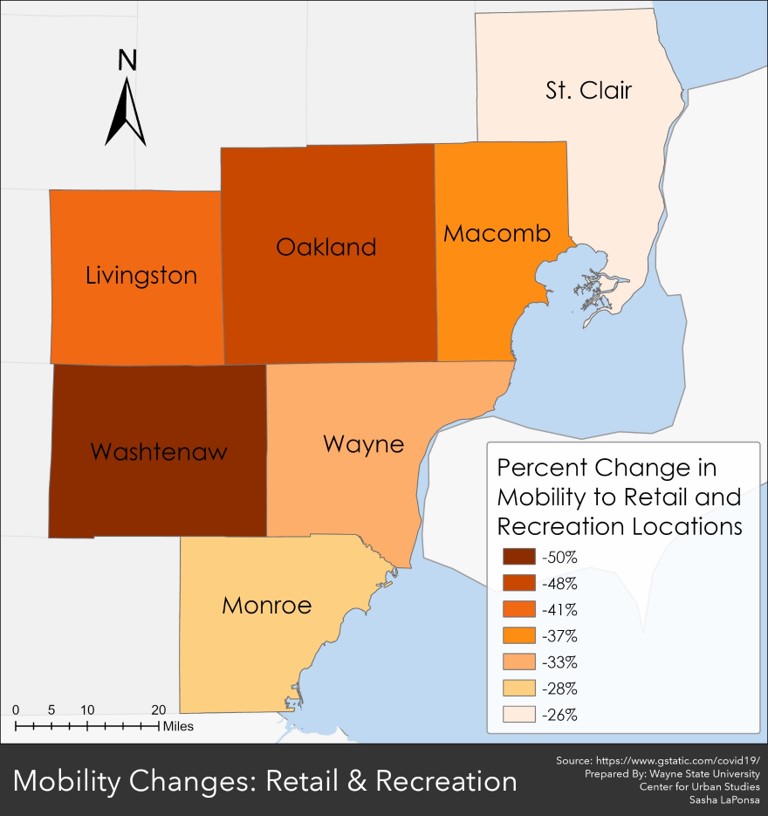
Retail and recreation: -34%
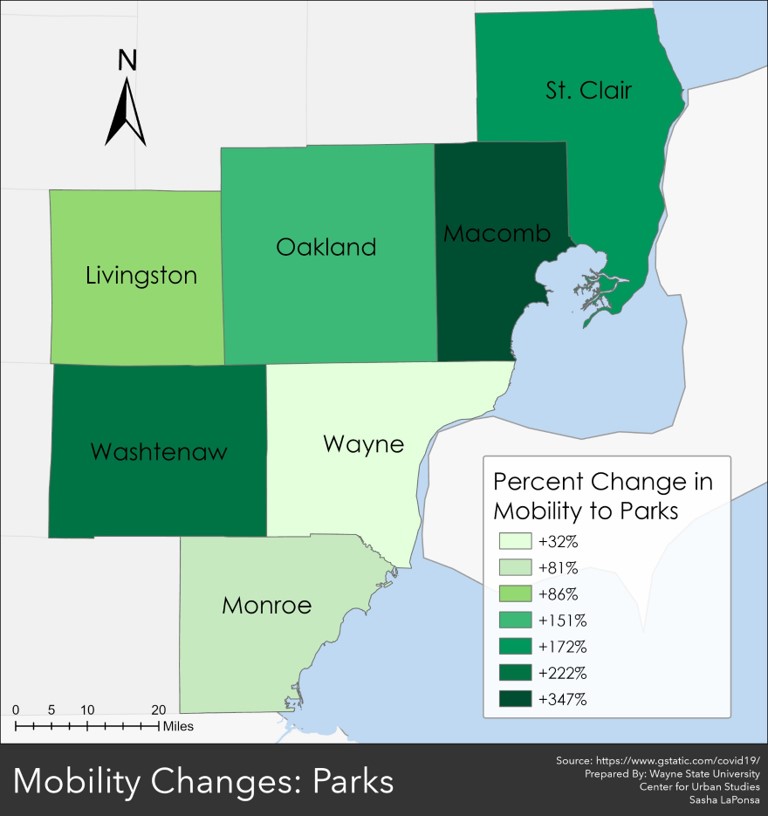
Parks: +180%
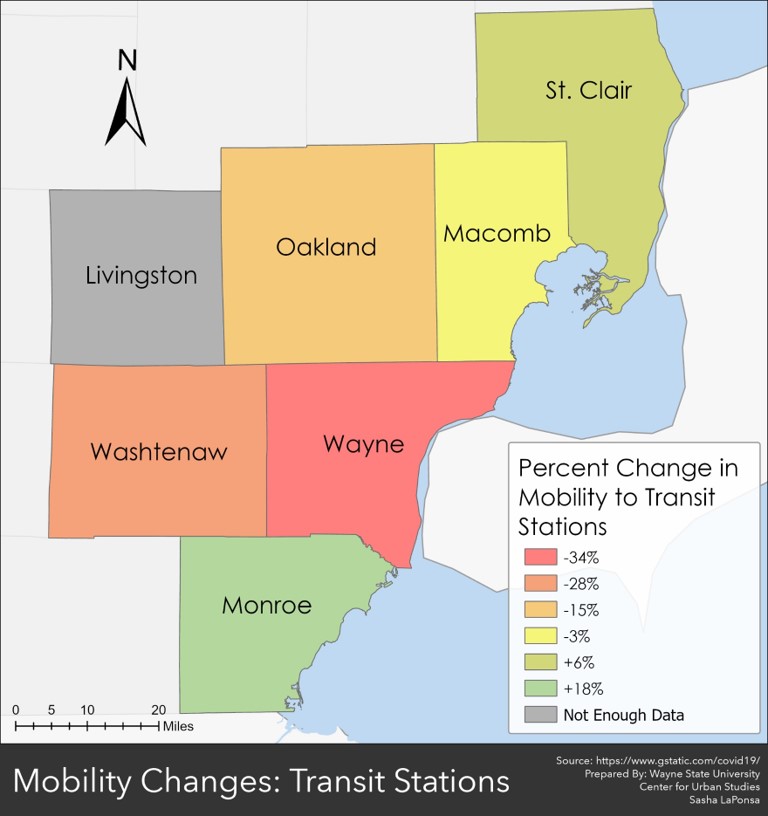
Transit stations:-24%
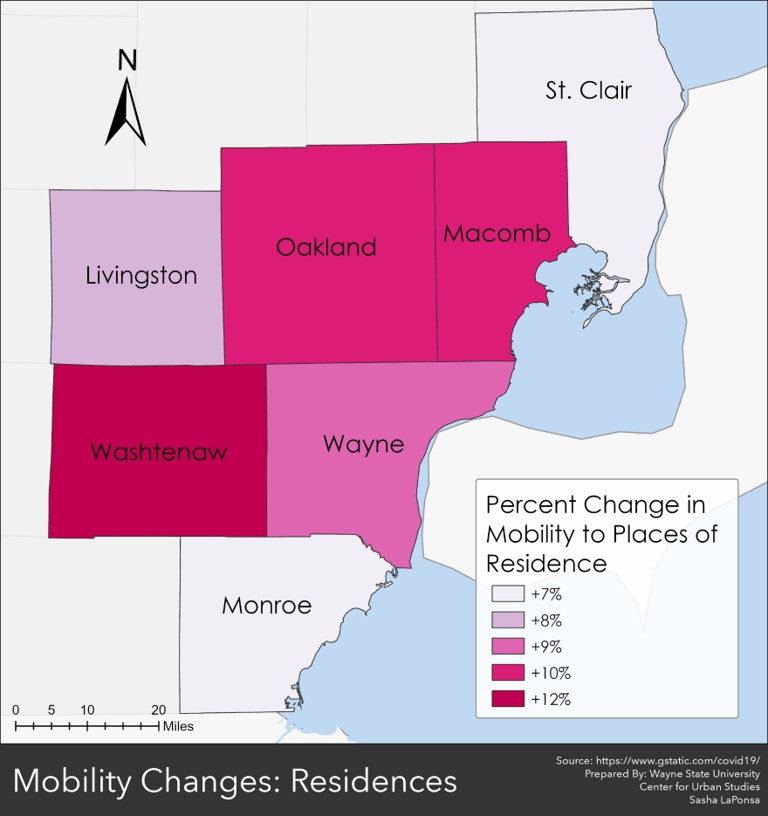
Places of Residence
With the coronavirus pandemic came a statewide lockdown, which mandated people only leave their homes for necessities and not to visit with anyone outside of their homes, unless they were an essential worker. However, even with the mandate there was an increase in mobility between residences, statewide and locally. Statewide, there was an 8 percent increase in mobility to residential homes, and in Southeastern Michigan there was between a 7-12 percent increase, depending on the county. Washtenaw County had the highest percent increase in mobility between residences at 12 percent; St. Clair County had the lowest percent change at 7 percent. In Wayne County there was a 9 percent increase in mobility between residences, and in Macomb and Oakland counties there was a 10 percent increase.
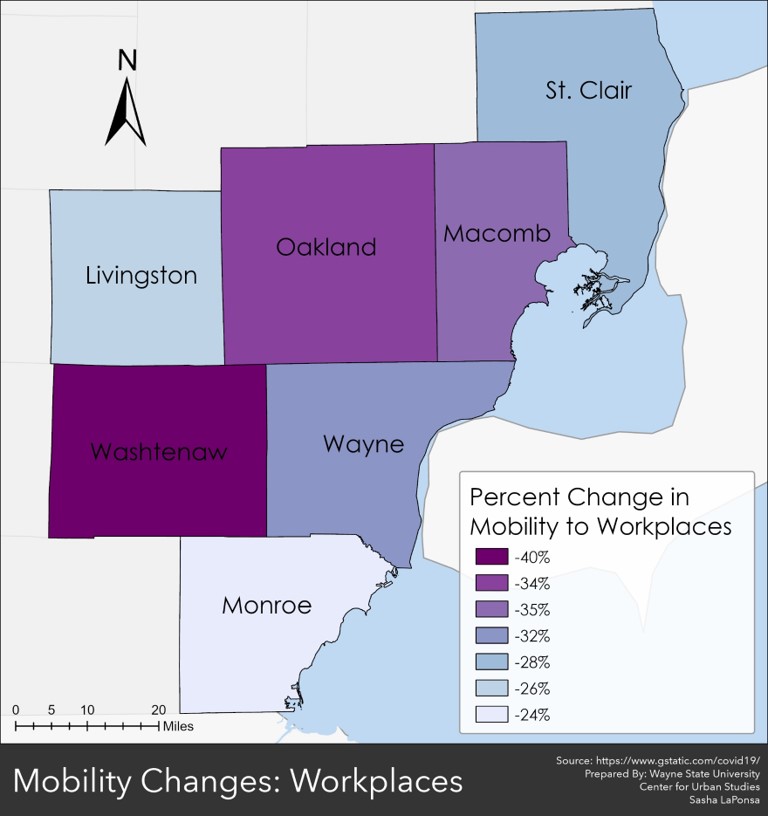
Workplaces
As noted, the Governor’s emergency orders throughout the pandemic have required certain places of business to close and for others to allow for telecommuting whenever possible. With such policy shifts came a decline in mobility to workplaces all throughout Michigan. At the State level there was a 28 percent decline from the normal amount of mobility to workplaces, and throughout Southeastern Michigan there was between a 24-40 percent decline in mobility to workplaces between the beginning of April and mid-May. Washtenaw County had the largest decline at 40 percent. In Wayne County there was a 32 percent decline in mobility to workplaces prior the coronavirus pandemic, in Oakland County there was a 36 percent decline, and in Macomb County there was a 35 percent decline. Monroe County had the smallest percent decline from the baseline at 24 percent.
Grocery Stores and Pharmacies
Between April and mid-May there was a decrease in mobility to grocery stores and pharmacies throughout Michigan, including in Southeastern Michigan. Washtenaw County experienced the largest decline at 25 percent while Monroe County’s shift was only 4 percent lower than the amount residents normally commute to these places. Although we witnessed bare shelves at the beginning of the pandemic, with certain product shortages continuing through today, the decline in mobility to these stores is not surprising as both consumers and businesses shifted to online and third party delivery services.
Retail and Recreation Locations
With the restrictions on business operations, including if they could even remain open to the public, it is also not surprising that at the State and local levels mobility trends have experienced a decline to retail and recreation locations. Washtenaw County again experienced the largest decline in mobility from the frequency residents were traveling before the pandemic to retail and recreation locations. According to the data, there was a 50 percent decline in commuting to retail and recreation locations for Washtenaw County. In Wayne County that decline was 33 percent, in Macomb County it was 37 percent, and in Oakland County it was 48 percent. At the State level there was a 34 percent decline from the baseline in the amount people traveled to retail and recreation locations.
Parks
Similar to the trend being experienced at the State level, all counties in Southeastern Michigan have experienced an increase in mobility to parks. Wayne County experienced the smallest percent change at 32 percent while Macomb County experienced the largest percent change at 347 percent. There were three counties-Macomb, St. Clair and Washtenaw – where mobility to parks increased at a higher rate than the mobility rate increase at the State level (180 percent).
Transit Stations
The data also shows that there was a decrease in mobility to transit stations throughout most of Southeastern Michigan, but not the entire region. In Monroe and St. Clair counties there was an 18 and 6 percent increase in mobility, respectively. In Wayne County, which provides public transportation via both the Detroit Department of Transportation and the Southeastern Michigan Authority of Regional Transit (SMART) mobility to these stations decreased by 34 percent. There are also communities in Oakland County and all of Macomb County that offers public transportation via SMART; mobility to these stations declined by 15 percent and 3 percent, respectively. In Washtenaw County, where there is also a local transportation system, mobility to these stations declined by 28 percent. There was a 24 percent decline in mobility to transportation stations at the State level.
Overall, this data provides a glimpse into how the coronavirus pandemic has shifted certain aspects of our everyday ways of life. These current shifts could lead to long-term policy changes as we as a state and a nation are seeing that telecommuting, road diets and contactless shopping, among other changes, are possible. Pros and cons can be argued for the long-term impacts of such changes, however, decreases in commuting does mean a decline in certain pollutants being emitted, which is environmentally beneficial and a shift we need to implement for the long-term viability of this planet.
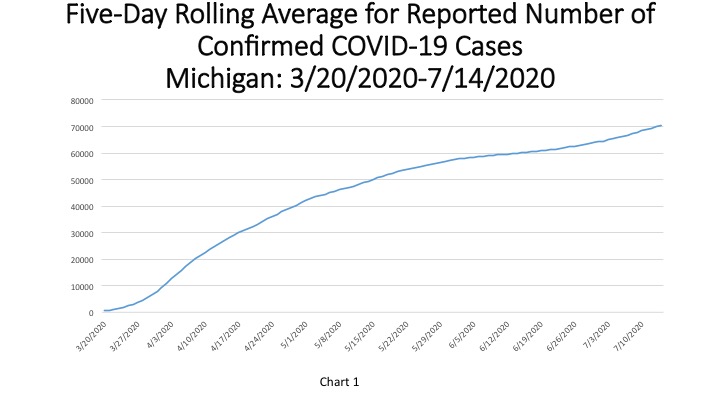
Michigan, like many states throughout the U.S., continues to see new confirmed daily COVID case numbers that are higher than what was reported less than a month ago. On July 16, the State of Michigan reported 71,842 total COVID cases, an increase of 645 cases from the day prior. In terms of the number of new daily cases, the 645 reported on July 16 was a decrease from the 891 new cases reported on July 15. Also, of the 645 new COVID cases, 324 were documented in Southeastern Michigan. In total, 50 percent of the new COVID cases were in Southeastern Michigan. Up until the last few days, in recent weeks majority of the new case numbers in Michigan were occurring outside of Metro-Detroit region. In Chart 1 we show that the State total for the number of COVID cases on July 14 was 70,481–a five-day rolling average. The five-day rolling average for the total number of COVID cases (Chart 1) reflects a smoother curve and adjusts for fluctuations in testing and/or the quality of reporting or failure to report. A closer look at Chart 1 shows how the once flattened curve has been increasing at a higher rate since late June, with case numbers now about 70,000.
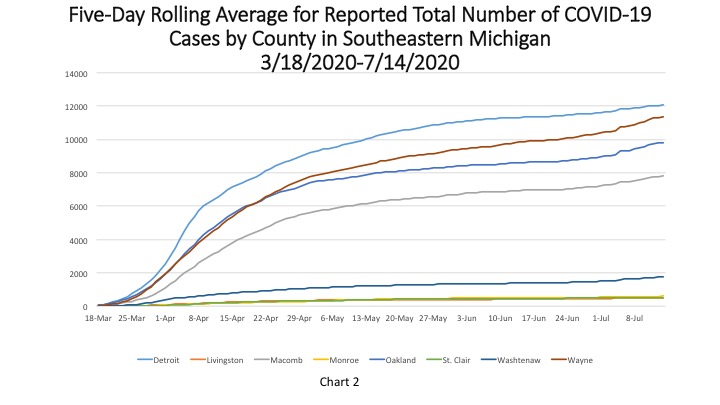
Chart 2 shows that, based on the five-day rolling averages, the growth of new COVID cases in Southeastern Michigan continues to increase, with noticeable upticks particularly in Wayne and Oakland counties. On July 14 Wayne County reported 11,323 confirmed COVID cases and Oakland County reported 10,063. Between June 24 (when new case numbers began to rise again) and July 14 Wayne County reported 1,260 new cases and Oakland County reported 1,043 new cases. On July 14, Detroit, which still has the highest total number of confirmed COVID cases, reported 11,461 cases. However, since June 24 Detroit has reported about half of the new number of COVID cases that Wayne County has. Between June 24 and July 14 Detroit reported 584 new cases. On July 14 Macomb County reported 7,784, an increase of 753 new cases since June 24.
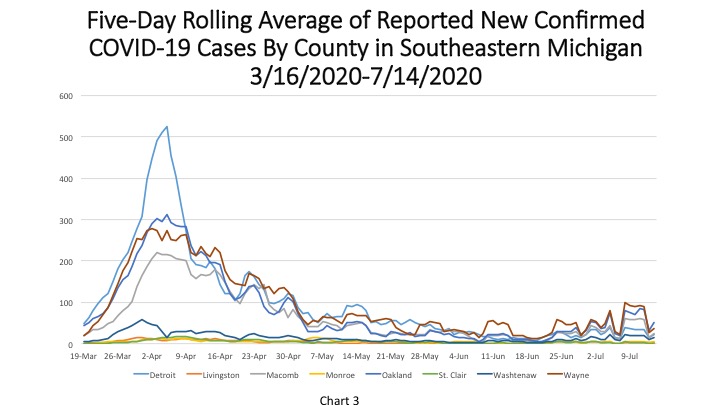
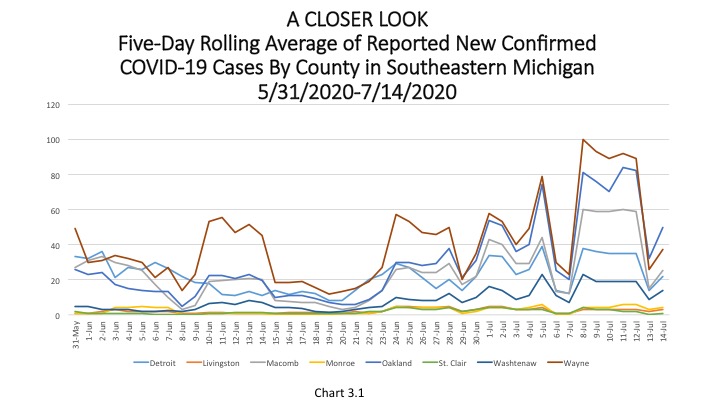
As noted, new daily COVID case numbers have been increasing at a faster rate in July than in June. The two five-day rolling average charts below (Chart 3 and Chart 3.1) show that up through early June daily COVID case numbers were declining, but since about June 24 those numbers have been on the rise. A little over a week ago is when daily case numbers really began to spike. However, on July 14 there was a decline from the number of new daily cases reported by the State from the days prior; this is on trend with the fact that the State of Michigan had a lower number of new COVID cases than the previous day. Oakland County had the highest number of new daily cases on July 14 at 50, with Wayne County following at 37. Detroit reported 22 new cases and Macomb County reported 25 new cases.
While the number of new daily COVID cases has been experiencing an overall increase over the last few weeks, the cumulative number of COVID deaths has remained low and fairly stagnant. The State reported on July 16 there was a cumulative total of 6,101 COVID deaths, an increase of 16 deaths from the day prior. Of those 16 deaths, 13 were added to the daily count as a result of death certificates being compared with the State’s COVID database. Additionally, of those 16 total deaths, 12 were reported out of Southeastern Michigan.
In Chart 4, the five-day rolling average for the number of deaths in Michigan, shows the number of deaths in the State of Michigan continued to slowly inch toward 6,081.
Chart 5 (a 5-day rolling average) further hones in on how majority of the COVID deaths in Michigan have occurred, and continue to occur, in Southeastern Michigan. On July 14, the City of Detroit reported 1,459 deaths. Wayne County had the second highest total at 1,185 deaths on July 14.
Chart 6, the five day rolling average of deaths, shows the number of new statewide deaths was reported at 5 on July 14. Furthermore, Chart 7 and Chart 7.1 shows how the number of deaths in Southeastern Michigan continues to remain low, with a noticeable decrease beginning to occur on June 15. Chart 10.1 shows a more in-depth look at the number of new daily COVID deaths in the last month so viewers can better discern where in the Southeastern Michigan the numbers are increasing, decreasing or remaining the same. Detroit, Macomb, Oakland and Wayne counties each reported 1 new death on July 14; these were the only new deaths reported in the region. As Chart 10.1 highlights, no more than 7 new daily deaths have been reported since June 1 and those numbers have not reached above 3 since July 7. Due to Detroit and Wayne County reporting the same numbers on some dates it may appear that the Detroit line does not go all the through, however this is just due to the fact that the Wayne County data points are the same.
Michigan has not been immune to the national trend of confirmed daily COVID case increases. With new daily numbers hovering above 400, and beyond, for the last week we have seen Gov. Gretchen Whitmer roll back on her re-opening plan and institute a public face mask mandate to help ensure residents’ safety and a decline in the spread of the virus. However, neither can be ensured if the public doesn’t adhere to the laws and standards set forth by local, state and federal government agencies.
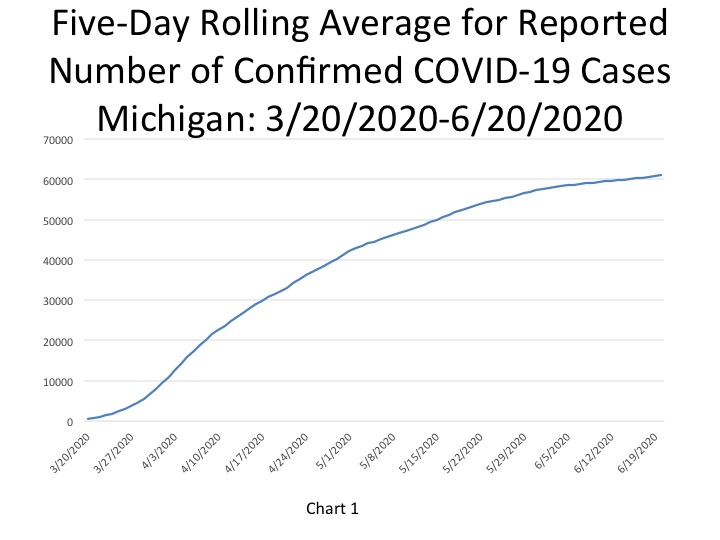
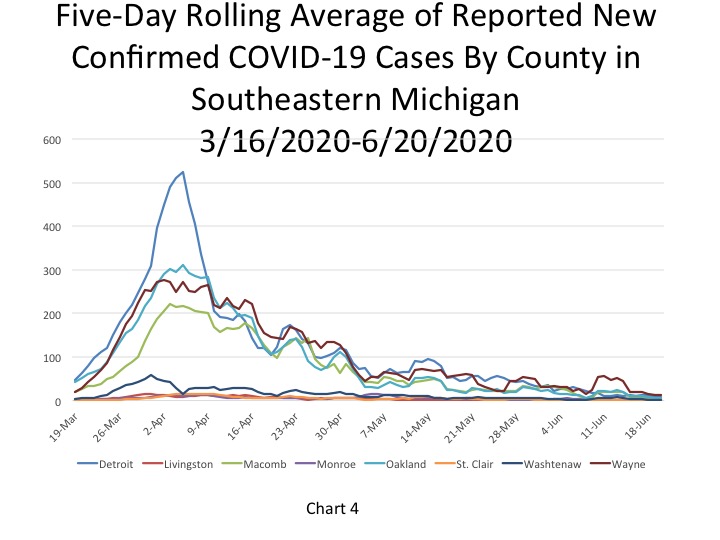
The number of COVID cases in Michigan has flattened over the last several months, but as daily data show new cases continue to be reported. On June 22, the State of Michigan reported a total of 61,609 cases, an increase of 179 cases from the day prior. The daily total was equivalent to 615 cases per 100,000 people (Chart 4). Of those 179 cases, 61 were documented in Southeastern Michigan. In total, 34 percent of the new COVID cases were in Southeastern Michigan, meaning case numbers are increasing at a higher rate outside of the region than locally. In Chart 1 we show that the State total for the number of COVID cases on June 20 was 61,034–a five-day rolling average. The five-day rolling average for the total number of COVID cases (Chart 1) reflects a smoother curve and adjusts for fluctuations in testing and/or the quality of reporting or failure to report. This continues to be important as the State of Michigan regularly updates its past COVID data and not all State changes can continuously be updated here.
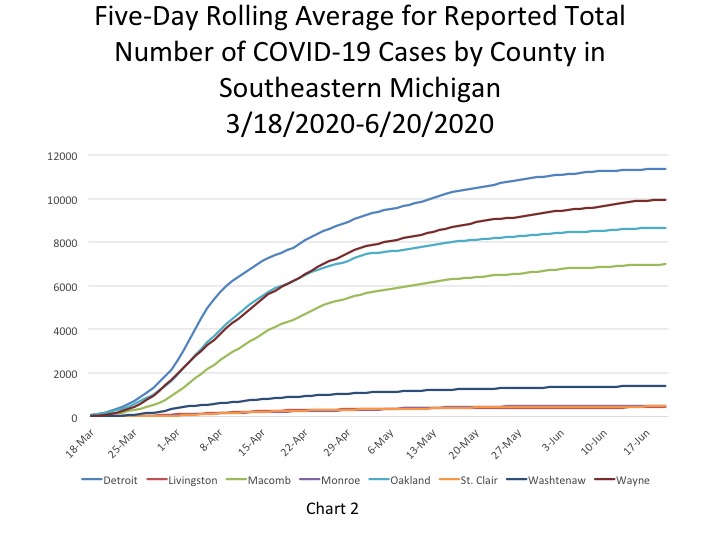
Chart 2 shows that, based on the five-day rolling averages, the growth of new COVID cases in Southeastern Michigan has been increasing at a much slower pace compared to previous months. However, Detroit and Wayne, Oakland and Macomb counties continue to add cases. On June 20 the number of cases in Detroit reached 11,376, the highest in the region, and Wayne County reported the second highest number of cases at 9,946. On June 20, the five-day rolling average for the number of COVID cases in Oakland County was 8,864, and Macomb County reported 6,974.
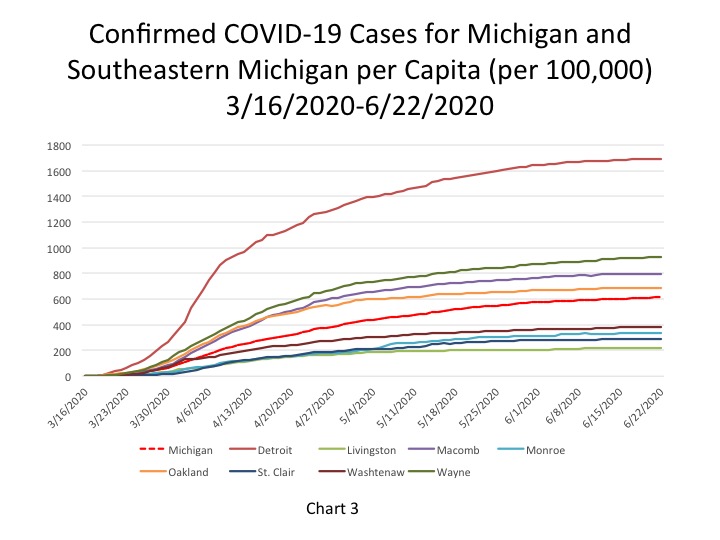
The City of Detroit had 1,694 COVID cases per 100,000 people as of June 20, an increase from 1,692 on June 19 (Chart 3). This is based upon a reported increase of 13 new COVID cases since June 19, bringing the total number of COVID cases in Detroit to 11,394. Wayne County reported 926 cases per 100,000 people, and Oakland County had 690 cases per 100,000 people. These per capita rates were based upon 9,970 total cases for Wayne and for 8,674 Oakland. Macomb County reported 799 cases per 100,000 people, which is based upon 6,983 cases.
The daily data highlighted in these posts is from Michigan.gov/coronavirus, where data is updated daily at 3 p.m. Historical data were supplied from covidtracking.com, which republishes COVID data from the State. Additionally, the case totals do not reflect the number of people who have recovered, just those who have been infected. In early June the State changed how it reports its data on the website, making data more accurate in the long-term but more complicated to track as well. The State regularly updates older data and as we continue to publish regular updates on COVID the State’s changes to past data many not always be reflected in our posts. The data published in new posts is accurate for the day we received it on though.
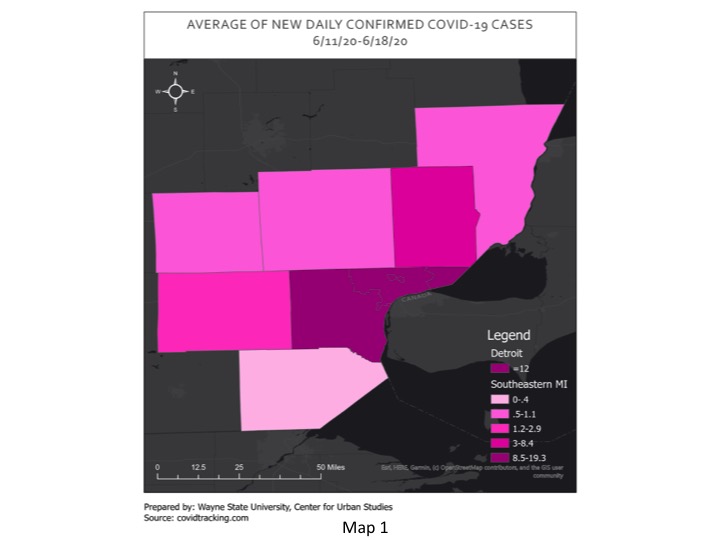
Chart 4 shows that Wayne County reported the highest number of daily cases, according to the five-day rolling average, at 13 on June 20. Detroit reported 8 new daily cases while Oakland County reported 6 and Macomb County reported 3. As Map 1 shows, Detroit and Wayne and Macomb counties all reported a lower number of new daily cases on June 20 than what the average was for last week (June 11-18). For example, last week Detroit averaged 12 new COVID cases and on June 20 it reported 8. Oakland County though had an average of 0.6 new cases last week and reported 6 new cases on June 20 through 5-day rolling average calculations. So, while there are signs the number of new cases are declining regionally, the data also shows that nowhere is immune from having its numbers increase again.
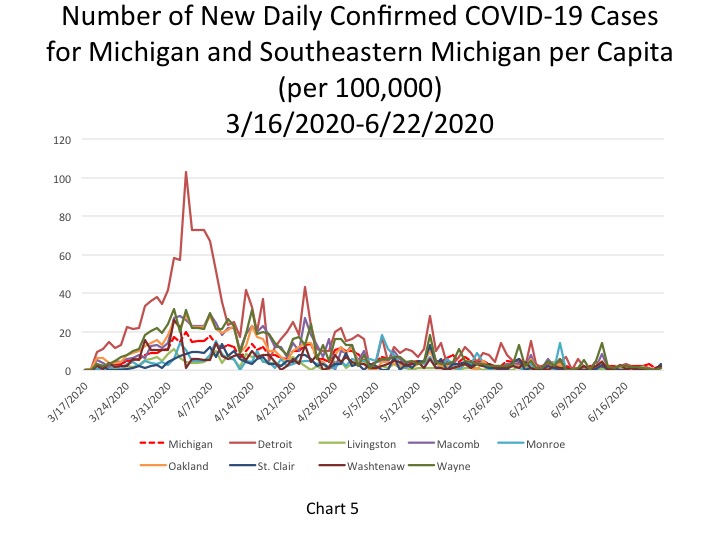
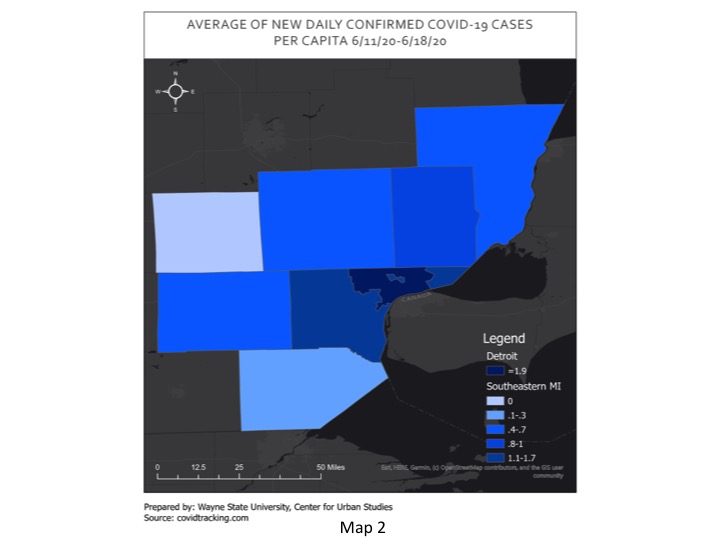
On June 22, the per capita rate for the number of new daily COVID cases per 100,000 people was 2 for the State, which was equivalent to 179 new cases. On June 22, Detroit and Monroe and Washtenaw counties all reported the same per capita rate for the number of new daily COVID cases per 100,000 people as the State-2. Detroit’s per capita rate of 2 was equivalent to 13 new cases per 100,000 people, based on an actual number of cases. St. Clair County reported a per capita rate of 3 and the remaining counties all reported per capita rates of 1. Wayne County’s per capita rate of 1 was equivalent to 22 new cases, the highest in the region that day. The second map below (Map 2) shows that while Detroit’s per capita rate on June 22 is on par with its average rate for the number of new daily COVID cases per 100,000 people for the week of June 11-18, St. Clair County is experiencing higher numbers this week than last. St. Clair County had a per capita rate of 3 on June 22 and an average per capita rate of 0.8 last week.
Chart 4 shows that Wayne County reported the highest number of daily cases, according to the five-day rolling average, at 13 on June 20. Detroit reported 8 new daily cases while Oakland County reported 6 and Macomb County reported 3. As Map 1 shows, Detroit and Wayne and Macomb counties all reported a lower number of new daily cases on June 20 than what the average was for last week (June 11-18). For example, last week Detroit averaged 12 new COVID cases and on June 20 it reported 8. Oakland County though had an average of 0.6 new cases last week and reported 6 new cases on June 20 through 5-day rolling average calculations. So, while there are signs the number of new cases are declining regionally, the data also shows that nowhere is immune from having its numbers increase again.
On June 22, the per capita rate for the number of new daily COVID cases per 100,000 people was 2 for the State, which was equivalent to 179 new cases. On June 22, Detroit and Monroe and Washtenaw counties all reported the same per capita rate for the number of new daily COVID cases per 100,000 people as the State-2. Detroit’s per capita rate of 2 was equivalent to 13 new cases per 100,000 people, based on an actual number of cases. St. Clair County reported a per capita rate of 3 and the remaining counties all reported per capita rates of 1. Wayne County’s per capita rate of 1 was equivalent to 22 new cases, the highest in the region that day. The second map below (Map 2) shows that while Detroit’s per capita rate on June 22 is on par with its average rate for the number of new daily COVID cases per 100,000 people for the week of June 11-18, St. Clair County is experiencing higher numbers this week than last. St. Clair County had a per capita rate of 3 on June 22 and an average per capita rate of 0.8 last week.
In Chart 6, the five-day rolling average for the number of deaths in Michigan shows how they have leveled off during the month of June. On June 20 there were 5,837 deaths (an increase of 12 deaths from the day prior). The actual cumulative COVID-19 deaths on June 22 was 5,853, an increase of 7 deaths from the prior day. Of those deaths that occurred, 4 were in Southeastern Michigan.
Chart 7 (a 5-day rolling average) further reflects how the number of deaths has leveled off in the State and Southeastern Michigan. On June 20 the City of Detroit reported 1,428 deaths, and while it is still the highest number in the region, that number has only increased by 25 total deaths since June 8. Wayne County had the second highest total at 1,141 deaths on June 20; Wayne County had 1,120 deaths on June 8.
The per capita rates for the number of total COVID deaths in Southeastern Michigan remained the same for each entity on June 22; these rates have all remained the same since June 14. Detroit reported 212 total COVID deaths per 100,000 people (1,428 deaths), Wayne County reported a per capita rate of 106 (1,143 deaths), Macomb County reported a per capita rate of 99 (862 deaths) and Oakland County reported a per capita rate of 82 (1,037 deaths).
Chart 9, the five day rolling average of deaths, shows the number of new statewide deaths was reported at 12 on June 20, an increase from the 11 new deaths reported the day before. While the number new statewide deaths did slightly increase on June 20, the overall number has not gone above 18 since June 10. In mid-April the number of new deaths in Michigan reached a peak at 145. Furthermore, Chart 10 shows how the number of deaths in Southeastern Michigan continues to decline, a trend we are eager to see continue. Oakland and Wayne counties each reported 1 new death, the highest in the region. These numbers are based on 5-day rolling averages. As the map below shows, Detroit and each county in the region experienced a decrease in the number of deaths from June 20 and the average number of deaths last week. Wayne County had the highest average number of deaths from the week of June 11 to 18 at 1.1, and on June 20 it was reported at 1. Detroit averaged 0.4 deaths last week and reported 0 new deaths on June 20.
While we know that the number of COVID cases and deaths has decreased throughout the month of June we also continue to see spikes in new cases periodically in different areas throughout the State. For example, note how majority of the number of new cases reported in Michigan on June 22 were from outside the State’s most populate region. Additionally, Southeastern Michigan has been the last area in the State to loosen restrictions. Overall, Michigan has experienced a recent uptick in the number of new cases. According to Mlive, the seven average for new COVID cases this week is 192 and last week it was 152. So, while the data shows that the curve has certainly flattened it also reflects how abiding by health recommendations set forth by the Centers for Disease Control plays a large role in flattening that curve.
On June 1, Gov. Gretchen Whitmer lifted the Stay-at-Home Order and several restrictions for retail, restaurants and bars and other businesses because the State has seen a serious improvement in the number of new daily cases and deaths, meaning the curve has flattened.
According to the State of Michigan, the total number of COVID cases in Michigan rose to 57,532 on June 1, an increase of 135 cases from the previous day. The daily total was equivalent to 576 cases per 100,000 people (Chart 4). Of those 135 cases, 57 were documented in Southeastern Michigan, which was equal to 42 percent of the new cases. In Chart 1 we show that the State total for the number of COVID cases on May 30 was 56,890–a five-day rolling average. The five-day rolling average for the total number of COVID cases (Chart 1) reflects a smoother curve and adjusts for fluctuations in testing and/or the quality of reporting or failure to report.
Chart 2 shows that, based on the five-day rolling averages, the growth of new COVID cases in Southeastern Michigan continued to level off for the counties in the region, likely one of the many factors as to why Whitmer decided to moved forward in lifting the Stay-at-Home Order. On May 30, the number of cases in Detroit reached 10,974, the highest in the region, and Wayne County reported the second highest number of cases at 9,307. On May 30, the five-day rolling average for the number of COVID cases in Oakland County was 8,343, and Macomb County reported 6,646.
The City of Detroit had 1,644 COVID cases per 100,000 people as of June 1, an increase from 1,641 the day before (Chart 3). This is based upon a reported increase of 17 new COVID cases, bringing the total number of COVID cases in Detroit to 11,058. Wayne County reported 872 cases per 100,000 people, and Oakland County had 669 cases per 100,000 people. These per capita rates were based upon 9,388 total cases for Wayne and for 8,407 Oakland. Macomb County reported 767 cases per 100,000 people, which is based upon 6,707 cases.
The daily data highlighted in these posts is from Michigan.gov/coronavirus, where data is updated daily at 3 p.m. Historical data were supplied from covidtracking.com, which republishes COVID data from the State. Additionally, the case totals do not reflect the number of people who have recovered, just those who have been infected.
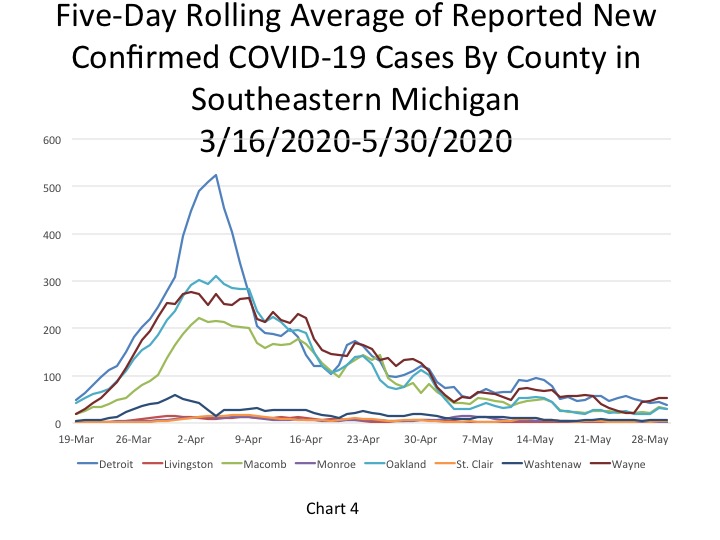
Chart 4 shows that Wayne County, among the units covered here, reported the highest number of daily cases at 52 on May 30 and Detroit reported 37 new cases. The numbers reported in this chart reflect a five-day rolling average.
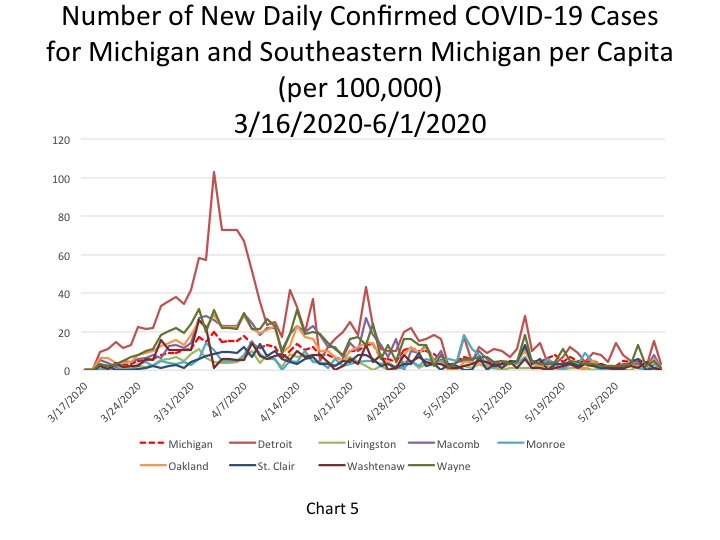
On June 1, the per capita rate for the number of new daily COVID cases per 100,000 people was 1 for the State, which was equivalent to 135 new cases. The State’s June 1 per capita rate was a decrease from the day prior, which is when the number of new cases nearly doubled. Just as the State’s per capita rate dropped so did the City of Detroit’s. On May 31, Detroit reported 14 new COVID cases per 100,000 people, and on May 1 it reported a rate of 3. Detroit’s increased rate was equivalent to 17 new cases (Chart 5). Wayne County reported 1 new COVID case per 100,000 people, which was equivalent to 14 new cases. Oakland and Macomb counties also each reported per capita rates of 1 new case per 100,000 people on June 1, which were equivalent to 11 and 12 new cases, respectively. Overall, 57 new COVID cases were reported in Southeastern Michigan on June 1. This is a decline of 263 from the day prior.
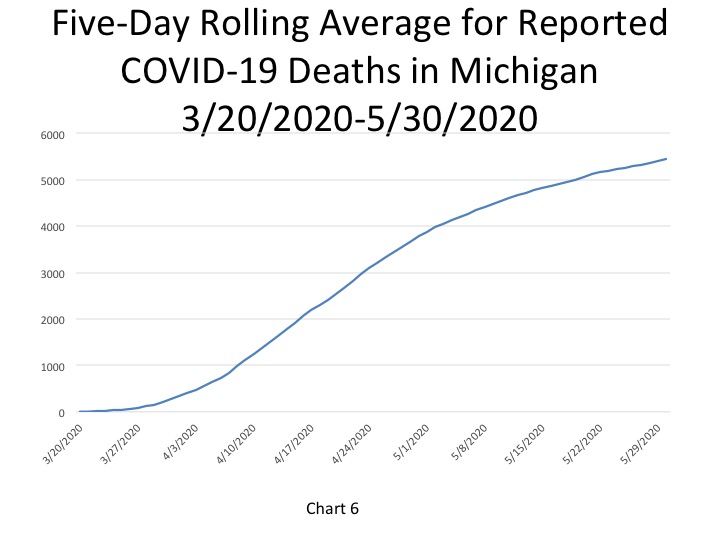
In Chart 6, the five-day rolling average for the number of deaths in Michigan shows a continuing slow increase (a lagged number of 5,450 deaths, an increase of 36 deaths). The actual reported COVID-19 deaths on June 1 was 5,516, an increase of 25 deaths from the day prior. Of those 25 deaths Southeastern Michigan accounted for 12 of them.
Chart 7 (a 5-day rolling average) portrays how Detroit continues to report the highest cumulative number of deaths at 1,365 on May 30. Wayne County had the second highest total at 1,077 on May 30.
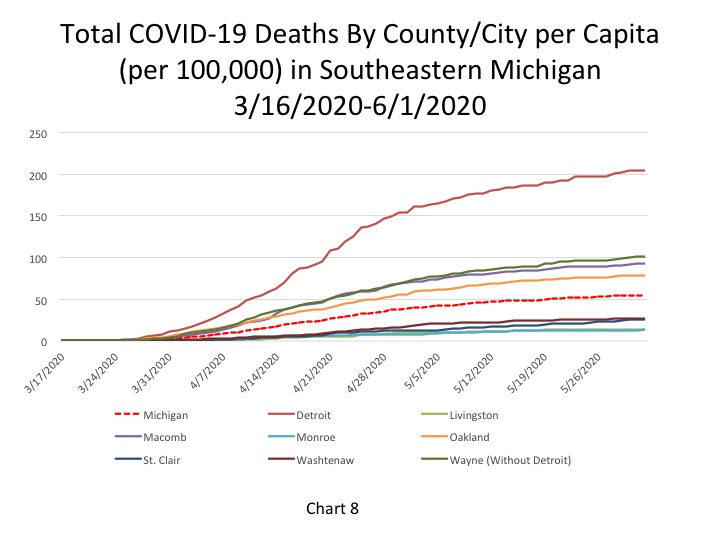
Chart 8 portrays the total number of COVID deaths per 100,000 people on June 1. The cumulative total of COVID deaths per 100,000 people remained the same for Detroit and all the counties in the region due to the small increases in the number of deaths, which totaled 12 for all of Southeastern Michigan. In Detroit the per capita rate remained at 204 (representing 1,375 deaths). In Wayne County there were 101 COVID deaths per 100,000 people (1,088 total deaths). In Oakland County there were 79 deaths per 100,000 people (988 total deaths), and in Macomb County there were 93 COVID deaths per 100,000 people (814 total). Macomb County had the highest single day death count in Southeastern Michigan on June 1; 4 COVID deaths were reported. The State of Michigan had 55 COVID deaths per 100,000 people, which was equal to 5,516 total deaths. The State’s per capita rate did increase by 1.
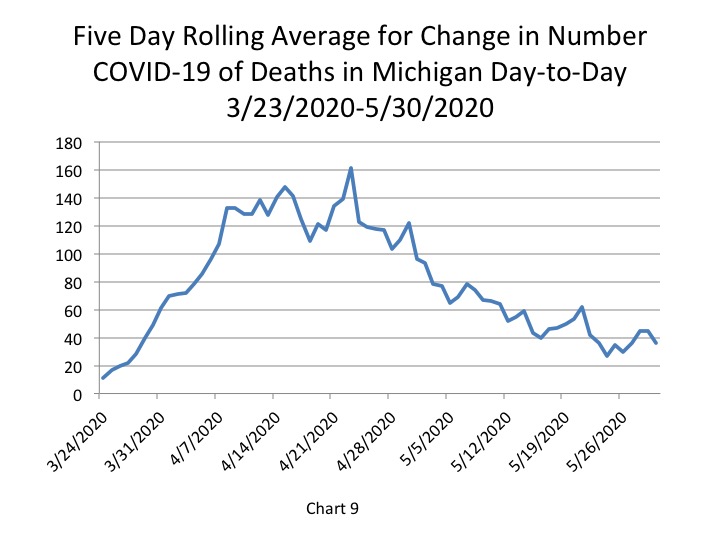
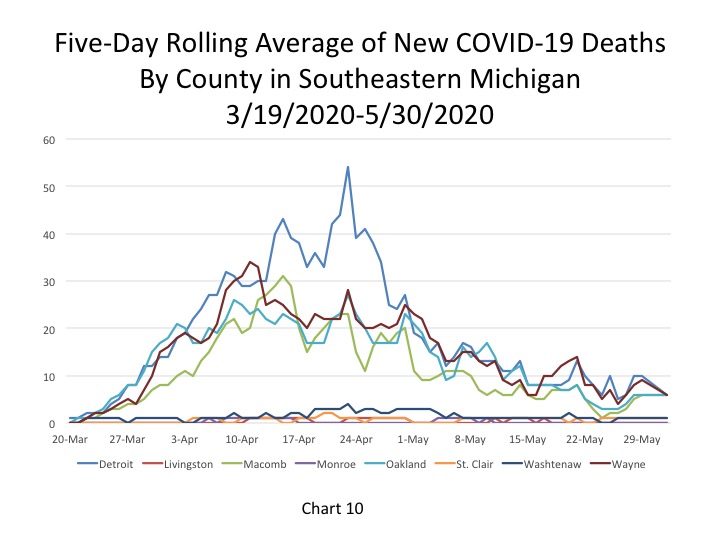
Chart 9, the five day rolling average of deaths, shows the number of new statewide deaths declined to 36 on May 30. Furthermore, Chart 10 shows how the number of deaths in Southeastern Michigan declined. Detroit reported 6 daily COVID deaths, as did Wayne, Oakland and Macomb counties on May 30. The 6 daily deaths in each of those three counties and Detroit were the highest reported in the region. These numbers are based on five-day rolling averages.
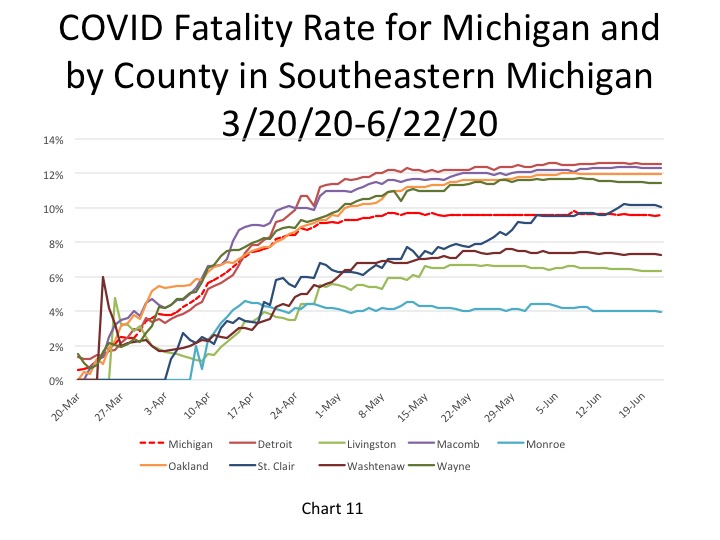
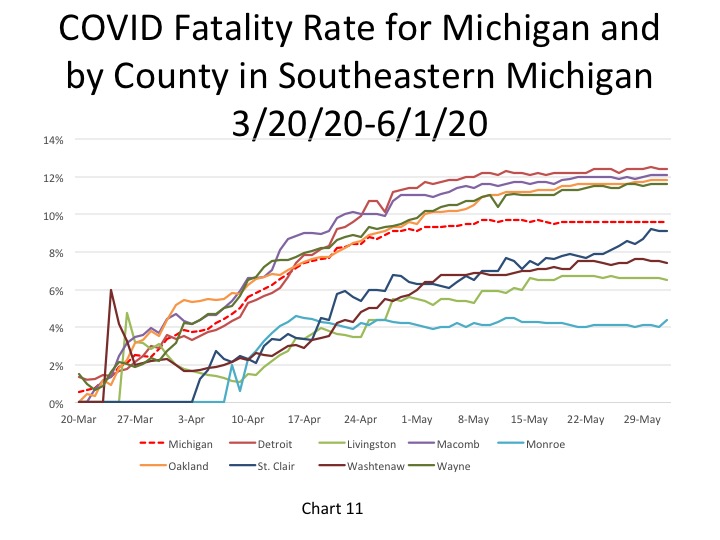
The fatality rate trends continued in Southeastern Michigan on June 1 with the State reporting a fatality rate of 9.6 percent for two weeks straight, Detroit continuing to report a fatality rate of 12.4 percent and Macomb County reporting a fatality rate of 12.1 percent for another day.
One reason we may be seeing such high fatality rates in Michigan is due to the low testing rates. When only having-presumably-a lower of number confirmed COVID cases than is actually likely due to the limited availability of tests, the fatality rate appears higher because the base comparison is smaller than it might be.
Although the Stay-at-Home Order has been lifted and business restrictions have been loosened to the point where many can open with capacity limitations, there are still concerns of a second wave. This is why policies to wear masks inside and work from home when possible are still encouraged. We must find a balance to ensure the health and safety of our communities remain a priority while opening the economy.
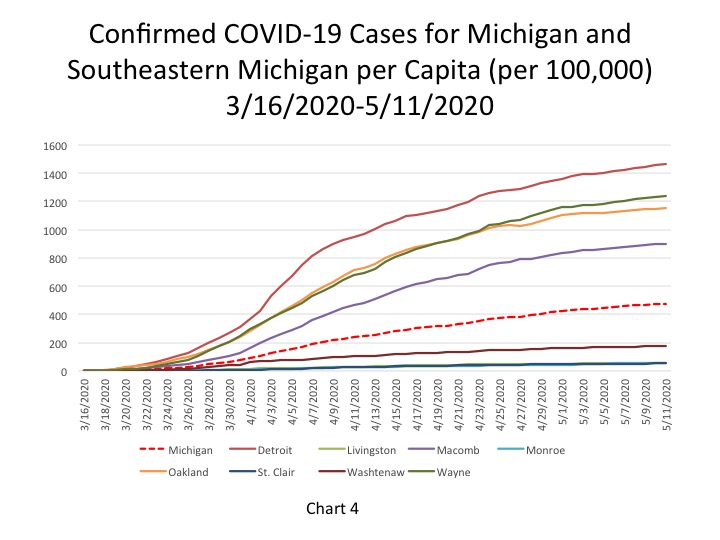
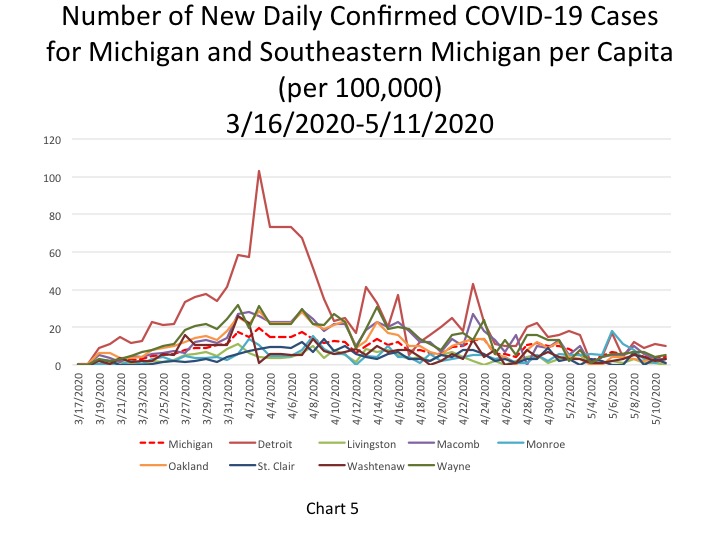
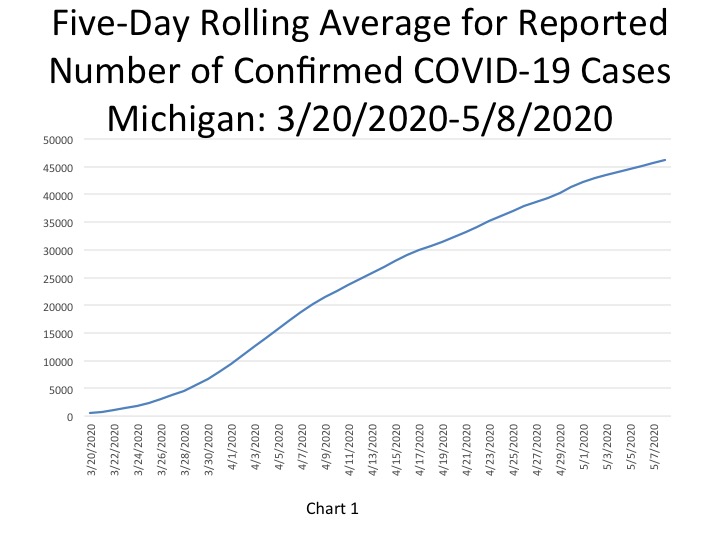
According to the State of Michigan, the total number of COVID cases in Michigan rose to 47,552on May 11, an increase of 414 cases from the previous day. This total was equivalent to 476 cases per 100,000 people (Chart 4). The five-day rolling average for the total number of COVID cases (Chart 1) reflects a smoother curve and adjusts for fluctuations in testing and/or the quality of reporting or failure to report. That upward trend of the curve has been flattening in recent weeks as the number of new COVID cases, both throughout the State and regionally, gradually declines. In Southeastern Michigan, Detroit reported the highest number of daily cases at 63 on May 9; this was a decline from the day before (Chart 3). Note that this five day rolling average causes these daily case and daily death charts to lag two days behind.
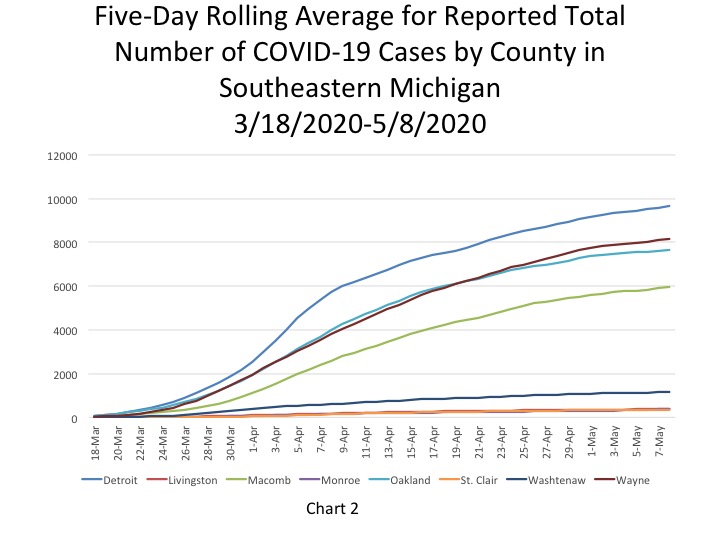
Chart 2 shows that over the last several days, based on the five-day rolling averages, the number of new COVID cases in Southeastern Michigan has remained fairly consistent, allowing the curve to flatten. The number of cumulative COVID cases remains the highest in Detroit at 9,712 on May 9, with Wayne County following at a reported 8,232 cases. On May 9, the five-day rolling average for the number of COVID cases in Oakland County was 7,694, and Macomb County reported 5,993.
The daily data highlighted in these posts is from Michigan.gov/coronavirus, where data is updated daily at 3 p.m. Historical data were supplied from covidtracking.com, which republishes COVID data from the State.
The City of Detroit had 1,464 COVID cases per 100,000 people on May 11, an increase from 1,455 the day before (Chart 4). This is based upon a reported increase of 65 new cases, bringing the total number of COVID cases in Detroit to 9,851. Wayne County reported 1,240 cases per 100,000 people, and Oakland County had 1,152 cases per 100,000 people. These per capita rates were based upon 8,343 total cases for Wayne and 7,752 for Oakland. Macomb County reported 901 cases per 100,000 people, which is based upon 6,064 cases.
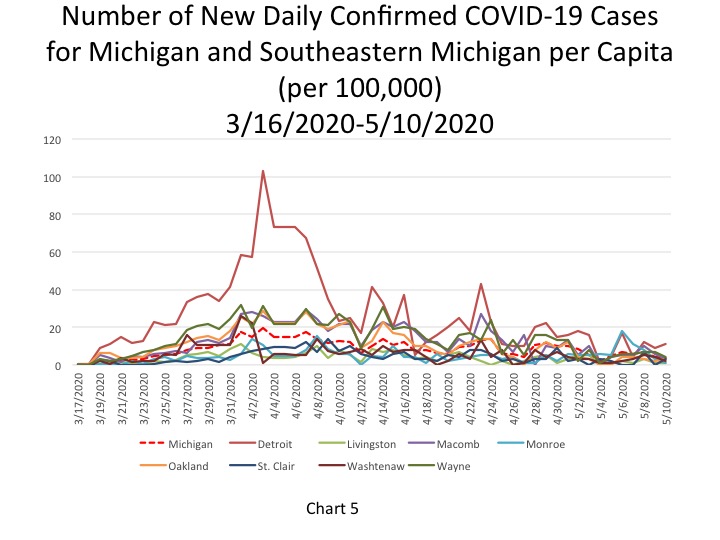
Chart 5 shows that the per capita rate for the number of new daily COVID cases per 100,000 people remained fairly stable for Detroit since May 8. On May 11 Detroit reported 10 new COVID cases per 100,000 people, which was equivalent to 65 new cases. Detroit experienced a small decline in its per capita rate while Monroe, Washtenaw and Wayne counties all experienced small increases. On May 11 Monroe County reported 3 daily COVID cases per 100,000 people, as did Washtenaw County; Wayne County reported 5 daily COVID cases per 100,000 people. These per capita rates were equivalent to 4, 10 and 54 new cases, respectively. Oakland County reported a per capita rate of 1 new case per 100,000 people on May 11, which was equivalent to 16 new cases, and Macomb County reported a rate of 3, which was equivalent to 22 new cases.
The State’s per capita rate was 3.8 new cases per 100,000 people, equivalent to 382 new cases. In total, of the 414 new cases, Southeastern Michigan accounted for 195 of them.
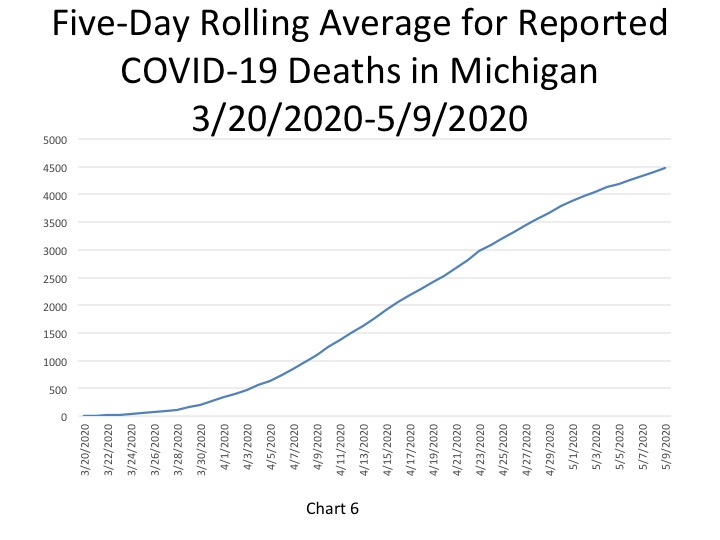
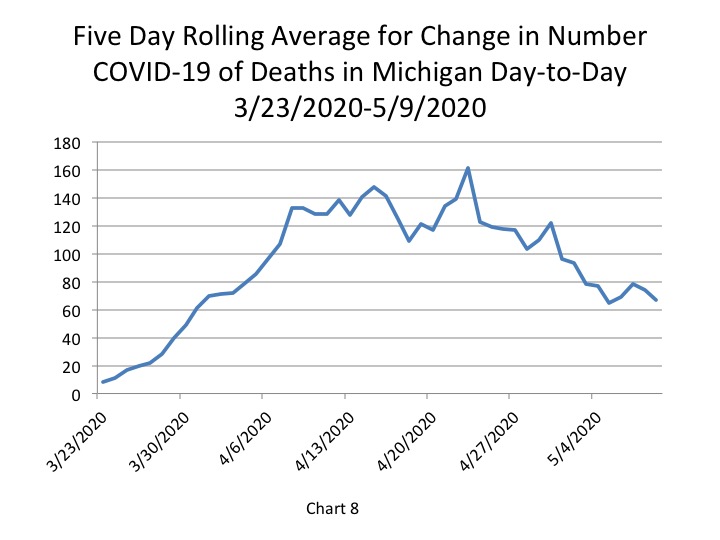
In Chart 6, the five-day rolling average for the number of deaths shows a continuing slow increase (a lagged number of 4,480 deaths, an increase of 67deaths). The actual reported COVID-19 deaths reached 4,584 on May 11, an increase of 33 deaths from the day prior. Of those 33 daily deaths reported on May 11, 16 were in Southeastern Michigan. While there was a small increase in the number of daily deaths between May 10 and 11, the numbers reported both days are still significantly lower than what has been reported for more than a month.
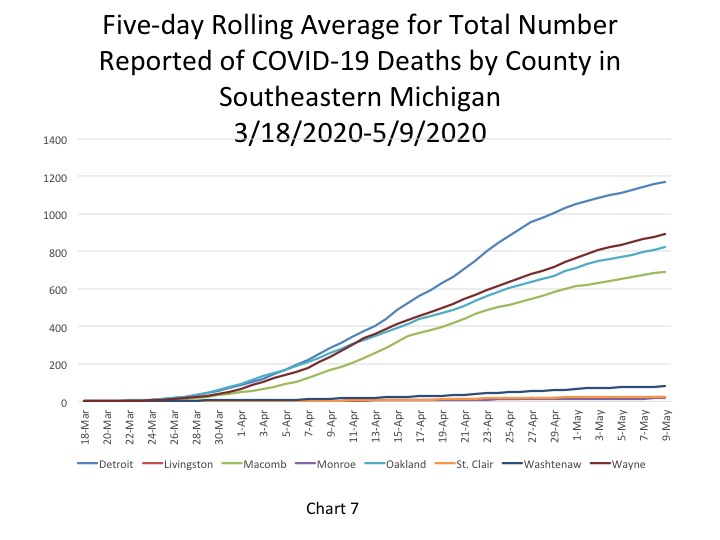
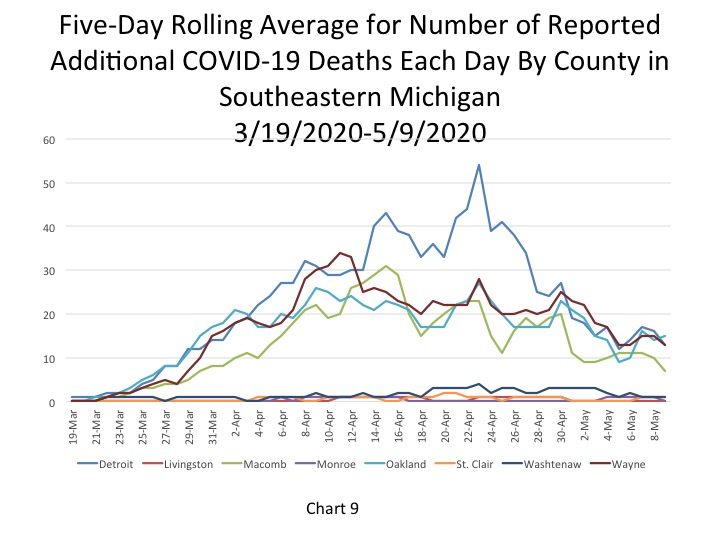
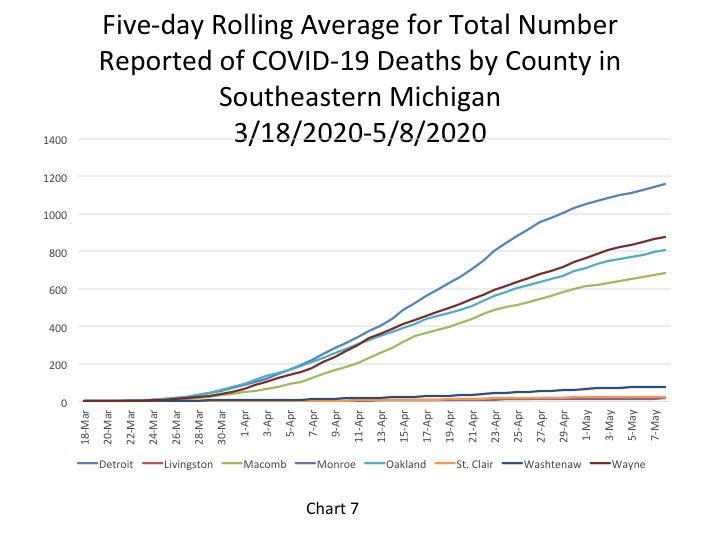
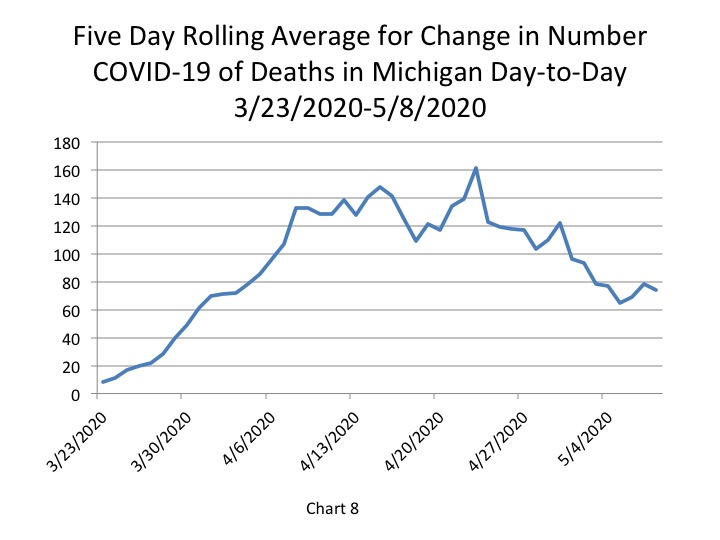
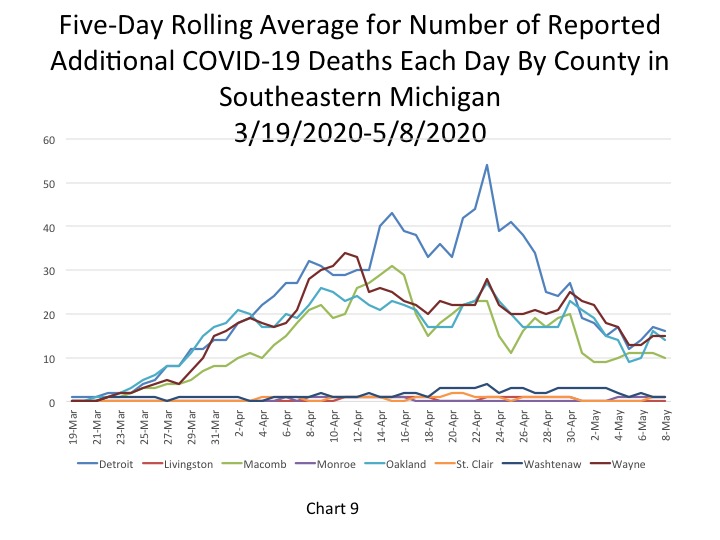
Chart 7 portrays how the total number of COVID deaths in Southeastern Michigan continues to increase, but that rate of increase has been gradually declining overall, showing that the curve is slowly starting to flatten. Chart 9 highlights how the curve is flattening throughout Southeastern Michigan, with the number of daily deaths throughout the region not reaching more than 15 in any one government entity on May 9. Oakland County reported the highest number of additional deaths on May 9 at 15, this was based on a 5-day rolling average calculation. Detroit and Wayne County each reported 13 additional daily deaths. Such declines in the number of daily deaths in Southeastern Michigan is why, in large part, the State continues to experience a decline in its daily death numbers (Chart 8), which reflects a slower increase in the overall number of COVID deaths.
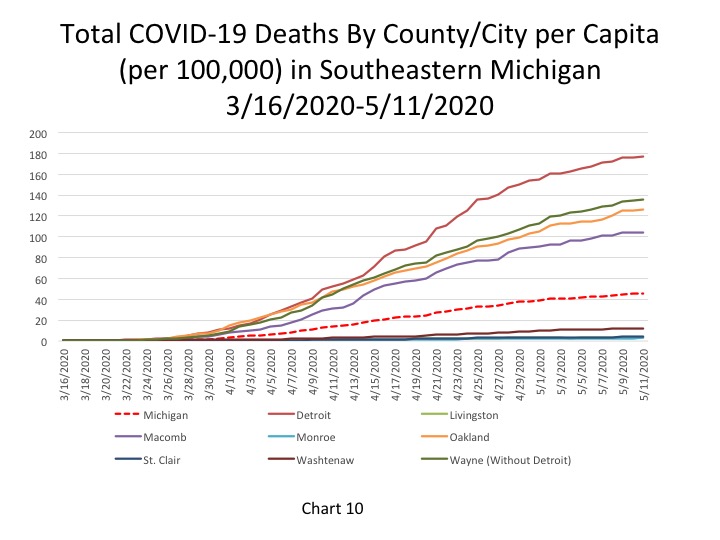
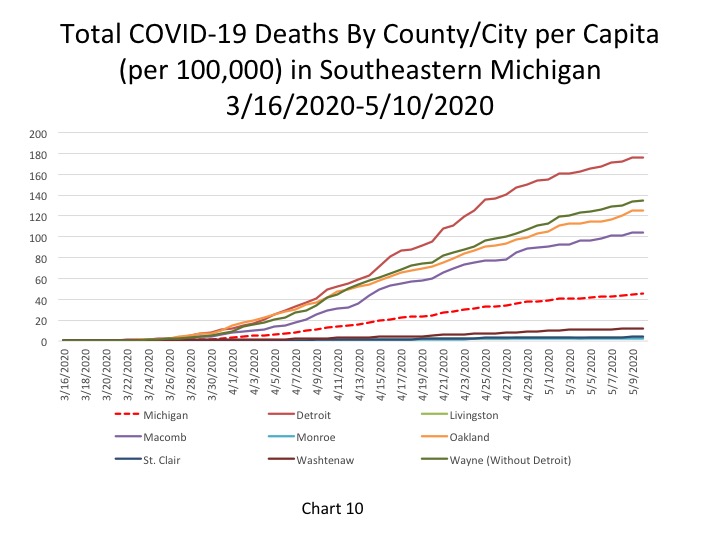
Chart 10 portrays the total number of COVID deaths per 100,000 people. As of May 11, the cumulative total of COVID deaths per 100,000 people in Detroit was 177 (representing 1,192 deaths). In Wayne County there were 136 COVID deaths per 100,000 people (913 total deaths), in Oakland County there were 126 deaths per 100,000 people (849 total deaths), and in Macomb County there were 104 COVID deaths per 100,000 people (699 total).
The State of Michigan had 46 COVID deaths per 100,000 people, a rate that continues to remain lower than the four entities discussed above.
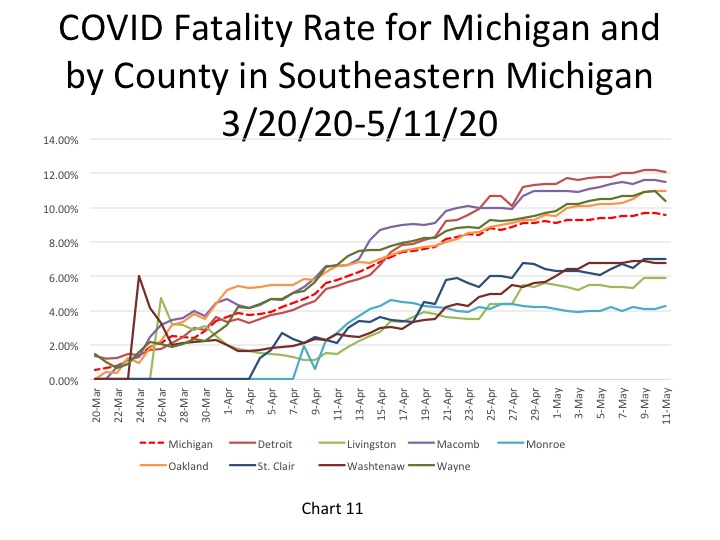
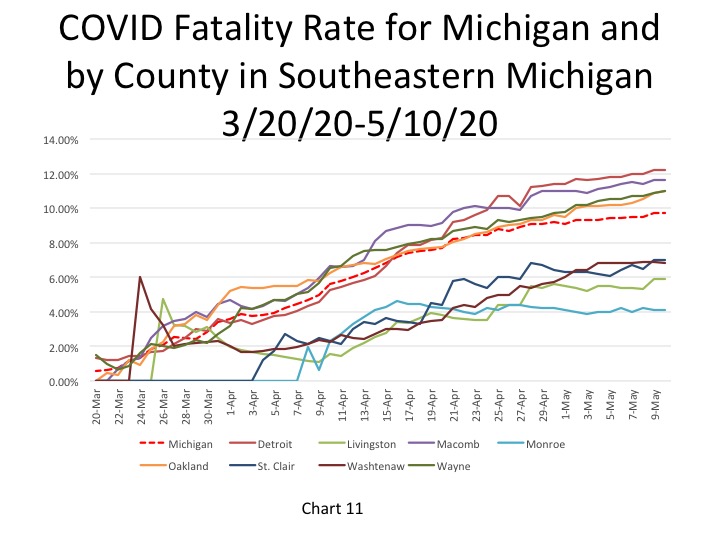
The fatality rate for Detroit and the State both declined by 0.1 percent on May 11. Detroit reported a fatality rate of 12.1 percent, and the State reported a fatality rate of 9.6 percent. Detroit and the three largest counties in the region continue to have fatality rates at or above 11 percent.
One reason we may be seeing such high fatality rates in Michigan is due to the low testing rates. When only having-presumably-a lower of number confirmed COVID cases than is actually likely due to the limited availability of tests, the fatality rate appears higher because the base comparison is smaller than it might be.
Michigan reported 33 additional deaths on May 11, and while this was an increase from the day before, it was still among the lowest number of daily deaths reported since late March. The data shows that daily death and case numbers continue to trend downward. However, Michigan remains one of the hardest hit states. It ranks seventh in the nation in confirmed cases and fourth in deaths.
According to the State of Michigan, the total number of COVID cases in Michigan rose to 47,138, an increase of 382 cases from the previous day. This total was equivalent to 472 cases per 100,000 people (Chart 4) on May 10. The five-day rolling average for the total number of COVID cases (Chart 1) reflects a smoother curve and adjusts for fluctuations in testing and/or the quality of reporting or failure to report. That curve continues to trend upward, but the number of new COVID cases identified each day in Southeastern Michigan has been steadily decreasing for about a month. Detroit reported the highest number of daily cases at 72 on May 8 (Chart 3). Note that this five day rolling average causes these daily case and daily death charts to lag two days behind.
Chart 2 shows how that while the curve is flattening in Southeastern Michigan, based on the five-day rolling averages, there are still small increases in the total number of COVID cases in Southeastern Michigan. The number of cumulative COVID cases remains the highest in Detroit at 9,649 on May 8, with Wayne County following at a reported 8,170 cases. On May 8, the five-day rolling average for the number of COVID cases in Oakland County was 7,658, and Macomb County reported 5,946.
The daily data highlighted in these posts is from Michigan.gov/coronavirus, where data is updated daily at 3 p.m. Historical data were supplied from covidtracking.com, which republishes COVID data from the State.
The City of Detroit had 1,455 COVID cases per 100,000 people on May 10, an increase from 1,443 the day before (Chart 4). This is based upon a reported increase of 77 new cases, bringing the total number of COVID cases in Detroit to 9,786. Wayne County reported 1,232 cases per 100,000 people, and Oakland County had 1,150 cases per 100,000 people. These per capita rates were based upon 8,289 total cases for Wayne and 7,736 for Oakland. Macomb County reported 898 cases per 100,000 people, which is based upon 6,042 cases.
Chart 5 shows that the per capita rate for the number of new daily COVID cases per 100,000 people remained fairly stable for Detroit over the last few days. Detroit’s rate was reported at 11 new daily COVID cases per 100,000 people on May 10 (equal to 77 new cases), an increase from 9 the day before. Oakland and St. Clair counties were the only other two government entities that reported a rate increase between May 9 and May 10; both entities reported per capita rates of 3 new cases per 100,000 people. Oakland County reported 44 new COVID cases on May 10 while St. Clair County reported 4 new cases. Wayne County reported a per capita rate of 4 new cases per 100,000 people on May 10, which was equivalent to 38 new cases, and Macomb County reported a rate of 3, which was equivalent to 23 new cases. Over the weekend (May 9 and 10) the 77 new cases Detroit reported on May 10 was the highest number across these local governments.
The State’s per capita rate was 3.8 new cases per 100,000 people, equivalent to 382 new cases. In total, of the 680 new cases, Southeastern Michigan accounted for 195 of them.
In Chart 6 the five-day rolling average for the number of deaths shows a continuing steady increase (a lagged number of 4,413 deaths, an increase of 74 deaths). The actual reported COVID-19 deaths reached 4,551 on May 10, an increase of 25 deaths from the day prior. Of those 25 daily deaths reported on May 10, 18 were in Southeastern Michigan. Overall, the 25 daily deaths reported on May 10 is the lowest number that has been reported in the State since March. On May 9 the State reported 133 additional deaths, however 67 of those were added to the May 9 total as a result of comparing death certificates and the State’s COVID database. The number of additional COVID deaths reported on Sunday was a substantial decrease in reported daily deaths. We hope that this is a trend that will continue, however recently COVID data reported to the State over the weekend is lower than what is reported during the week.
Chart 7 portrays how the total number of COVID deaths in Southeastern Michigan continues to increase, but that rate has been gradually declining overall, showing that the curve is slowly starting to flatten. The rate at which the number of deaths is increasing in Detroit and Wayne and Oakland counties has been hovering in the mid-teens for the last several days. Detroit continues to have the highest cumulative number of COVID deaths though, inching toward 1,200.
Chart 8 shows that the number of daily deaths in Michigan continues to decline overall, despite a small uptick late last week. On May 8 though the numbers decreased again. Chart 9 shows that Detroit and Oakland and Macomb counties contributed to the decrease in the total number of daily deaths in Michigan. Detroit reported 16 daily deaths, while Oakland County reported 14 additional deaths and Macomb reported 10. None of those entities reported a decline of more than 2 deaths from the day prior. Aside from those three entities, the other five counties in Southeastern Michigan reported the same number of additional deaths as the day prior, further showing that the curve is in fact flattening.
Chart 10 portrays the total number of COVID deaths per 100,000 people. As of May 10, the cumulative total of COVID deaths per 100,000 people in Detroit was 176 (representing 1,187 deaths). In Wayne County there were 135 COVID deaths per 100,000 people (910 total deaths), in Oakland County there were 125 deaths per 100,000 people (843 total deaths), and in Macomb County there were 104 COVID deaths per 100,000 people (698 total).
The State of Michigan had 45 COVID deaths per 100,000 people, a rate that continues to remain lower than the four entities discussed above.
The fatality rate for Detroit and Macomb, Oakland and Macomb counties reached 11 percent or higher on May 10, with Detroit having the highest rate at 12.2 percent. The State’s fatality rate also gradually increased to 9.7 percent.
One reason we may be seeing such high fatality rates in Michigan is due to the low testing rates. When only having-presumably-a lower of number confirmed COVID cases than is actually likely due to the limited availability of tests, the fatality rate appears higher because the base comparison is smaller than it might be.
While the State reported its lowest number of daily deaths since March on May 10 (25), it also reported that 22,686 people have recovered from the virus. These statistics coupled with the fact that the curves for the total number of COVID cases and deaths are flattening show signs that we are beginning to overcome the virus. However, the key word is beginning. Many of those who have been deemed as “recovered” are still battling longer-term affects from the virus, according to a recent Free Press article. Additionally, just because the curve is flattening now doesn’t mean there won’t be another spike in cases and deaths in the future. This could very easily happen if the Stay-at-Home order is broken too soon or people begin to disregard other health recommendations, such as wearing a mask in public and/or congregating in groups. Ultimately, the risk of community spread for the virus remains high and the long-term effects once someone is infected still remain fairly unknown. This is why we must continued to heed the recommendations set forth by the Centers for Disease Control and the State.
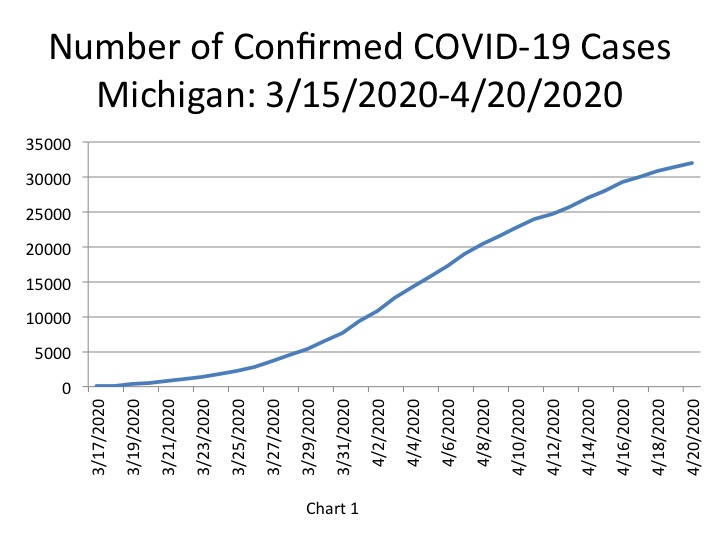
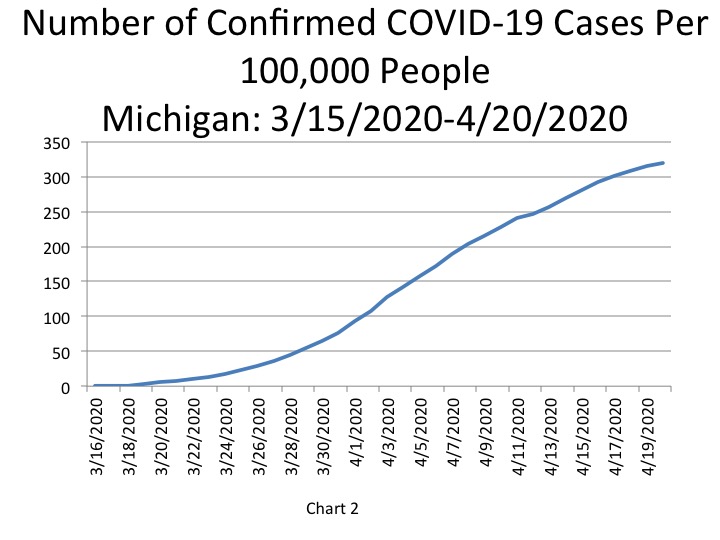
The total number of COVID cases
in Michigan increased
to 32,000
(Chart
1), which was equivalent to 320 cases per 100,000 people (Chart 2) on April 20.
The number of new cases reported on April 20 for the State of Michigan—576–is
the
lowest that has been reported since March 26, according to the Michigan
Department of Health and Human Services.
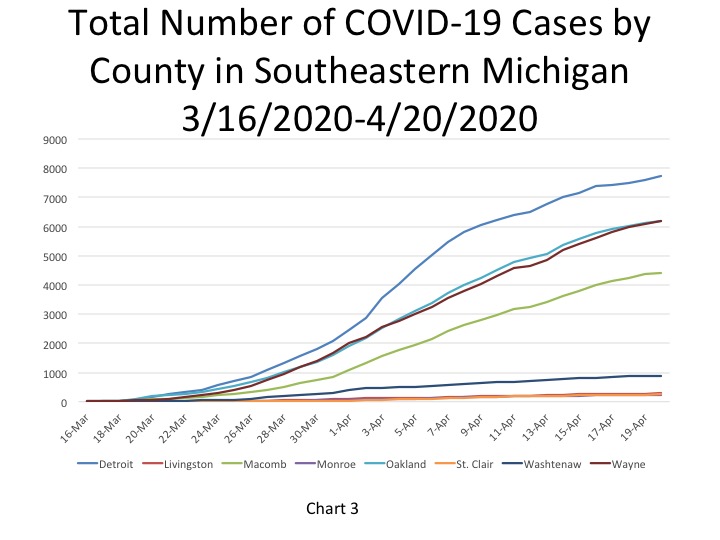
Of the
total COVID
cases, the City of Detroit had 7,736 cases, Oakland County had 6,178
cases,
Wayne County (excluding Detroit) had 6,176 cases and Macomb County had 4,425
cases (Chart
3). In
the early weeks of April Wayne County (excluding Detroit) regularly had a fewer
total number of COVID cases than Oakland County. However, the April 20 data
shows that now Wayne County only has two less cases than Oakland County. This
highlights a decreasing rate of spread in Oakland County and an increasing rate
of spread in Wayne County (excluding Detroit). The number
of confirmed cases in Washtenaw, Livingston, Monroe and St. Clair counties
combined totaled 1,654,
with
Washtenaw County accounting for 878 of those cases, according to the most recent data from the
State.
The daily data highlighted in these posts is from Michigan.gov/coronavirus, where data is updated daily at 3 p.m. Historical data was supplied from covidtracking.com, which republishes COVID data from the State.
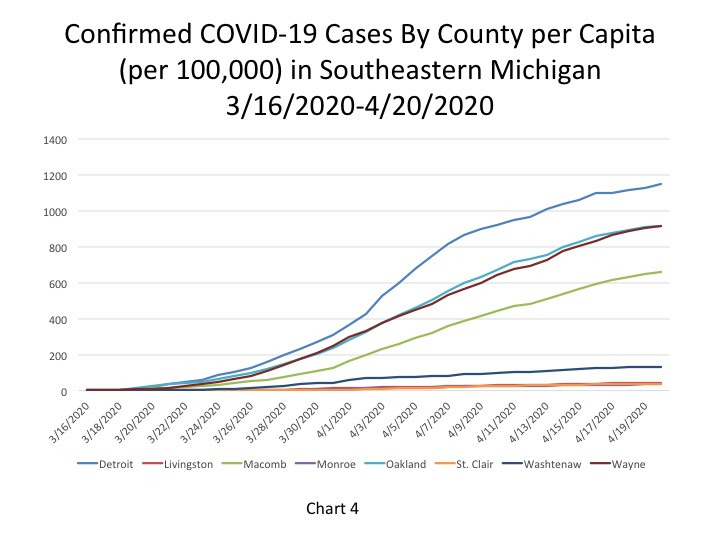
The City of Detroit had a total COVID case per capita
rate of 1,150 per 100,000 people on April 20, an increase from a rate of 1,130
the day before (Chart 4). Oakland and Wayne counties (excluding Detroit) both
had rates of 918 per 100,00 people. The rate for Wayne County increased more
(increased by 13 points) than the Oakland County rate (increased by 10 points),
further showing that the spread in Wayne County is increasing faster than in
Oakland County. Macomb County
had 658
COVID cases
per 100,000 people.
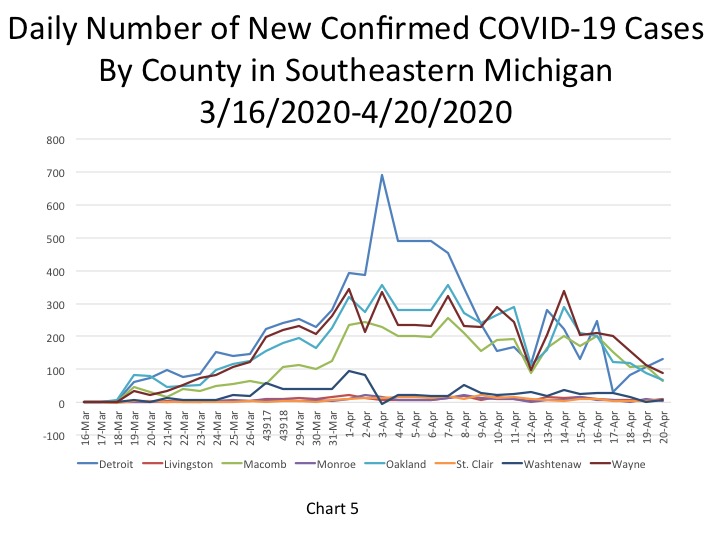
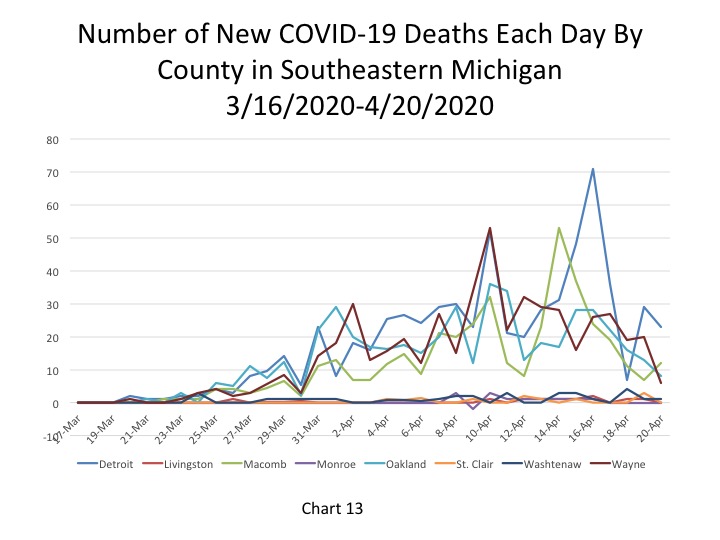
Chart 5 shows that the City of Detroit was the
only government entity focused on in this blog to post triple digit new
positive COVID case numbers for April 20. According to the data, Detroit had
132 new COVID cases on April 20; Wayne County (excluding Detroit) had 88 new
cases. In Oakland County the number of new cases on April 20 was 69, and in
Macomb County it was 65. Monroe County posted the lowest number of new cases on
April 20 at 3.
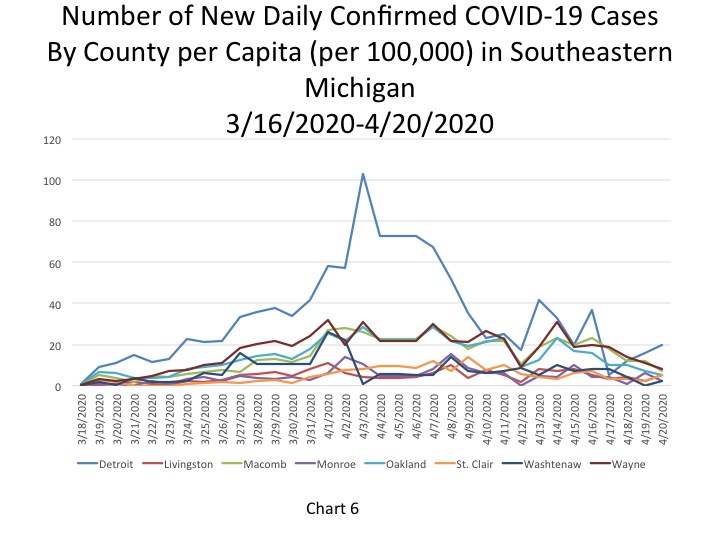
According to the data, Detroit had a rate of 20 new COVID cases per 100,000 people on April 20, reflective of a continued rate increase since April 17 (Chart 6). Livingston, St. Clair and Washtenaw counties were the only other government entities to post new daily COVID case rate increases from the day prior. In Macomb County, the daily COVID case rate was 7 per 100,000 people on April 20, a decrease from 12 new COVID cases per 100,000 people on April 19. Oakland County had a rate of 5 new COVID cases per 100,000 people on April 20, a decrease from a rate of 7 reported the day before (Chart 6). Also, on April 20 Wayne County reported a new COVID case rate of 8 per 100,000 people, a decrease from the rate of 11 reported on April 19.
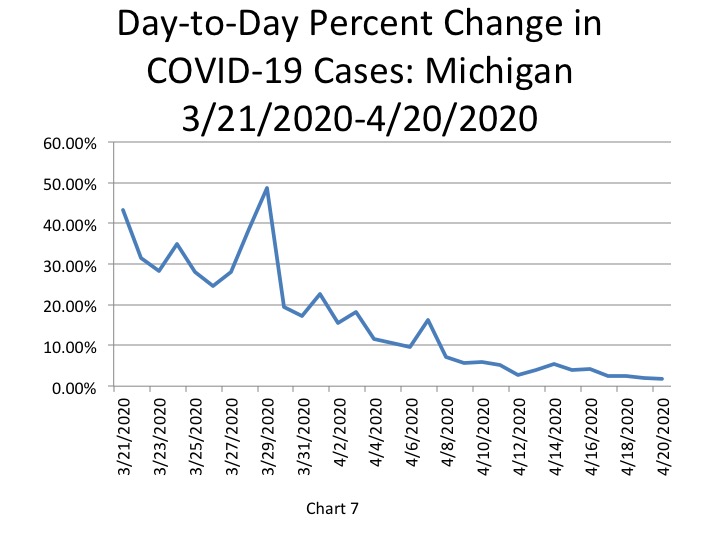
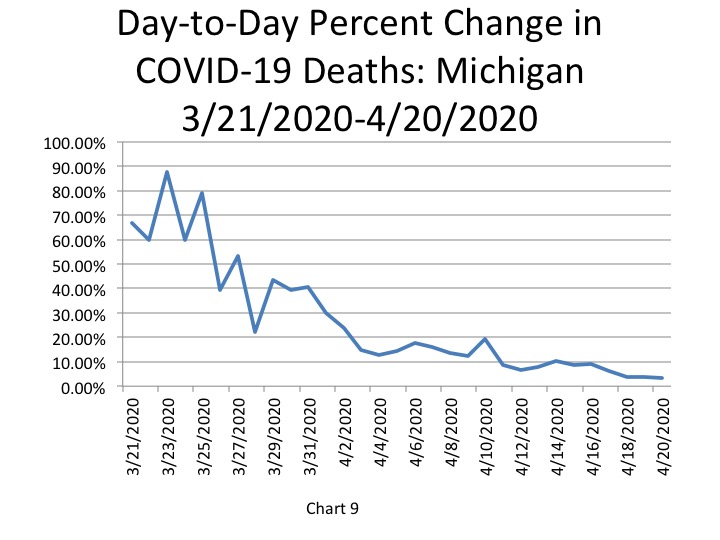
In addition to the raw data of confirmed cases, we also show the percent change in the number of cases reported day-to-day. On April 20 the percent change from April 19 was 1.8 percent, a small decrease from the day’s prior change of 2 percent.
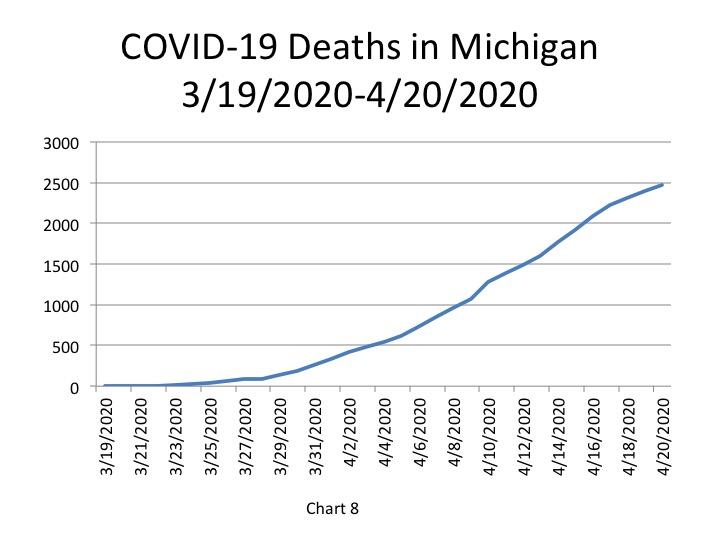
It was reported by the State of
Michigan that on April 20 the total of COVID-19 deaths reached 2,468.
This
was a 3.2
percent change from April 19, which was a 0.4 percent
decrease in the percent change in new daily deaths from the day prior (Chart
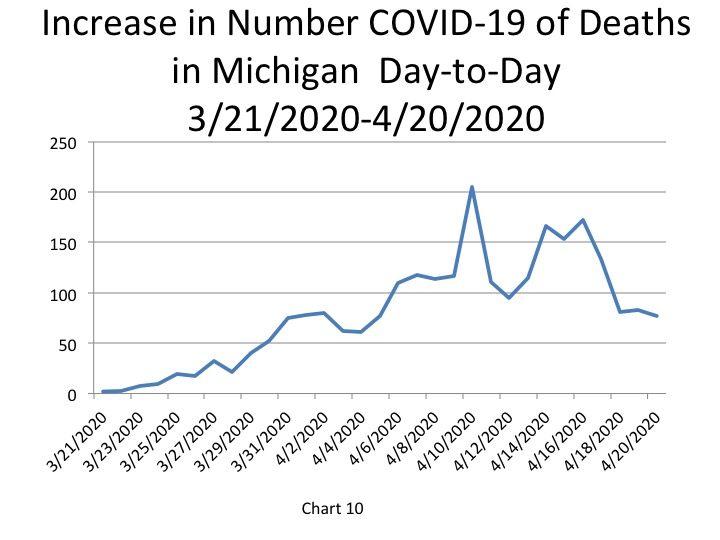
9). The 2,468 total deaths reported for April 20
was 77 deaths higher than what was reported on April 19
(Chart
10);
this was 11 less deaths than the number of daily deaths reported on April 19.
Also, the April 20 number was the lowest of new daily COVID deaths reported
since April 5; 77 new deaths were reported that day too.
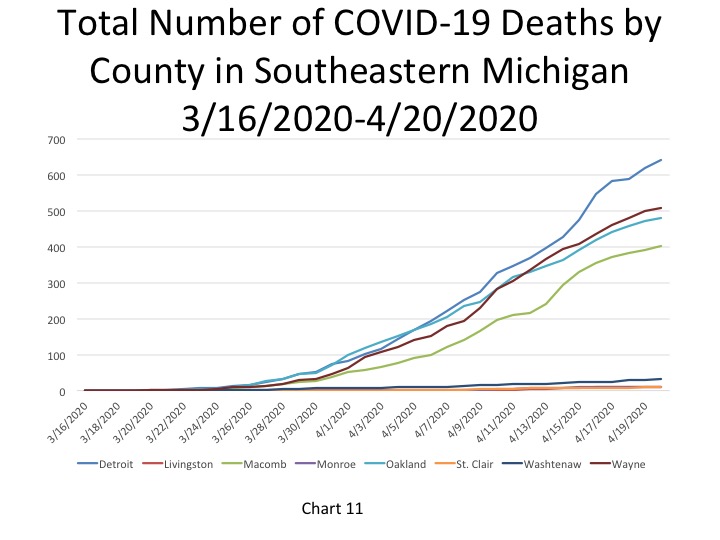
Of the total deaths reported, the
number of COVID deaths in Detroit increased by 23 between April 20 and April
19. On April 20 the total COVID deaths
across time for Detroit was 641 (Chart 11). Also on April
20, the
Michigan Department of Health and Human Services also reported 507 total deaths
in
Wayne County (excluding Detroit), 479 in Oakland County and 403 in Macomb
County (Chart 11).
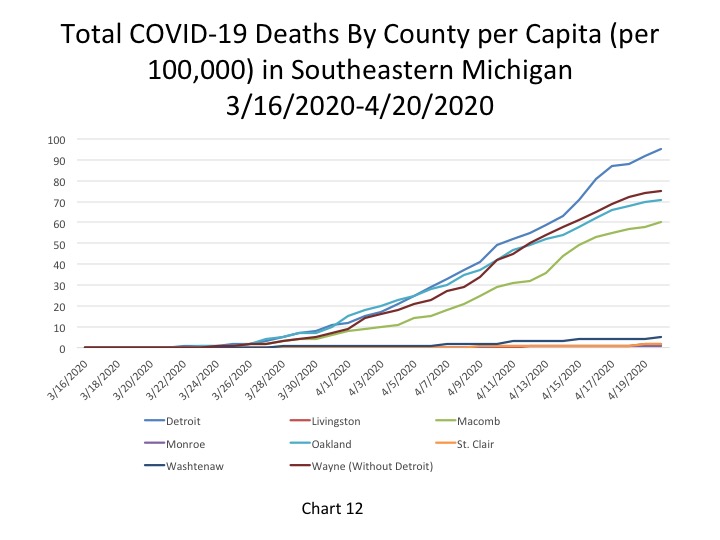
On a per capita basis, per 100,000
people, Detroit also continues to have the highest number of deaths per 100,000
people at 95 on
April 20; this is 20 points higher than Wayne County’s rate of 75 COVID deaths
per 100,000 people (Chart 12). Oakland County had 71 COVID deaths per
100,000 people and Macomb County had 60.
As noted, Detroit had 23 new COVID deaths on April 20-this was the highest number of new daily deaths in the region, but was a decrease in the new number of daily deaths reported on April 19. Macomb County reported the second highest number of new deaths at 12 on April 20; Macomb County was the only government entity to post an increase in the number of new COVID deaths from April 19. For Oakland County, the number of new daily deaths was 8, a continued decrease since April 16, and in Wayne County there were 6 new deaths.
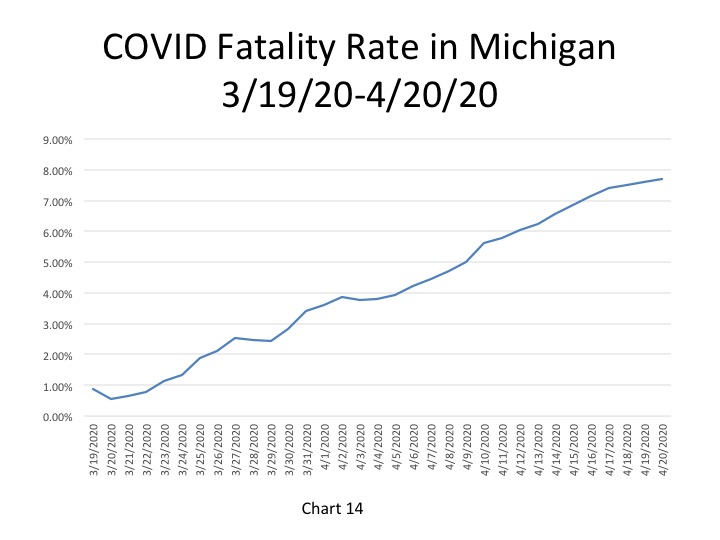
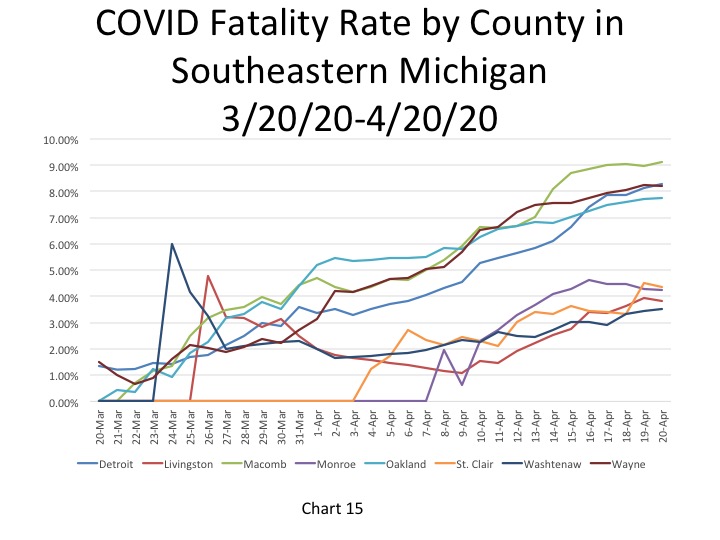
The final two charts below show the case
death rates for the State of Michigan and for Detroit and the seven counties in
Southeastern Michigan. To determine the rates we divided the reported deaths
from each day by the number of total COVID cases each day.
On April 20 the COVID case fatality rate
in Michigan was 7.7 percent; a slight increase from the 7.6 percent death rate
reported the day before.
Of Detroit and the counties in the
region, Macomb County continued have the highest case fatality rate at 9.1
percent on April 20. The fatality rate for Detroit was 8.3 percent on April 20,
and in Wayne County (excluding Detroit) it was 8.2 percent. The fatality rate
in Oakland County was 7.8 percent on April 20.
These fatality rates are very sensitive to the number of tests that are being completed across the region. In states or countries where far more testing is completed, death rates may be substantially lower. The failure of the CDC to complete and broadly distribute an early and accurate test has had huge consequences.
On April 20 Gov. Gretchen Whitmer announced that following the May 1 expiration of the Stay at Home Order life will not go back to normal immediately. Instead, businesses and life as we know it will resume slowly and in phases. Whitmer also said her plans, which are yet to be announced, will be data driven. And, as the data has shown thus far, the spread of the virus has certainly slowed but it is still very prevalent throughout Southeastern Michigan.