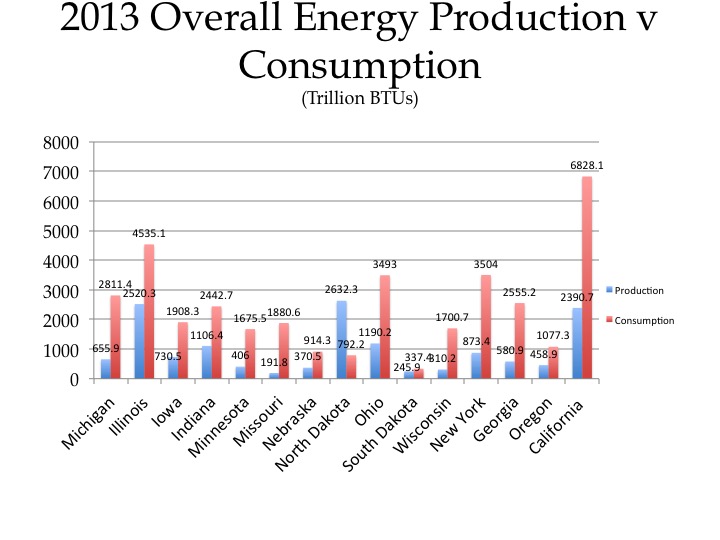
Of the 15 states featured in this energy series, only one state produced more energy than it consumed. In 2013, North Dakota produced 1,840.1 more trillion BTUs than it consumed. This surplus of energy is due to the state’s production of natural gas and oil. These instances of energy surplus production are two of only three where a featured state produced more trillion BTUs of a fossil fuel type energy source than was consumed in that state. The third instance was in Illinois where coal production trumped consumption.
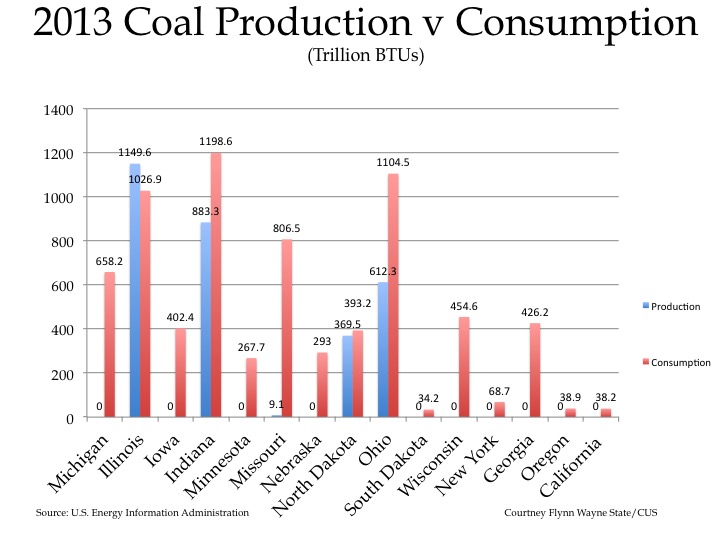
Coal
Illinois
Production: 1149.6
Consumption: 1026.9
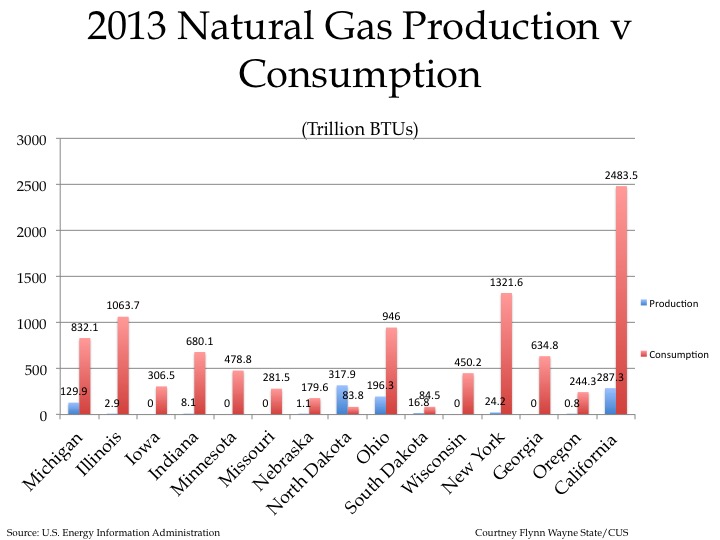
Natural Gas
North Dakota
Production: 317.9
Consumption: 83.8
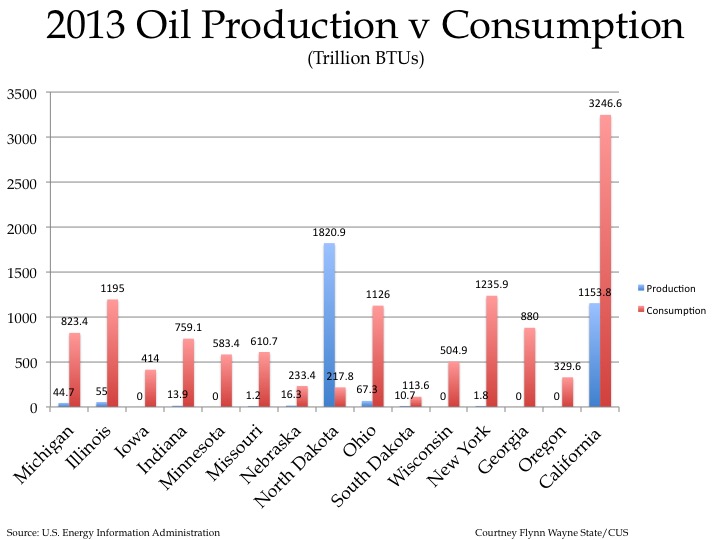
Oil
North Dakota
Production: 1820.9
Consumption: 217.8
In this part of our energy series we further explore the net difference between production and consumption of energy sources. The sheer numbers show that the featured states relied upon coal, oil and natural gas as energy sources, despite their inabilities to produce the amount of energy they need to consume.
Overall, Michigan consumed 2155.5 more trillion BTUs of energy than it produced in 2013. Our production was 23.3 percent of our consumption. Only Missouri and Georgia produced a smaller percent of the energy it consumed. These states, along with Michigan, are exporting a huge share of their income to energy producers elsewhere. California had the largest absolute difference at 4,437.3 trillion BTUs, but California did produce 35 percent of its energy.. The state that came closest to North Dakota in terms of breaking even for energy consumption v production was South Dakota. Still, South Dakota consumed 114.1 more trillion BTUs than it produced.
In this post a nuclear energy chart is not included because each state produced nuclear energy as a power source consumed that same amount, meaning there was no net surplus or deficit. The amount of nuclear energy consumed and produced is included in the overall production v consumption chart below though.
The states featured in this series are:
- Michigan
- Illinois
- Iowa
- Indiana
- Minnesota
- Missouri
- Nebraska
- North Dakota
- Ohio
- South Dakota
- Wisconsin
- New York
- Georgia
- Oregon
- California
There was only one state of the 15 featured in this post were more coal-powered energy was produced than consumed in that state. This state was Illinois, where 1149.6 trillion BTUs of coal-powered energy was produced and 1026.9 trillion BTUs was consumed. This net surplus of coal-powered energy is an anomaly in this post because, as the chart shows, reliance upon coal for consumption much outweighs how much is produced. In total, in the featured states, 7211.8 trillion BTUs of coal-powered energy is consumed while less than half of that (3023.8 trillion BTUs) is produced. There are also 10 different states where no coal-powered energy is produced there, yet, 2,628.1 trillion BTUs, or 36 percent of the coal-powered energy consumed by these 15 featured states, is consumed there.
Missouri had the largest difference between the amount of coal-powered energy it produced and consumed in 2013. According to the U.S. Energy Information Administration, there was 9.1 trillion BTUs of coal-powered energy produced in Missouri in 2013 but 806.5 trillion BTUs consumed in that same year, meaning there was a net difference of 797.4 trillion BTUs. With such a large difference, Missouri must bring in coal from elsewhere to fuel its coal powered plants. According to the U.S. Energy Administration, Wyoming was the main provider of this energy source to Missouri. Is this the right measure. Michigan had the second largest difference between the amount of coal-powered energy it produced and consumed in 2013 at 658.2 trillion BTUs. Michigan did not produce any coal-powered energy in 2013 but 658.2 trillion BTUs were consumed there in 2013. According to the U.S. Energy Information Administration, Michigan primarily relies on Wyoming and Montana for its coal needs, although other states, such as Kentucky and West Virginia also provide this resource to the state. For about 90 years, between 1860 and 1949, Michigan did produce a substantial amount of coal through its coal mines, however they are not longer active, according to the U.S. Energy Information Administration, leaving Michigan to seek this resource elsewhere.
Natural gas is yet another fossil fuel based energy source where consumption typically outweighs production for these states. Of the 15 states discussed in this series, North Dakota is the only one where more natural gas was produced than consumed. In 2013, 317.9 trillion BTUs of natural gas were produced in North Dakota and 83.8 trillion BTUs were consumed, meaning there was a net surplus of 234.1 trillion BTUs. The production of natural gas in North Dakota has been rising since 2007 due to the large increase in the use of shales to produce this energy source, according to the U.S. Energy Information Administration.
California had the largest difference between natural gas production and consumption in 2013 at 2,196.2 trillion BTUs. Although California was one of the largest producers of natural gas of these featured states (287.3 trillion BTUs), those numbers still paled in comparison to the amount of natural gas it utilized (2,483.5 trillion BTUs). According to a recent LA Times article, natural gas is now the single highest source of power generation in California. Various interstate pipelines from Arizona, Nevada, Wyoming and Oregon bring natural gas into California for consumption, according to the U.S. Energy Information Administration.
For Michigan, there was a net difference of 702.2 trillion BTUs of natural gas consumption; 129.9 trillion BTUs of natural gas were produced in Michigan in 2013 and 832.1 trillion BTUs were consumed there. According to the U.S. Energy Information Administration, Michigan is regularly one of the top 5 users of natural gas for residential purposes. While Michigan has a large number of gas wells (about 10,000), production in the state has been declining since 1997. Due to this, much of the natural gas consumed in Michigan is obtained through pipelines that cross through the state from Ohio, Indiana and Wisconsin, with the end destination of these pipelines being the northeastern states and Canada, according to the U.S. Energy Information Administration.
Just as with natural gas, North Dakota again was the only featured state to produce more oil than was consumed in 2013, according to the U.S. Energy Information Administration. In 2013, 1820.9 trillion BTUs of oil were produced there in 2013 and 217.8 trillion BTUs were consumed there. California had the largest net difference between oil consumption and production in 2013. For a net difference of 2092.6 there was 3246.6 trillion BTUs of oil consumed in California and 1153.8 trillion produced there. Despite California producing about 6 percent of the country’s crude oil, its rate of consumption of the fossil fuel outweighs the rate of production. This means, California must rely on other geographic locations to supply its needs. According to the U.S. Energy Information Administration, foreign countries (particularly Saudi Arabia, Iraq and Ecuador) supply more than 50 percent of the crude oil refined in the state. Additionally, North Dakota, Utah, New Mexico and Wyoming also supply crude oil for refining and consumption.
In Michigan in 2013, there was 823.4 trillion BTUs of oil consumed and 44.7 trillion BTUs produced, leaving a net difference of 778.7. The majority of the oil consumed in Michigan takes the form of gasoline. Michigan also has the highest residential consumption of liquid petroleum gasoline (LPG) in the country as a form of heating fuel. While there is a modest amount of oil produced in the state, it does not compare to the amount consumed, which is 18 times higher.
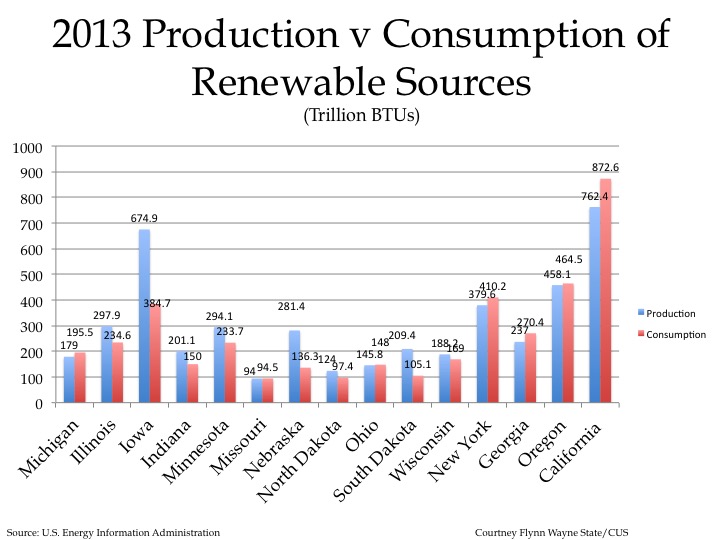
Overall, according to the U.S. Energy Information Administration, it is typical of a state to consume about as much renewable energy as it produces. However, there are instances where a surplus of renewable energy is produced; this only occurs though because of additional biofuel production. In Iowa, 674.9 trillion BTUs of renewable energy were produced and only 384.7 trillion BTUs were consumed. The excess came from the biomass feedstock that was used to produce ethanol, which was then blended into motor fuel. Illinois, Indiana, Minnesota, North Dakota, South Dakota and Wisconsin also produced more renewable energy than was consumed, although not as much as Iowa. Again, this was directly related to biofuel production used to create ethanol.
Of the 15 states featured, California both produced and consumed the highest amount of renewable energy. California produced 762.4 trillion BTUs of renewable energy and consumed 872.6 trillion BTUs. For consumption, nearly 5 percent of California’s utility electricity was produced from solar power in 2013, and other renewable sources such as wind and hydroelectric were also used for consumption. In terms of production, California produces about 8 percent of the country’s wind-powered electricity and is also home to the world’s largest complex of geothermal plants, according to the U.S. Energy Information Administration.
Michigan ranked in about the middle for the 15 states in terms of energy production and consumption. In 2013 179 trillion BTUs was produced in Michigan and 195 trillion BTUs was consumed. Aside from biofuel production, which created 95.5 trillion BTUs of energy, wind-powered energy was the largest production source for renewable energy in the state in 2013; 26.7 trillion BTUs was created. With more than 100 hydroelectric power plants, this form of renewable energy also contributed to the 13.5 trillion BTUs of renewable energy produced in the state in 2013.
In this post we saw the vast difference between a state’s consumption of energy and its production, and rarely did these states produce more than they consumed, relying upon other states and imports for their energy. A reliance on fossil fuels for energy was evident in 2013 and next week we will show how this reliance was even heavier in 2003. For the final post of this series we will show how Michigan, New York and California have changed in their reliance on certain energy sources from 2003 and 2013.