The Michigan Public Service Commission (MPSC) did not grant DTE the rate hike it originally proposed late last year, but it did still grant the utility company a rate hike.
In November of 2024 the MPSC approved a $113.8 million rate increase for DTE Gas, which was a 57 percent reduction from what the utility sought. In January of 2024 the company proposed increasing its rates by $266 million, but $106 million of that had previously been approved for infrastructure improvements.
What does this increase mean for the average utility user? According to a November press release about the rate increase approval, a typical residential customer using 100 ccf (hundred cubic feet) of natural gas per month will see an increase of $1.98 on their monthly bill. In addition, due to the approved Infrastructure Recovery Mechanism (IRM) surcharge, customers experienced an increase of 66 cents, beginning Nov. 21, 2024. The IRM surcharge will increase annually until 2029, resulting in an additional increase of $6.28 by Jan. 1, 2029, over the initial rate and IRM approval.
Prior to the 2024 increase, the MPSC approved a $368 million, or 6.4 percent, electricity rate increase in December of 2023. This increase translated to a $6.51 increase in the average monthly residential bill. This approval was also less than what the utility company had proposed; in February of 2023 DTE proposed a $622 million increase to its rates.
According to Michigan law, utility companies can only file for a rate increase once every 12 months. Once an application for such an increase is submitted it can take up to 10 months for the cases to be decided. As has been demonstrated with DTE’s rate increase requests over the years, the MPSC often only grants a portion of their total asks.
According to DTE, the proposed increases over the years are to cover a portion of inflation, needed infrastructure improvements to reduce outages and outage times and to continue investment in clean energy infrastructure. While these upgrades may be valid, public outcry wants to see DTE services improve without the utility company being approved for millions of dollars in rate hikes.
According to a September 2024 MLive article, nearly 50 Michigan residents attended an MPSC meeting to express concerns about the proposed $266 million rate increase, citing long power and frequent outages and utility bill affordability as reasons why the utility company doesn’t deserve more money. State representatives, including State Rep. Kimberly Edwards and former State Rep. Jamie Churches also issued notice that they weren’t in support of the proposed increase, along with Congresswoman Rashida Tlaib and Attorney General Dana Nessel. Nessel said in her legal testimony, according to MLive, that DTE shouldn’t have received any more than a $139.5 million rate hike in 2024 and with that hike funds should be prioritized for “proven outage-reducing strategies like tree-trimming and away from more expensive capital and technological investments.”
These public concerns about DTE’s rate hikes came even before the MPSC released independent audit results on the operations of both DTE and Consumers energy; both of these companies combined provide electricity to more than 80 percent of the electric customers in Michigan. Highlights of the audit include the fact that DTE and Consumers Energy both have “worse than average” service interruptions, restoration delays, and tree trimming cycles compared to other utility companies. According to the audit, DTE and Consumers operations were compared to Commonwealth Edison, Ameren Illinois, and the Lansing Board of Water and Light.
In addition to finding that DTE and Consumers provide “worse than average” services, the audit also found:
- The average time it took for both utility companies to restore power to their 1.4 million customers outside of major weather events was worse than average among other utility companies in 2022 and 2023;
- More than 13 percent of DTE Electric customers experienced four or more outages and 45 percent of customers experienced outages that lasted eight hours or more in 2023;
- More than 10 percent of Consumers Energy customers experienced four or more outages and over 25 percent of them had outages that lasted at least eight hours in 2023;
- Both companies have outdated infrastructure, which could be the cause for the long-lasting interruptions.
While the audit highlights the less than average performance of DTE and Consumers, a 2024 report from the Citizens Utility Board highlights how Michigan overall ranked 43rd of the 50 US states, plus Puerto Rico and Washington DC, for having the overall longest average number of minutes of outage per customer, with major event days included. Michigan also ranked 42nd in the overall number of outage minutes per customer, with major event days excluded.
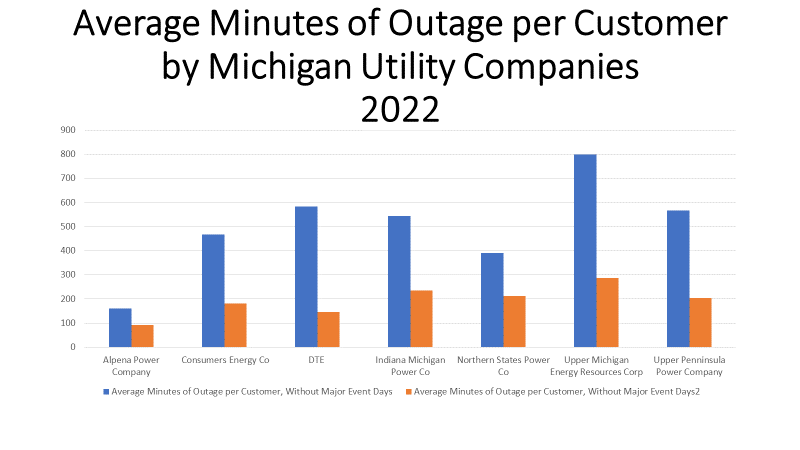
The chart above shows the average number of outage minutes for Michigan’s utility companies, either when there were no major weather events or including such events. Major weather events do have a larger impact on the duration of outages, as is shown above. Again, while data has shown that DTE and Consumers have below average performances, the chart above shows that Upper Michigan Energy Resources and Upper Peninsula Power both had longer outage times without major event days than DTE and Consumers did. With major events, Upper Michigan Energy Resources, Upper Peninsula Power, Indiana Michigan Power and Northern States Power all had longer average outage times. These companies are also smaller than DTE and Consumers.
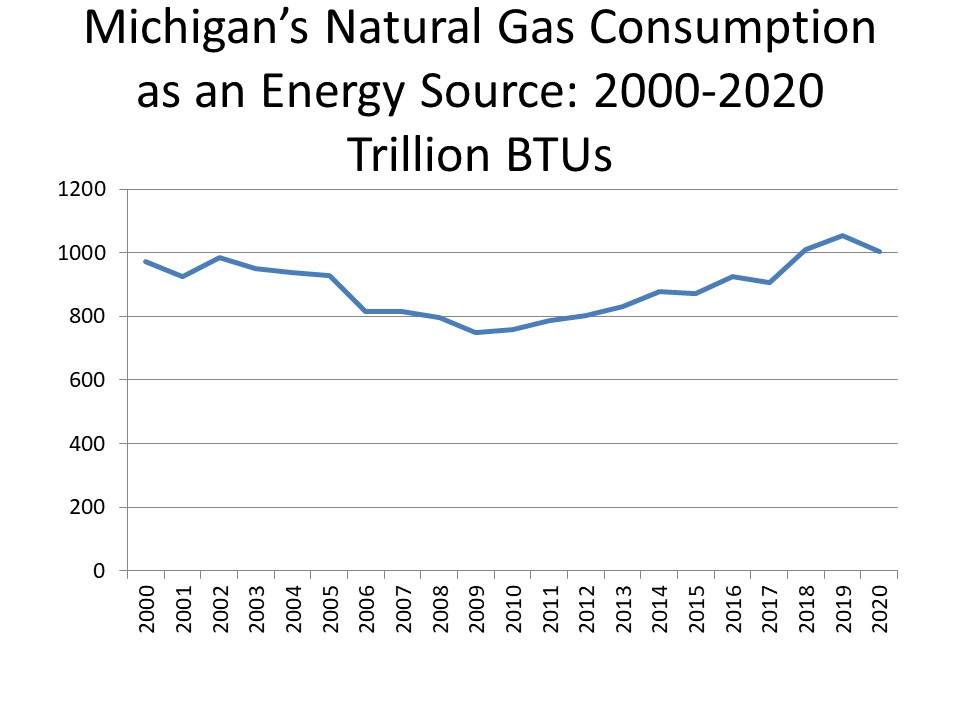
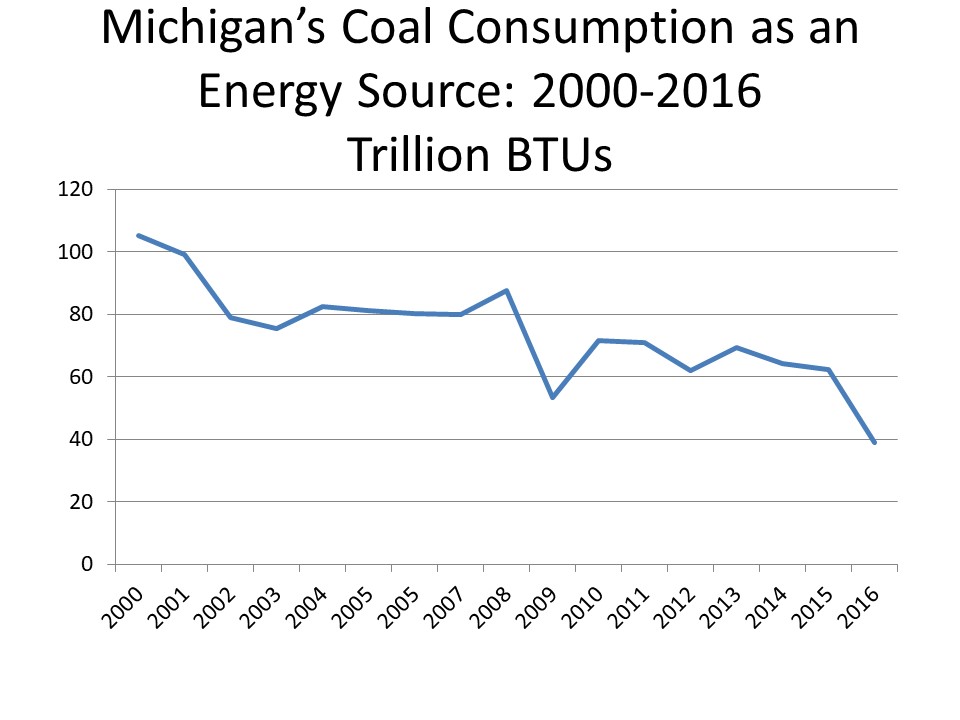
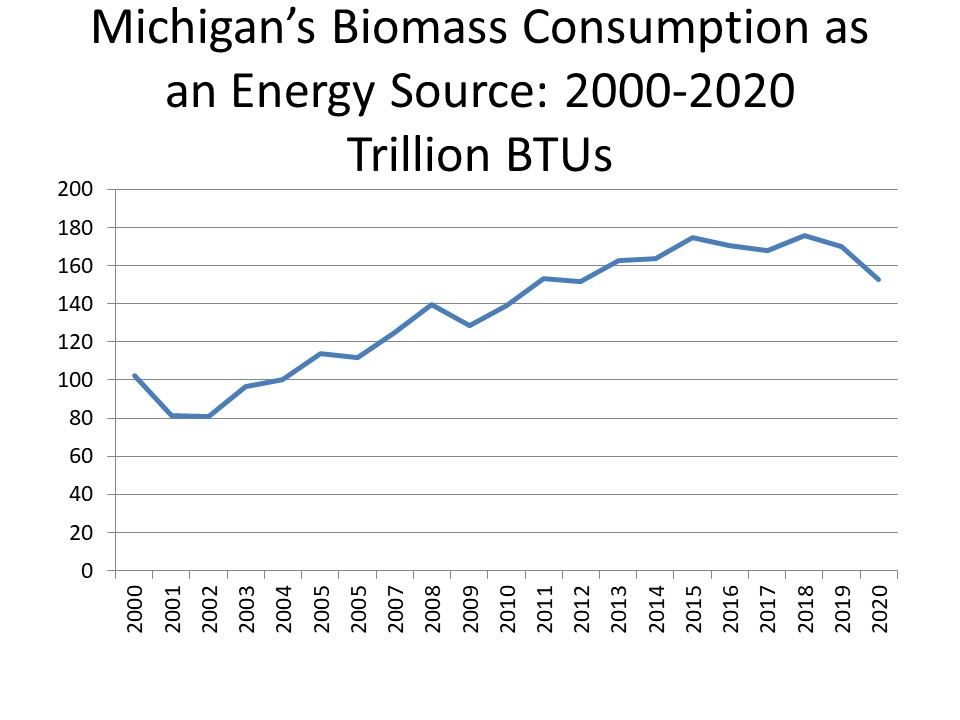
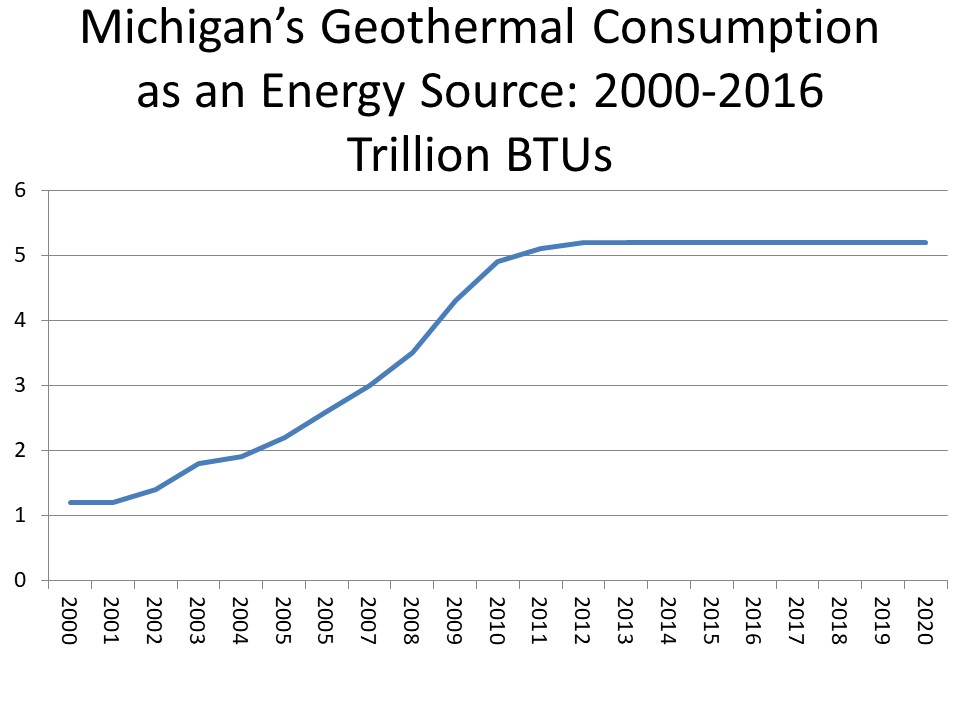
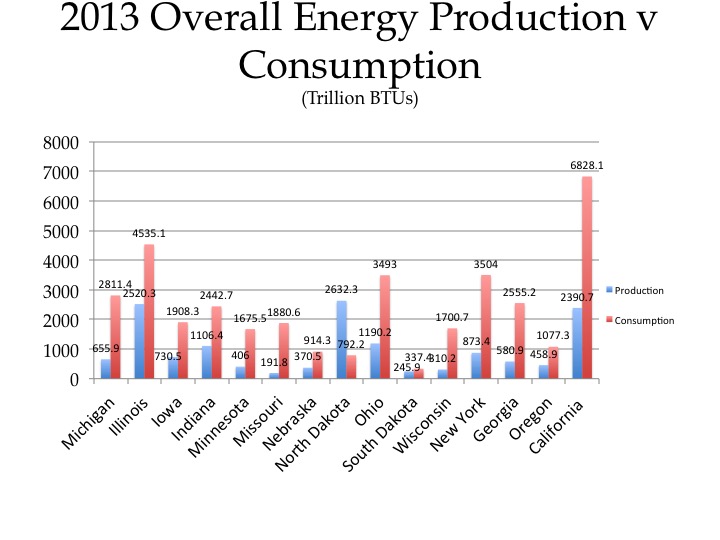
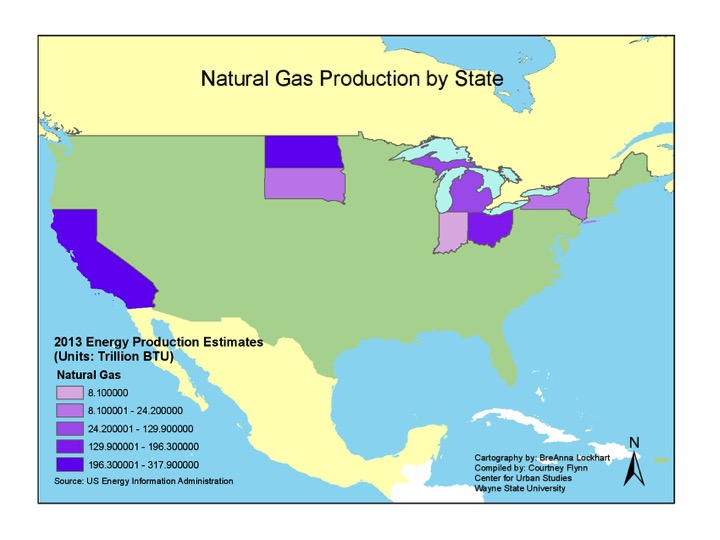
As the cost of energy continues to rise in Michigan, beyond, we will take a look at how Michigan residents receive their energy and where Michigan draws its energy from in a future post.