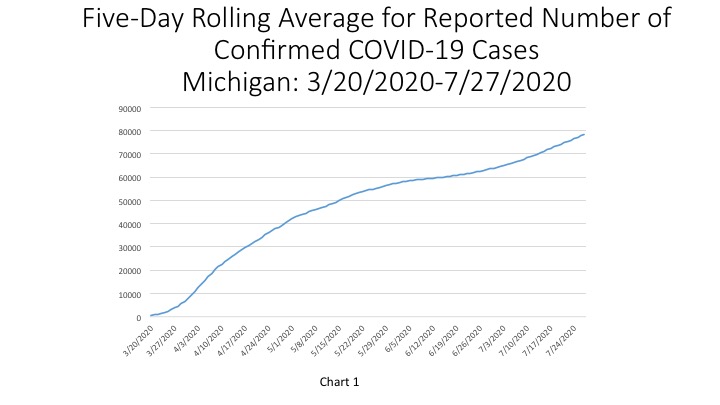
On July 29, the State of Michigan reported a cumulative total of 80,172 cases, an increase of 996 cases from the day prior. Of those 996 new cases reported on July 29, 300 of them were from a backlog in a reporting, according to the State. In Chart 1 we show that the State total for the number of COVID cases on July 27 was 78,570–a five-day rolling average. The five-day rolling average for the total number of COVID cases (Chart 1) reflects a smoother curve and adjusts for fluctuations in testing and/or the quality of reporting or failure to report.
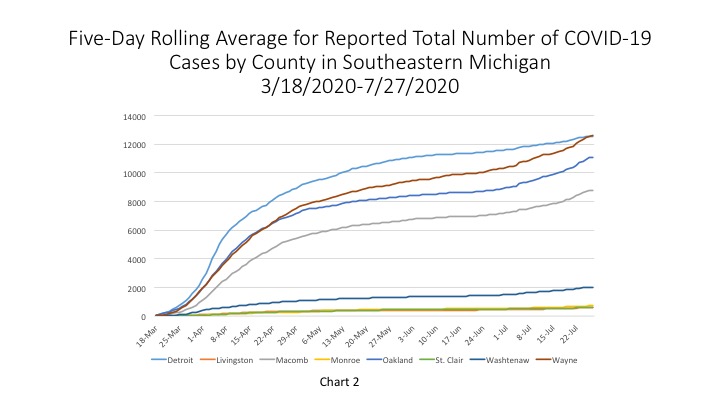
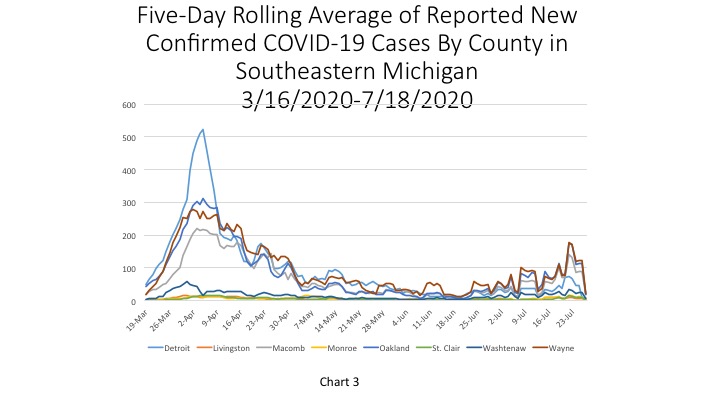
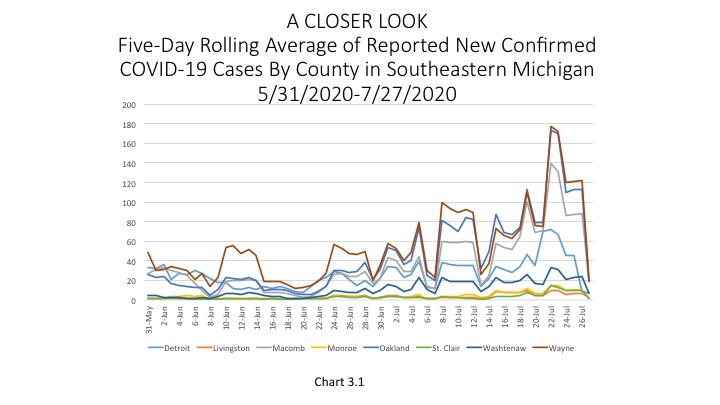
Chart 2 shows that, based on the five-day rolling averages, the growth of new COVID cases in Southeastern Michigan continues to increase, with the numbers in Wayne County now reaching above those in Detroit. On July 27, Wayne County’s numbers reached 12,589, which was above Detroit’s reported number of COVID cases at 12,574. Charts 3 and 3.1 show the new daily COVID case numbers and reflect a spike on July 22, followed by decreases in the number of new daily COVID numbers. On July 27, which is reflective of 5-day rolling average data, Wayne County reported the highest number of new cases at 20.
The daily data highlighted in these posts is from Michigan.gov/coronavirus, where data is updated daily at 3 p.m. Historical data were supplied from covidtracking.com, which republishes COVID data from the State. Additionally, the case totals do not reflect the number of people who have recovered, just those who have been infected. In early June the State changed how it reports its data on the website, making data more accurate in the long-term but more complicated to track as well. The State regularly updates older data and as we continue to publish regular updates on COVID the State’s changes to past data many not always be reflected in our posts. The data published in new posts is accurate for the day we received it on though.
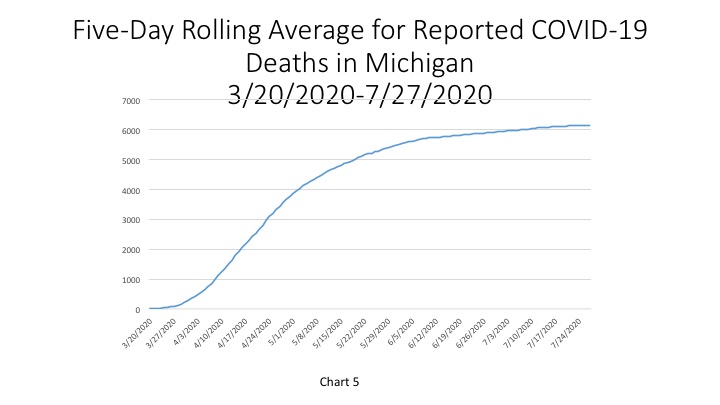
In Chart 5, the five-day rolling average for the number of deaths in Michigan, shows the cumulative number of deaths in the State of Michigan reached 6,159 on July 27. The actual cumulative COVID-19 deaths on July 29 was 6,172, an increase of 2 deaths from the prior day.
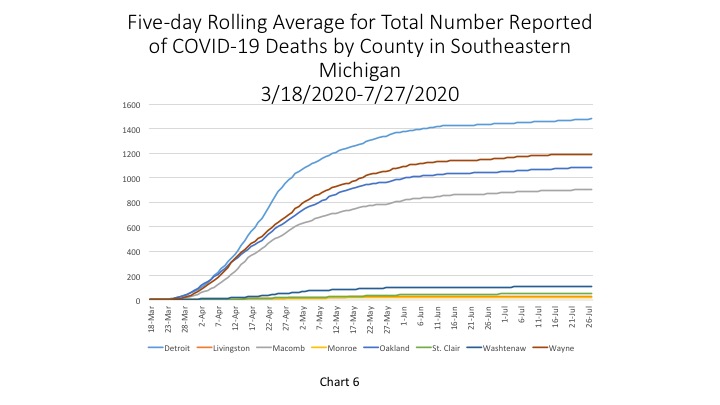
Chart 6 (a 5-day rolling average) details how the majority of COVID deaths in Michigan have occurred, and continue to occur, in Southeastern Michigan. On July 27, the City of Detroit reported 1,480 deaths. Wayne County had the second highest total at 1,192 deaths on July 27.
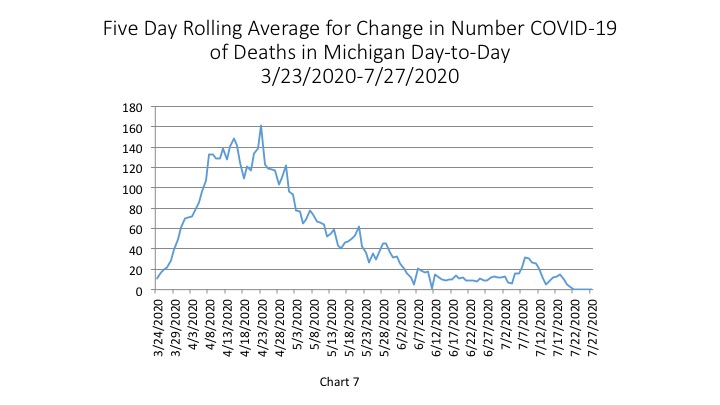
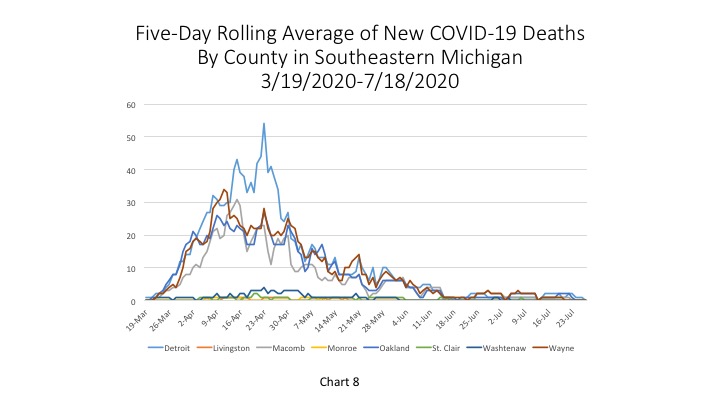
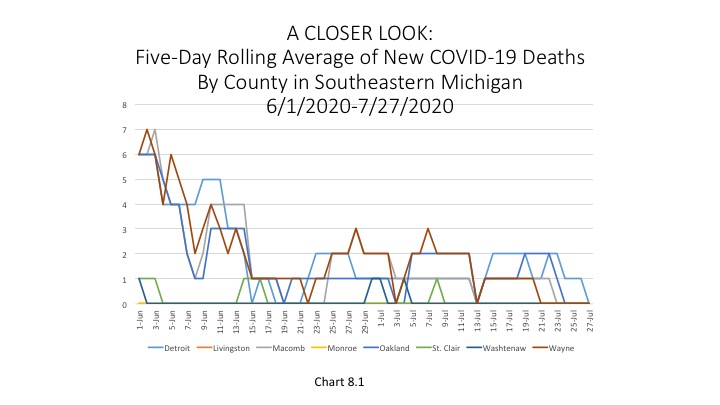
Chart 7, the five day rolling average of deaths, shows the number of new statewide deaths was reported at zero on July 27. Chart 8 and Chart 8.1 shows how the number of deaths in Southeastern Michigan have fallen to zero.