On July 20, the State of Michigan reported a total of 74,152 cases, an increase of 489 cases from the day prior. In terms of the number of new daily cases, the 489 new COVID cases reported on July 20 is a small increase from the 483 new cases reported on July 19. Of the new 489 new COVID cases, 202 were documented in Southeastern Michigan. In total, 41 percent of the new COVID cases were in Southeastern Michigan, meaning case numbers are increasing at a higher rate outside of the region than locally. In Chart 1 we show that the State total for the number of COVID cases on July 18 was 73,068–a five-day rolling average. The five-day rolling average for the total number of COVID cases (Chart 1) reflects a smoother curve and adjusts for fluctuations in testing and/or the quality of reporting or failure to report.
Chart 2 shows that, based on the five-day rolling averages, the growth of new COVID cases in Southeastern Michigan continues to increase, with the numbers in Wayne County continuing to inch closer to those being reported in Detroit. On July 18, Wayne County’s numbers reached 11,595. Detroit, which continues to have the highest overall number of cases, reported 12,178 COVID cases as of July 18. Oakland County reported 10,110 cases and Macomb County reported 8,013.
The City of Detroit had 1,817 COVID cases per 100,000 people as of July 20, an increase from 1,812 on July 19 (Chart 3). This is based upon a reported increase of 32 new COVID cases between July 19 and July 20, bringing the total number of COVID cases in Detroit to 12,223. Wayne County reported 11,085 cases per 100,000 people, and Oakland County had 810 cases per 100,000 people. These per capita rates were based upon 11,686 total cases for Wayne and for 10,191 Oakland. Macomb County reported 928 cases per 100,000 people, which is based upon 8,107 cases.
The daily data highlighted in these posts is from Michigan.gov/coronavirus, where data is updated daily at 3 p.m. Historical data were supplied from covidtracking.com, which republishes COVID data from the State. Additionally, the case totals do not reflect the number of people who have recovered, just those who have been infected. In early June the State changed how it reports its data on the website, making data more accurate in the long-term but more complicated to track as well. The State regularly updates older data and as we continue to publish regular updates on COVID the State’s changes to past data many not always be reflected in our posts. The data published in new posts is accurate for the day we received it on though.
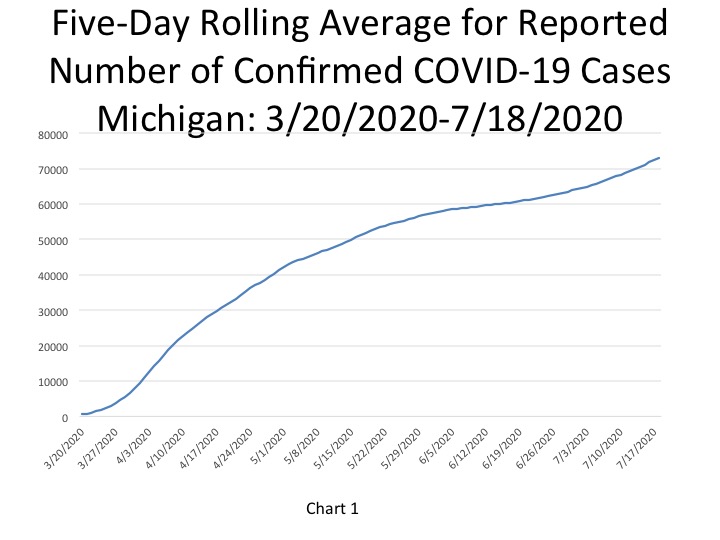
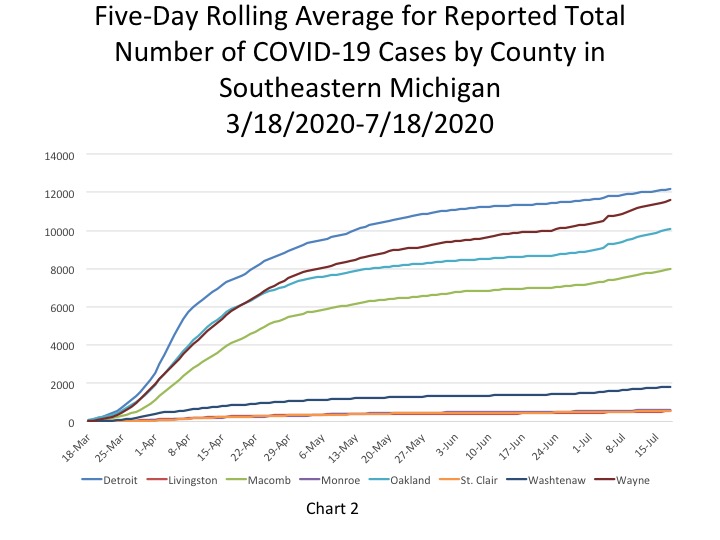
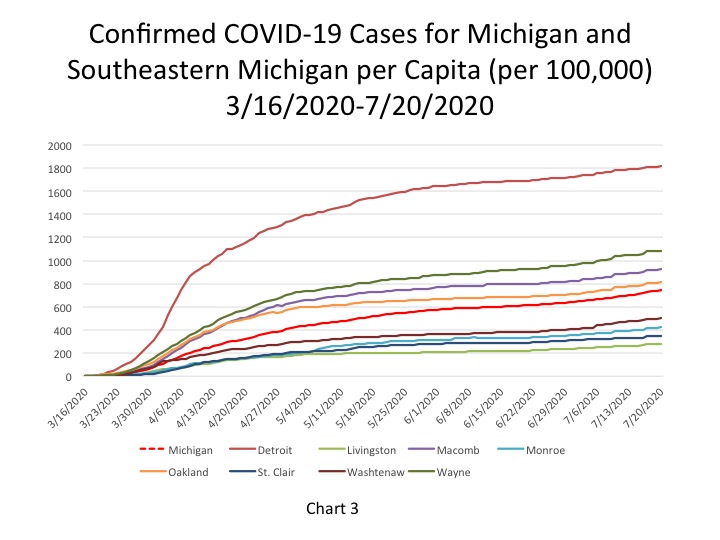
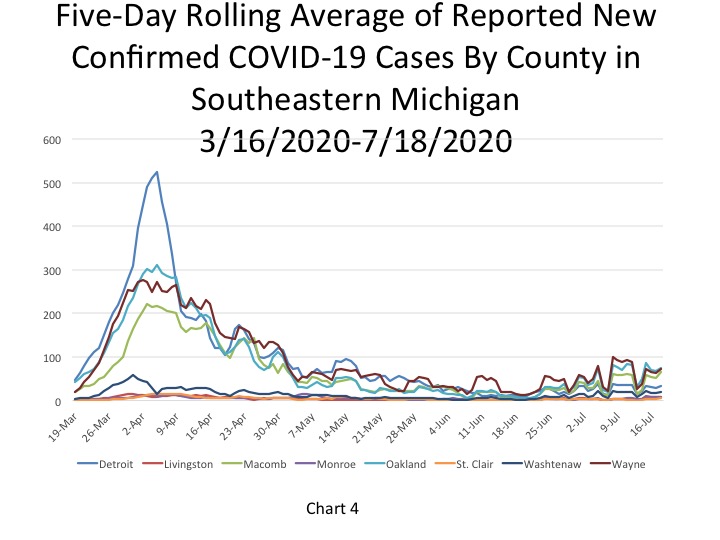
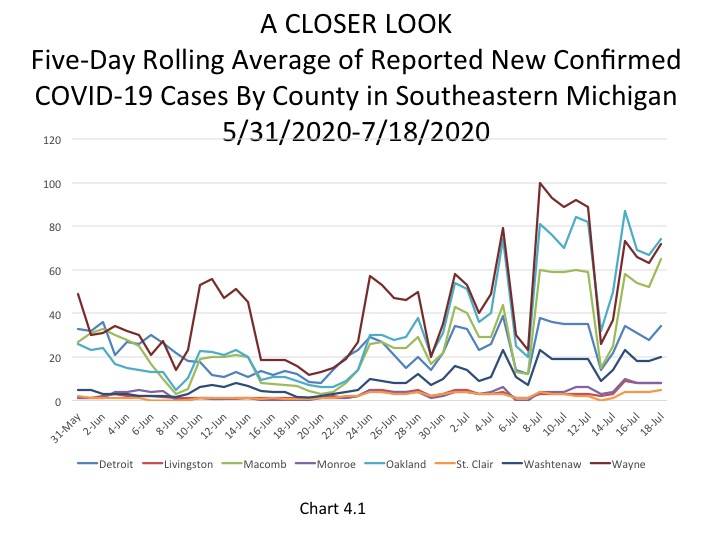
Chart 4 shows that Oakland County has been reporting the highest number of daily cases, according to the five-day rolling average, in about the last week. On July 18, Oakland County reported 74 new daily cases; Chart 4.1 also shows this, but at a more zoomed in level. The charts also show that Detroit reported 34 new cases on July 18, which is lower than the new cases reported out of Macomb and Wayne counties as well. Macomb County reported 62 new cases and Wayne County reported 72.
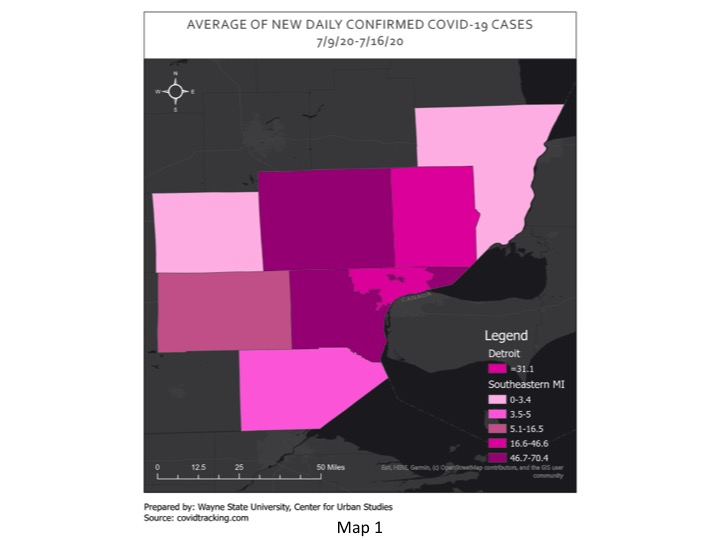
Map 1, which shows the average number of new daily COVID cases between July 9 and July 16 for Southeastern Michigan, highlights how Wayne County had the highest average number of new cases at 70.4, but Oakland County was right behind it with an average of 68.8. new cases. The map also shows that for Detroit the average number of new cases last week was 31.1 and it was 46.6 for Macomb County. As the data above shows, all four of those entities, and the remaining counties in the region all reported lower average weekly numbers for new daily COVID cases between July 9-16 than what was reported on July 18.
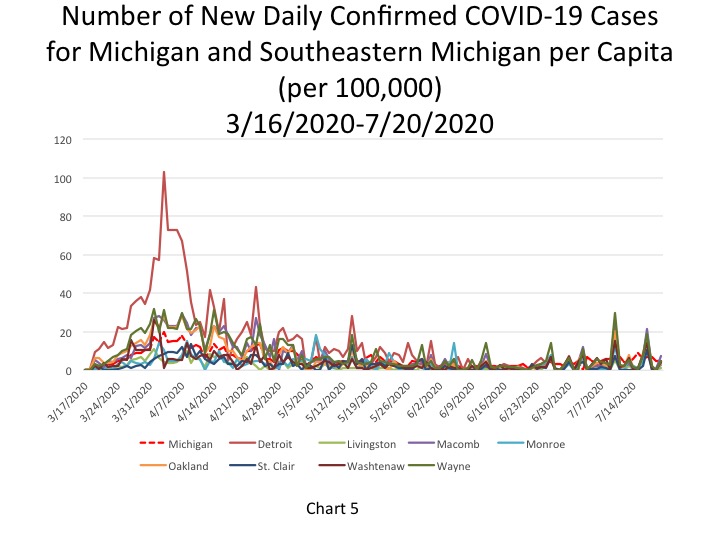
On July 20, the per capita rate for the number of new daily COVID cases per 100,000 people was 5 for the State, which was equivalent to 482 new cases (Chart 5). Detroit and Wayne County also each reported a per capita rate of 5 new daily COVID cases per 100,000 people on July 20, which was equivalent to 32 and 50 new cases, respectively. Macomb County was the only entity in the region to report a higher per capita rate than the State. Macomb County reported a per capita rate of 7 which was equivalent to 65 new daily cases. Oakland County reported a per capita rate of which was equivalent to 42 new cases. In Southeastern Michigan there were 202 new COVID cases reported on July 20.
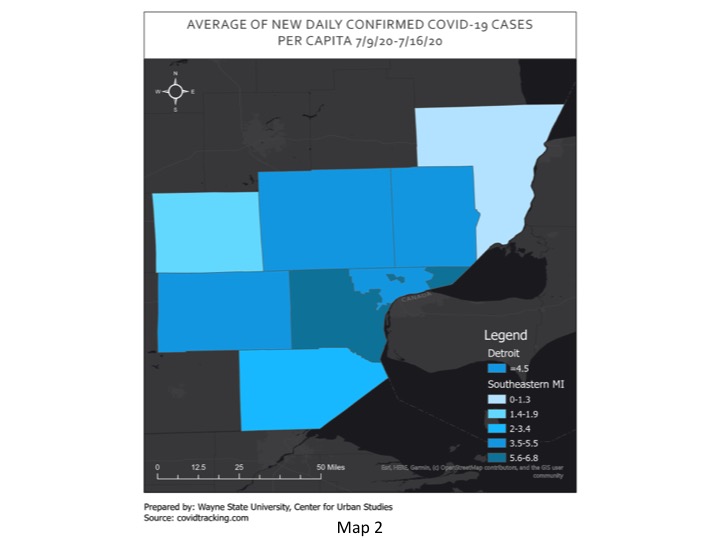
Map 2 mimics the message of Map 1, with Wayne County having the highest average number of daily confirmed COVID cases per 100,000 between July 9 and July 16. During that week Wayne County had an average of 6.8 daily COVID cases per 100,000 people. Detroit averaged a per capita rate of 4.5 during that time frame.
In Chart 6, the five-day rolling average for the number of deaths in Michigan, shows the number of deaths in the State of Michigan reached 6,114 on July 18. The actual cumulative COVID-19 deaths on July 20 was 6,126, an increase of 7 deaths from the prior day. Of the 7 deaths that were reported on July 20, 4 occurred in Southeastern Michigan.
Chart 7 (a 5-day rolling average) further hones in on where the majority of the COVID deaths in Michigan have occurred, and continue to occur, in Southeastern Michigan. As of July 18, the City of Detroit had reported 1,467 deaths. Wayne County had the second highest total at 1,190 deaths on July 18.
The per capita rates for the number of total COVID deaths in Southeastern Michigan continues to remain fairly stagnant across the region. Detroit reported 218 total COVID deaths per 100,000 people on July 20, which was equivalent to 1,468 deaths. Wayne County reported a per capita rate of 111 (1,191 deaths), Macomb County reported a per capita rate of 103 (892 deaths) and Oakland County reported a per capita rate of 86 (1,076 deaths). The State of Michigan reported a per capita rate for the number of total COVID deaths at 61 per 100,000 people, which was equivalent to 6,126 total deaths.
Chart 9, the five day rolling average of deaths, shows the number of new statewide deaths was reported at 15 on July 18. Furthermore, Chart 10 and Chart 10.1 shows how the number of deaths in Southeastern Michigan continues to remain low. Chart 10.1 shows a more in-depth look at the number of new daily COVID deaths in the last month so viewers can better discern where in the Southeastern Michigan the numbers are increasing, decreasing or remaining the same. Detroit reported 2 new daily deaths on July 18 while Macomb, Oakland and Wayne each reported 1.
In Map 3, Wayne and Oakland counties had the highest average number of daily COVID deaths between July 9 and July 16 at 1.5 and Detroit averaged 1.3 deaths. Macomb County averaged 1 death during that time frame. The averages last week reported in the map are similar to the daily death numbers that have been being reported in Southeastern Michigan.
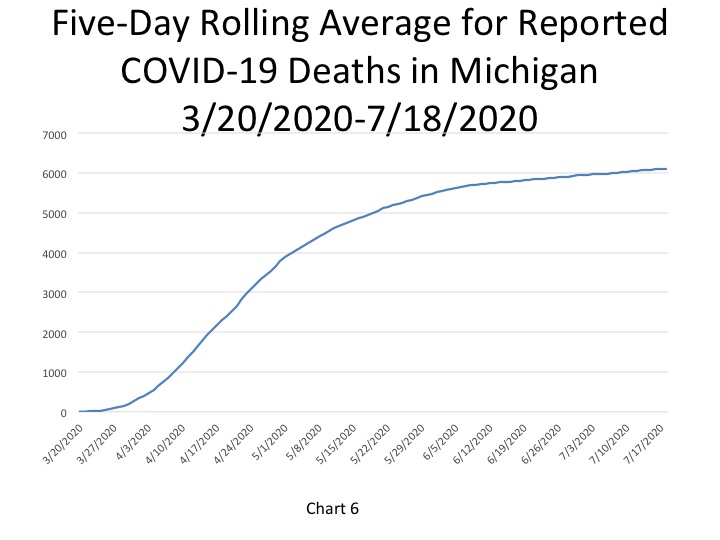
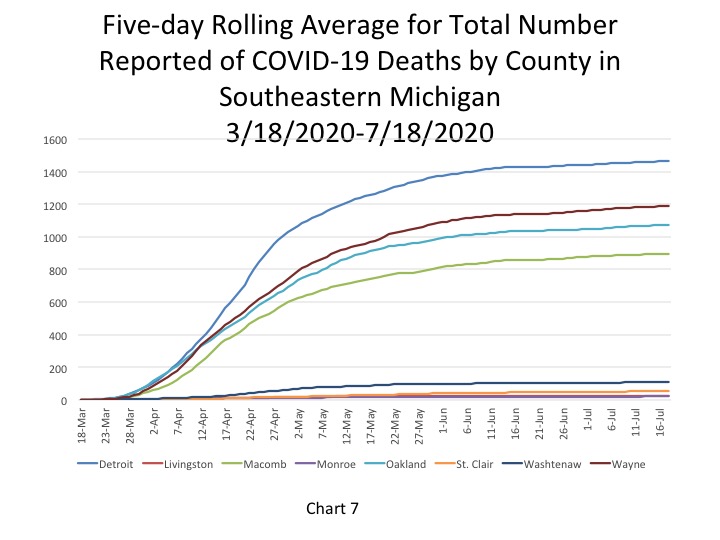
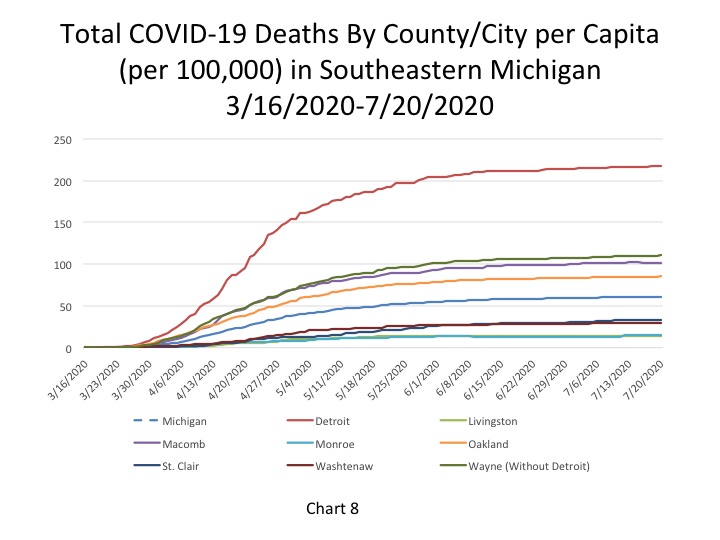
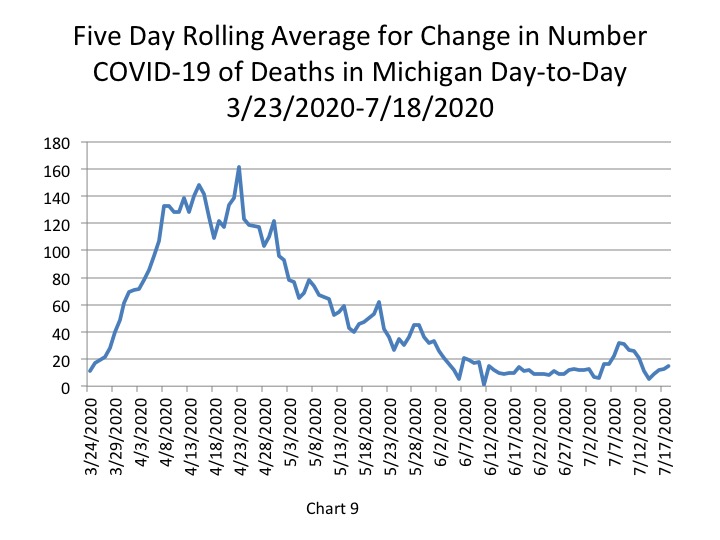
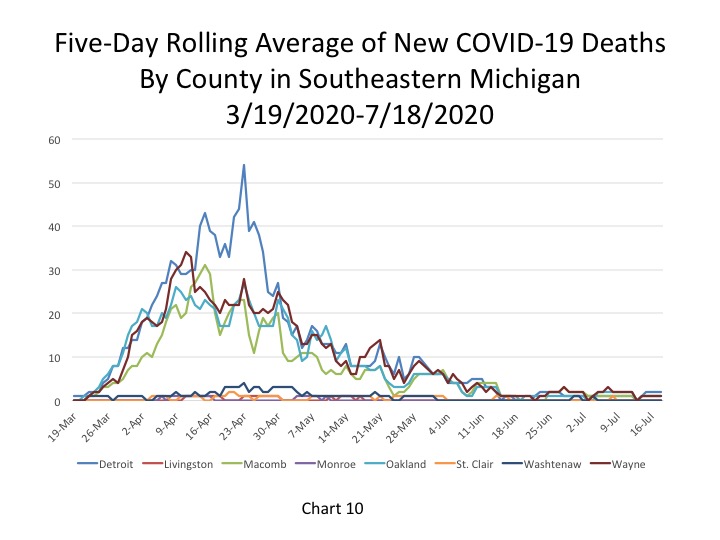
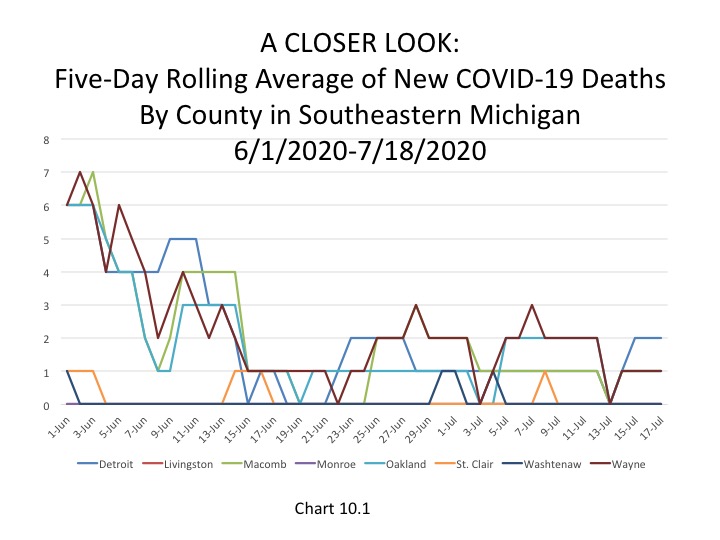
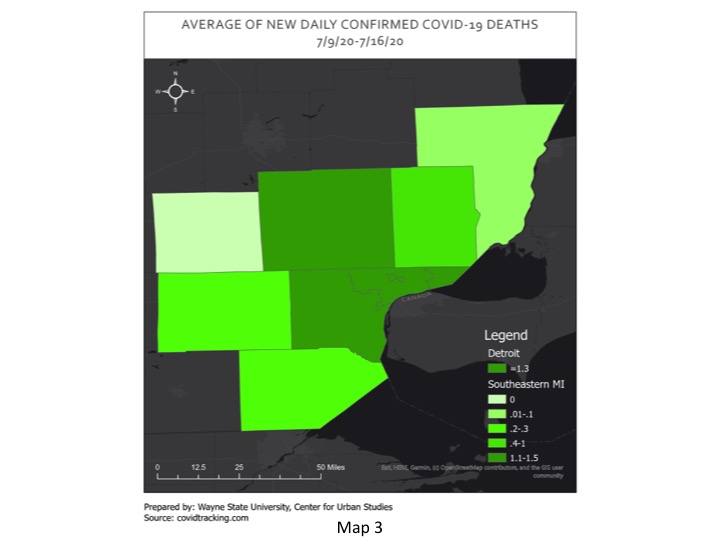
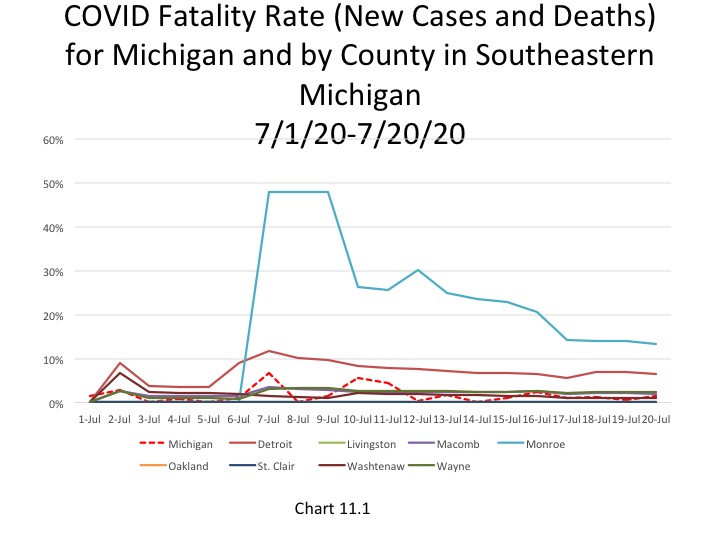
Chart 11.1 shows the fatality rate for just the month of July with the cumulative number of new cases and deaths for only this month. This chart was created in recognition that case and death numbers are lower than they were even a month ago and to highlight how even if case numbers spike death numbers continue to remain low. Using only July cumulative data for the new number of cases and deaths, Monroe County has recently had the highest fatality rate, which was reported at 13.4 percent on July 20, which is based on 13 new cumulative deaths since the beginning of July and 97 new cumulative cases. The overall fatality rate for most of the region is much higher than the new recent cumulative look we are exploring. For example, the City of Detroit had an overall fatality rate of 12 percent on July 20 but with a more recent look, which includes lower new daily case and death numbers, it was 6.45 percent (as shown in the chart below).
On July 20 the State of Michigan reported 489 new COVID cases, which is amongst the lowest daily total reported in about a week. With weekend numbers reaching close to 700, the decline is welcomed but also means we—as a State and a society—have a ways to go to get to a more manageable number of new daily case numbers.