Various blog posts drawing attention to the income disparities that exist throughout Southeastern Michigan have appeared on Drawing Detroit. This particular post though is more visual in its depiction of income throughout the region at the county and municipal levels. In particular, this post presents the 2013 median household income for the seven counties in the region, along with the municipalities in the tri-county region, in a cartogram form.
A cartogram is a geographic representation method that alters the area and shape of locations, while still preserving their spatial relationships, in order to demonstrate the relative relationship of a data feature. This method allows the cartographer to change the way the map is experienced visually, by applying weight to data, while also maintaining geographic relationships.
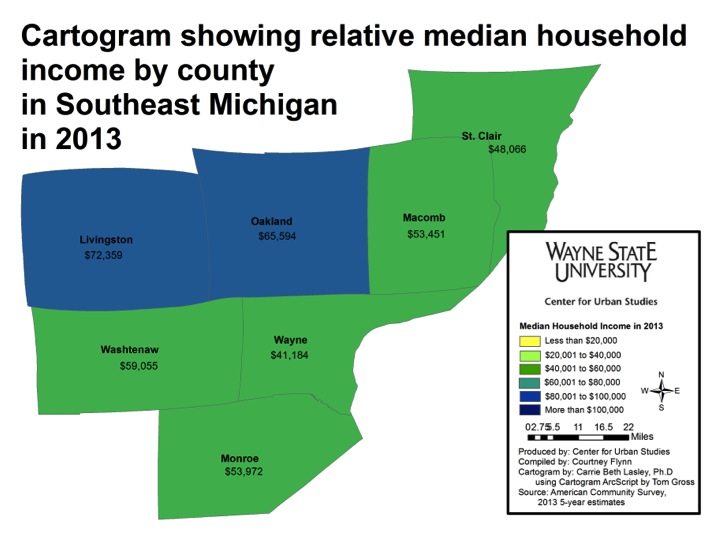
Of the maps presented in this post, the above map is the least skewed in terms of income in relation to the size of the counties. Livingston County, which had the highest median household income in 2013 at $72,359, appears only slightly larger than its size on a normal scale. There is also a noticeable difference in the size of Wayne County, which had a median household income of $41,138 in 2013. This was the lowest median household income of all the seven counties.

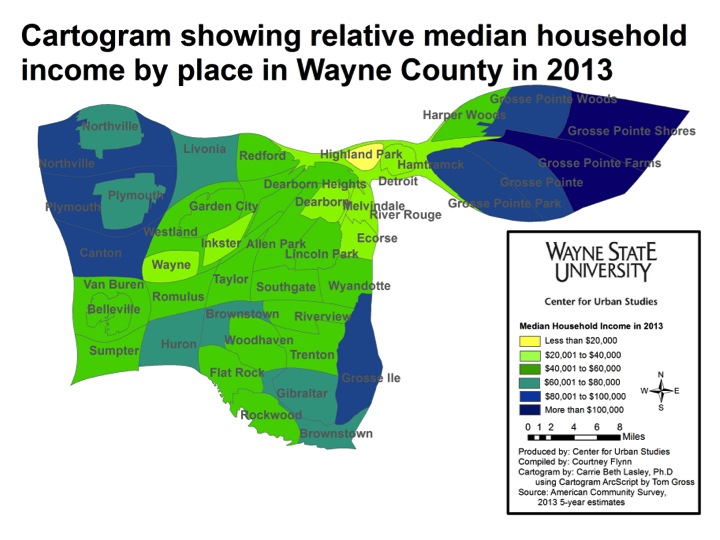
The above two maps truly highlight the income disparities in the tri-county region, particularly in Wayne County. In both maps, the Grosse Pointes stand out as having median household incomes above $80,001. Grosse Pointe Woods ($105,071) and Grosse Pointe Farms ($107,152) had the highest incomes in that area.
In looking at both maps we see that Detroit simply serves as a low-income small connector between wealthy municipalities like the Grosse Pointes and the Plymouth area. Because the size of a municipality in these maps is determined by relative median household income and not geographic size, Detroit, which is the largest city by population in the state of Michigan, does not draw the visual attention it typically would. It has been dramatically impacted by its low median household income of $26,325 in 2013.
Another notable municipality with a high median household income is Lake Angelus in Oakland County. Lake Angelus is only 1.6 square miles but in the above map we see that its median household income makes it larger (in the cartogram) than cities such as Pontiac, Detroit, Warren and Mount Clemens. Lake Angelus had a median household income of $163,393 in 2013.
Other municipalities whose size appears larger in these maps because of their median household income were: Bloomfield Hills ($147,969), Novi Township ($108,125), Plymouth Township ($86,217), Canton ($81,667), Northville Township ($97,161), Grosse Ile ($88,238), and Orchard Lake ($137,321).
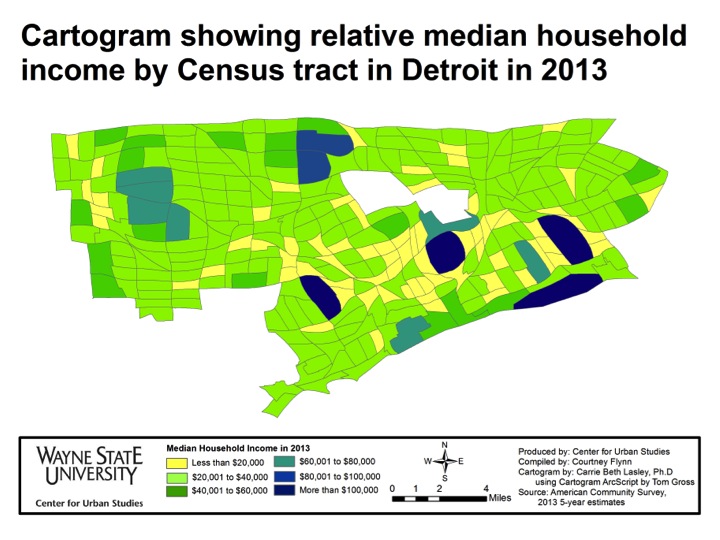
The above cartogram looks at median household income in Detroit by Census Tract in 2013. Areas making less than $20,000 greatly outnumber those making $80,000 or more. Riverview, Midtown, Rosedale Park and Indian Village swell greatly due to their high median income, while areas like Palmer Park and Grandmont-Rosedale also increase in size at the expense of areas like Brightmoor, Briggs, Core City and Poletown.
By viewing a municipality’s size in relation to the median household income we are able to gain a better understanding of where higher household incomes are located in Southeastern Michigan. These maps show that much of the wealth in the region is located in the northeastern and northwestern portions of Wayne County and throughout Oakland County.