Detroit’s housing costs increasing faster than incomes

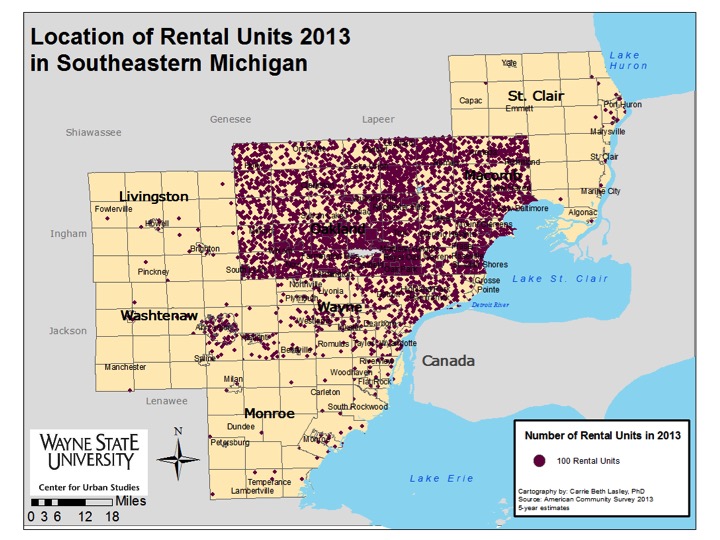
Throughout Southeastern Michigan monthly housing costs for renters are increasing generally faster than their monthly household incomes, which in many cases are actually declining, according to data from the American Community Survey. Even in areas where the renters’ incomes improvements exceeded the change in overall regional housing costs between 2010 and 2013, monthly housing costs continued to increase at a rapid pace. There were areas in the region though, particularly Oakland County, where monthly housing cost increases stayed below the monthly household income increases. However, Detroit’s overall housing costs generally increased at a faster pace than the monthly income changes (largely declines) of residents.

Slide03


Slide04

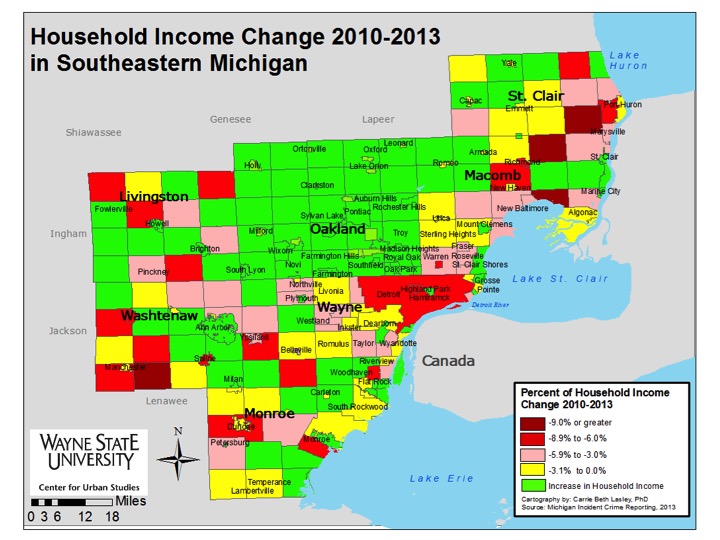
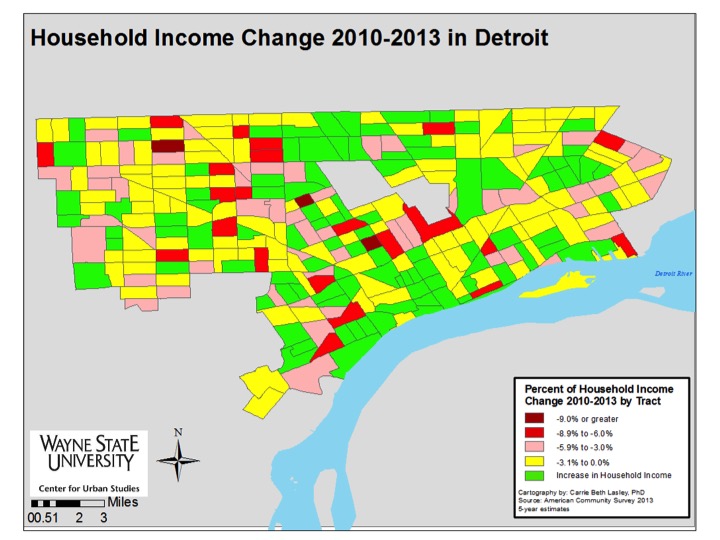
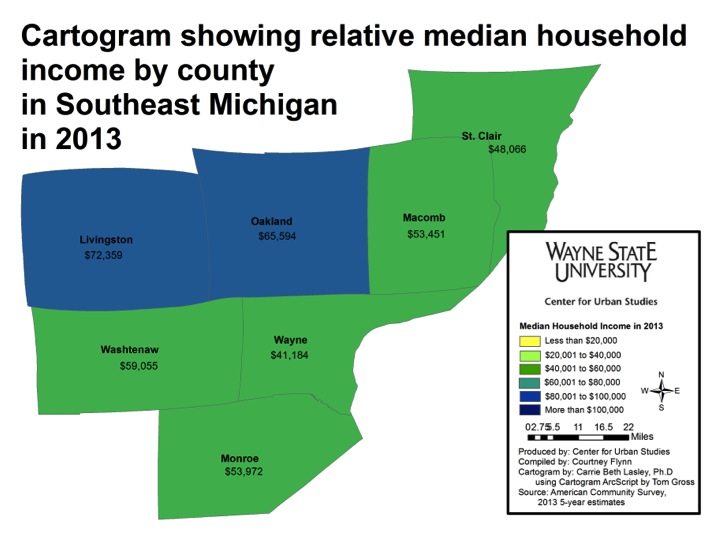
Between 2010 and 2013 all Oakland County communities experienced an increase in household income while many communities throughout the rest of Southeastern Michigan continued to experience a decrease in their household income. St. Clair County had the most communities where the household income decreased more than 9 percent (three-Columbus, Ira and Kimball townships) between 2010 and 2013; the only other county where a community had such an income decrease was Washtenaw with Bridgewater Township.

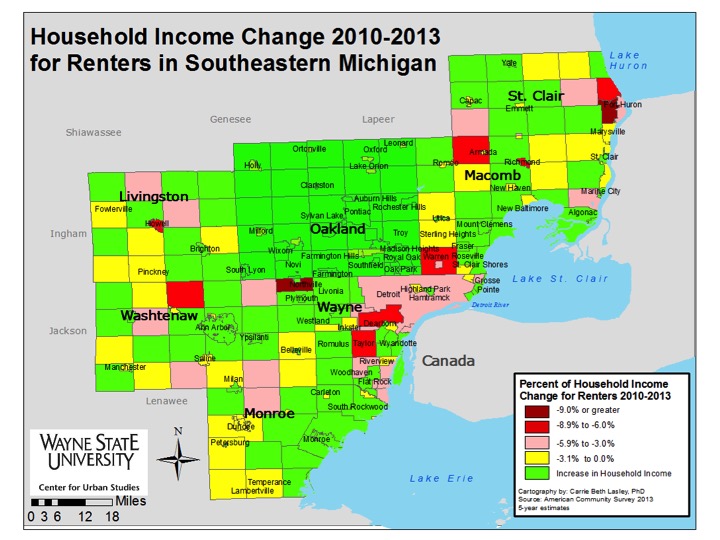
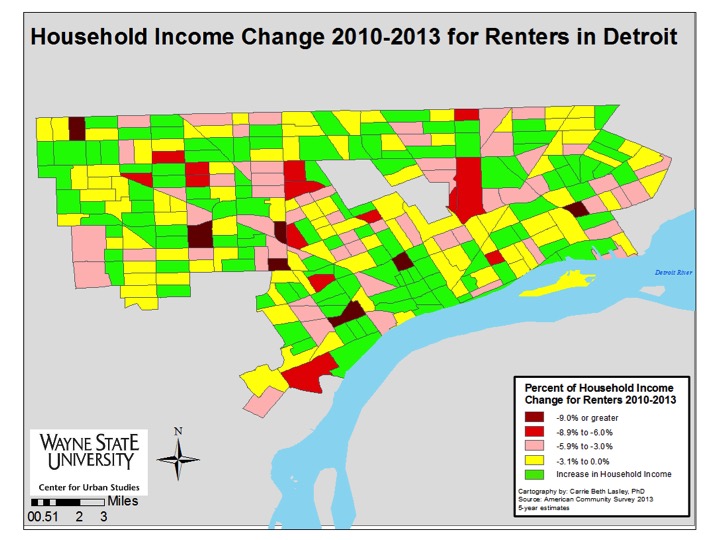
When just looking at renter’s income change between 2010 and 2013 we see that there were fewer households that experienced an income decrease and more that saw their incomes increase.

According to Governing.com, Michigan is one of three states that suffers from housing affordability burdens, particularly in the rental realm. Incomes may be increasing throughout the state, but for renters earning minimum wage, those small increases often equate to the increases in monthly housing costs, especially as demand for rental units remains high.

Slide06

RentMoreHHI (1)
Slide08

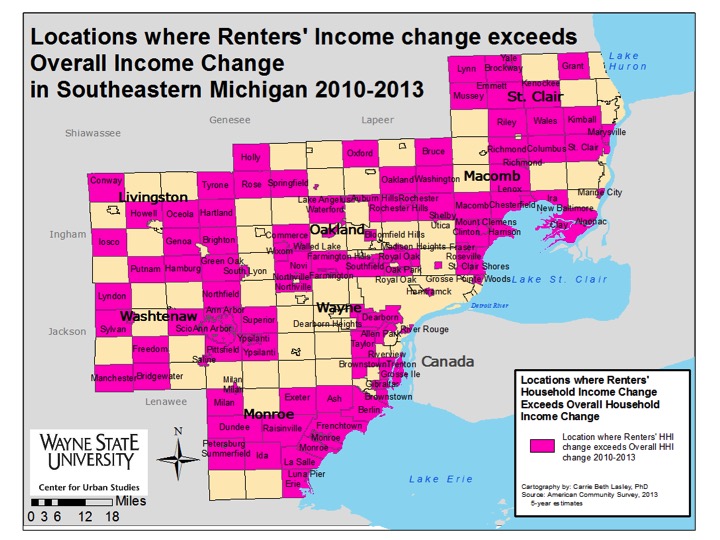
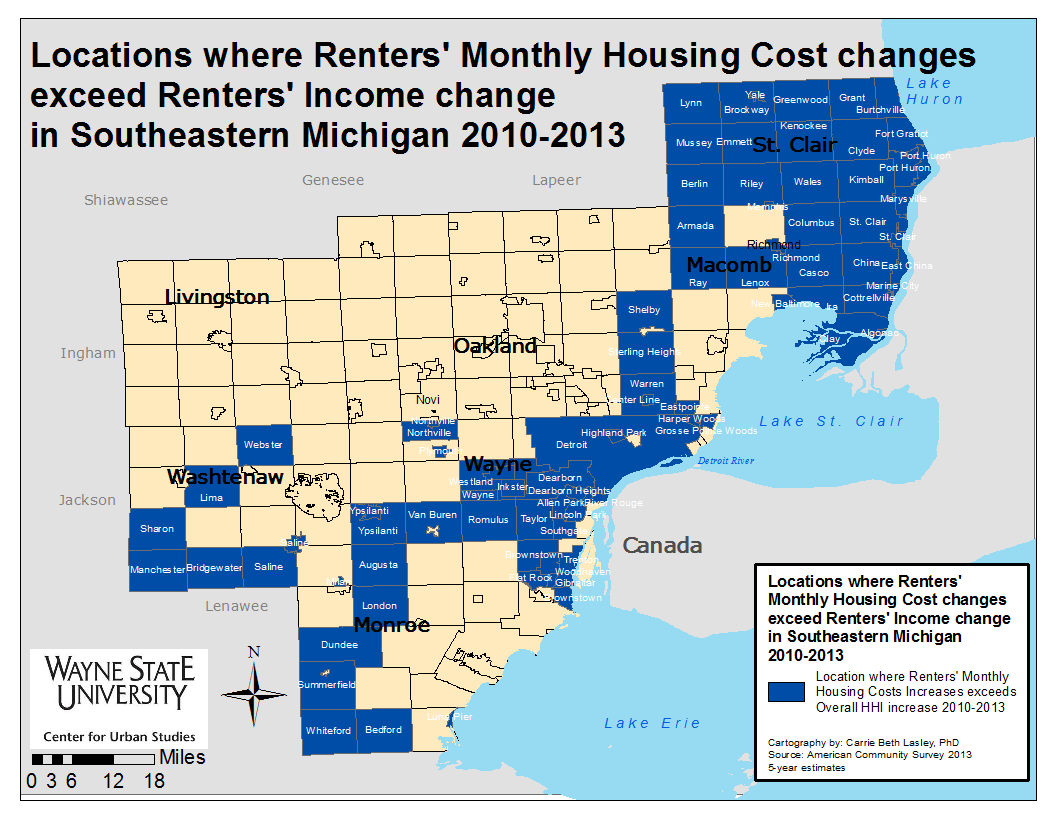
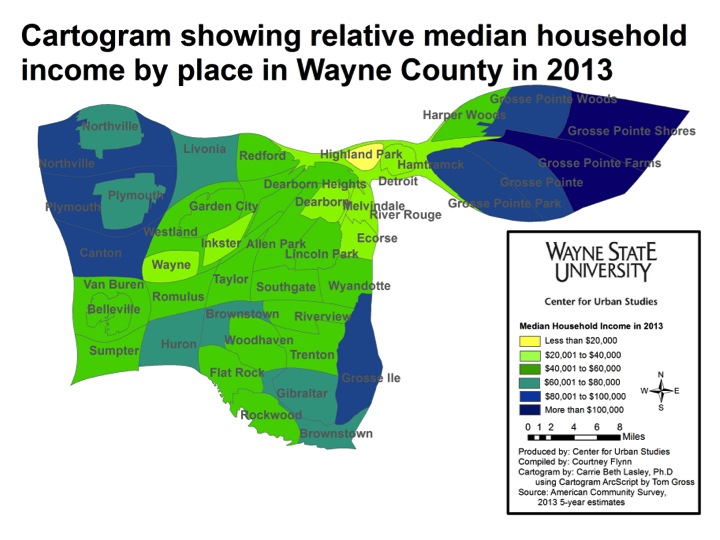
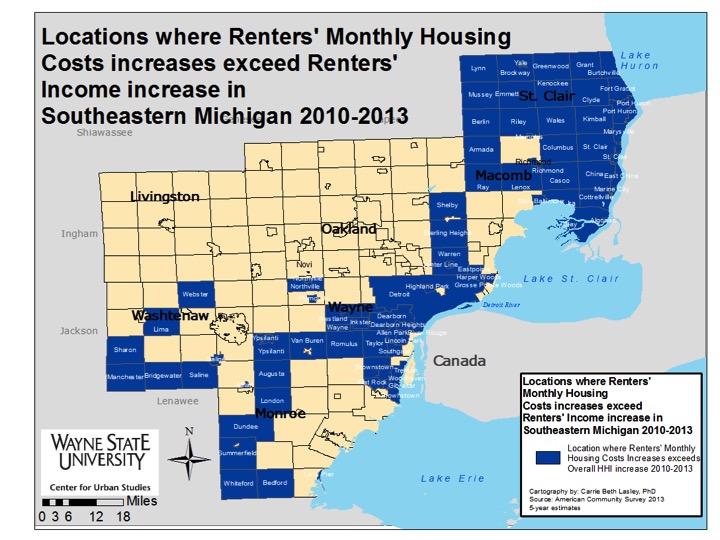
Despite renters throughout the region experiencing income increases, these increases were not equal to or more than their housing costs in several communities. In St. Clair County all of the communities experienced housing cost changes above those of the renters’ monthly income. This was not unique to just St. Clair County though. Rather every county in the region, with the exception of Livingston and Oakland, had renters whose income changes weren’t keeping up with their housing cost increases. With increases in Oakland County’s renters’ income outpacing their monthly housing cost increases this could mean a number of things, including: rental prices are not increasing as quickly as places such as Detroit or Warren because demand is lower; these renters’ incomes are growing as the economy stabilizes (for places like Ferndale, Royal Oak and Rochester we see their income increases are above that of non-renters) while in areas like Detroit the median household income is lower, income growth can’t keep up with cost of housing increases.

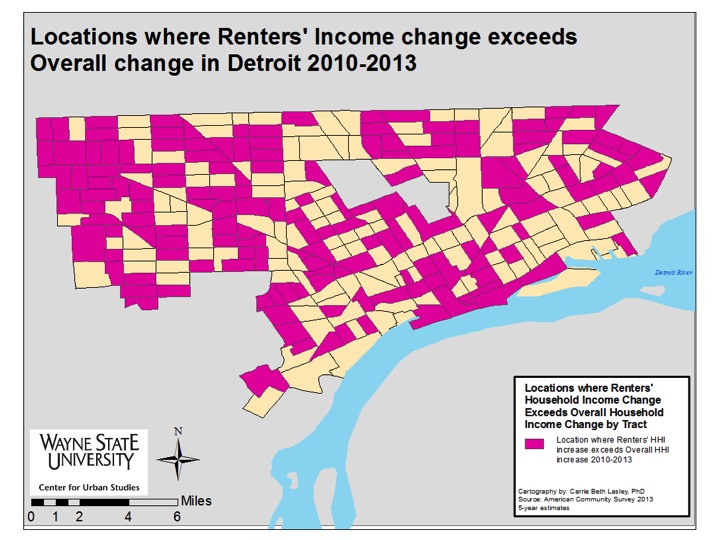
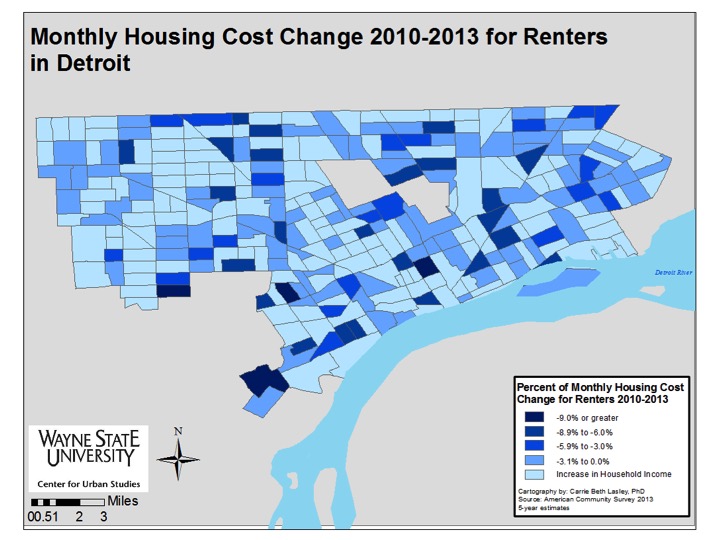
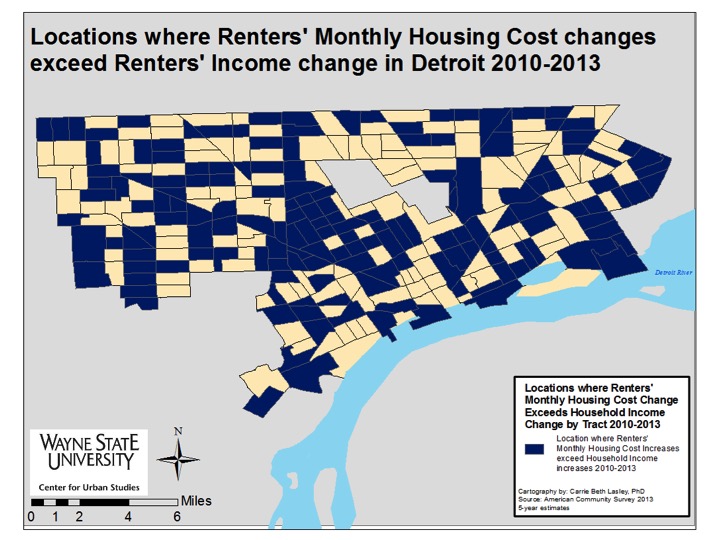
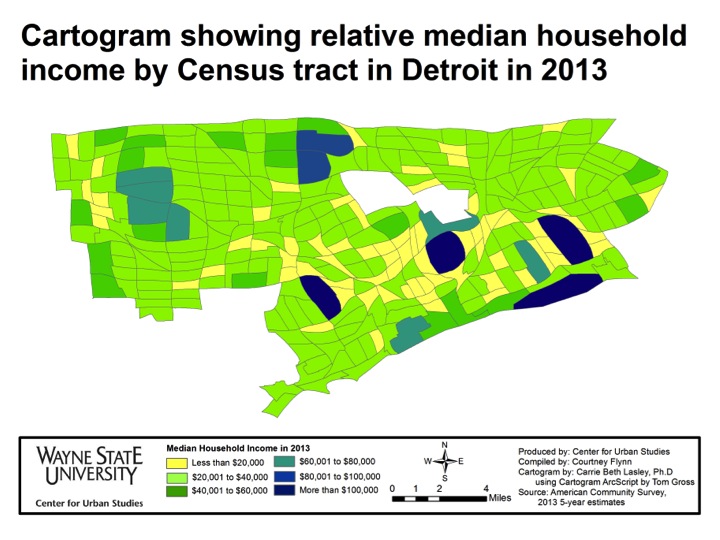
A series of five maps drilling down into the City of Detroit (presented below) shows that pockets of the city experienced household income growth between 2010 and 2013. While there was some overlap between overall income growth and renters’ income growth, this wasn’t true for every Census Tract. One area where there was such a difference was just east of Hamtramck. Here we see that Census Tract experienced overall income growth between 2010 and 2013 but the renters there did not see their incomes increase. Renters in that area also experienced monthly housing cost increases that exceeded their income changes. In this area of the city, homeownership also appears to be more prevalent than in other areas of the city.

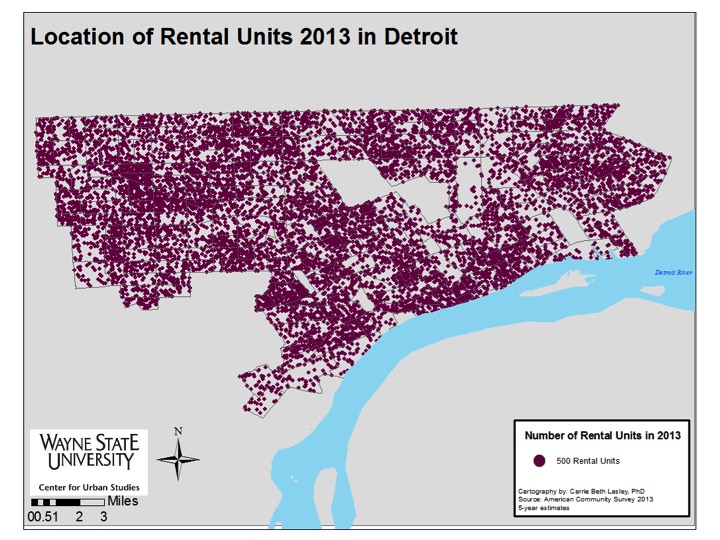
Throughout other parts of the city we see that the majority of Census Tracts experienced an increase in renters’ household income between 2010 and 2013. But, the increases in monthly housing cost offset most income increases. This could indicate a shift toward gentrification in some areas as long-term, lower-income renters cannot afford increasing monthly housing costs as demand for rental units in Detroit continues to grow. With a current vacancy rate of 5 percent and a desire for many suburbanites to live in areas such as Downtown, Midtown and Corktown, housing costs in the city continue to grow, according to the MetroTimes (link). It is these areas where renters experienced income growth well above the overall changes in the City of Detroit. Not every Census Tract in these neighborhoods though had renters with income changes above the overall change experienced by the city as whole.

Slide11

Slide12

Slide13

Slide14

Slide15

Detroit rental units

Veterans in SE Michigan tend to fare better with income and employment

Last week we examined where veterans live throughout the seven-county region of Southeastern Michigan and this week we take a deeper look into the socioeconomic picture for the region’s veterans. Overall, we see that veterans in the region in 2013 tended to have a higher median income level than non-veterans. Also we see that a lower percentage of veterans in the area fell under the poverty line in 2013 than non-veterans. Unemployment status for veterans throughout the region, however, varied.

This data presented in the maps below is from the 2013 American Community Survey.

When looking at median income in Southeastern Michigan at the municipal level, we see that it tended to be higher for veterans than it was for non-veterans. Municipalities such as Bloomfield Hills, Orchard Lake, and Lake Angelus – all of which have higher median income levels than the region as a whole (link to post) – also had higher veteran median income levels than a city such as Highland Park, for example, which has low median income levels.

It should be noted, however, that veterans make up a smaller portion of the population than non-veterans, and as a result, sample size may have had an influence on these numbers.

The unemployment rate among veterans varied much more than it does among non-veterans. The rate among veterans varied from 0.6 percent to 43.4 percent For non-veterans, it ranges from 2.2 percent to in 34.4 percent The locations with high unemployment also varied significantly between veterans and non-veterans, with 12 locations across five counties having over 25 percent unemployment among veterans – rates that were only seen in Detroit and Highland Park among non-veterans.

A lower percentage of veterans were below poverty status, compared to non-veterans throughout Southeastern Michigan. For both veterans and non-veterans, Highland Park had the highest percentage of residents below the poverty line: 46.2 percent of non-veterans and 25.2 percent of veterans. Only two other municipalities had more than 21.5 percent of veterans living below the poverty line: Chelsea (37.9%) and Hazel Park (27.7%). Clyde Township (0.2%) had the lowest percentage of veterans living below the poverty line.

While there were only three municipalities with 21.5 percent or more of veterans living below the poverty line, there were nine municipalities throughout the region where 21.5 percent or more of the non-veteran population was living below the poverty line. Such municipalities included Ecorse, Detroit, Pontiac, Ypsilanti and Port Huron.

Overall we see that while veterans appeared to fare better than non-veterans in terms of income and poverty status, and in some cases employment.

Median income provide different view of Southeastern Michigan

Various blog posts drawing attention to the income disparities that exist throughout Southeastern Michigan have appeared on Drawing Detroit. This particular post though is more visual in its depiction of income throughout the region at the county and municipal levels. In particular, this post presents the 2013 median household income for the seven counties in the region, along with the municipalities in the tri-county region, in a cartogram form.

A cartogram is a geographic representation method that alters the area and shape of locations, while still preserving their spatial relationships, in order to demonstrate the relative relationship of a data feature. This method allows the cartographer to change the way the map is experienced visually, by applying weight to data, while also maintaining geographic relationships.

Of the maps presented in this post, the above map is the least skewed in terms of income in relation to the size of the counties. Livingston County, which had the highest median household income in 2013 at $72,359, appears only slightly larger than its size on a normal scale. There is also a noticeable difference in the size of Wayne County, which had a median household income of $41,138 in 2013. This was the lowest median household income of all the seven counties.

The above two maps truly highlight the income disparities in the tri-county region, particularly in Wayne County. In both maps, the Grosse Pointes stand out as having median household incomes above $80,001. Grosse Pointe Woods ($105,071) and Grosse Pointe Farms ($107,152) had the highest incomes in that area.

In looking at both maps we see that Detroit simply serves as a low-income small connector between wealthy municipalities like the Grosse Pointes and the Plymouth area. Because the size of a municipality in these maps is determined by relative median household income and not geographic size, Detroit, which is the largest city by population in the state of Michigan, does not draw the visual attention it typically would. It has been dramatically impacted by its low median household income of $26,325 in 2013.

Another notable municipality with a high median household income is Lake Angelus in Oakland County. Lake Angelus is only 1.6 square miles but in the above map we see that its median household income makes it larger (in the cartogram) than cities such as Pontiac, Detroit, Warren and Mount Clemens. Lake Angelus had a median household income of $163,393 in 2013.

Other municipalities whose size appears larger in these maps because of their median household income were: Bloomfield Hills ($147,969), Novi Township ($108,125), Plymouth Township ($86,217), Canton ($81,667), Northville Township ($97,161), Grosse Ile ($88,238), and Orchard Lake ($137,321).

The above cartogram looks at median household income in Detroit by Census Tract in 2013. Areas making less than $20,000 greatly outnumber those making $80,000 or more. Riverview, Midtown, Rosedale Park and Indian Village swell greatly due to their high median income, while areas like Palmer Park and Grandmont-Rosedale also increase in size at the expense of areas like Brightmoor, Briggs, Core City and Poletown.

By viewing a municipality’s size in relation to the median household income we are able to gain a better understanding of where higher household incomes are located in Southeastern Michigan. These maps show that much of the wealth in the region is located in the northeastern and northwestern portions of Wayne County and throughout Oakland County.