Pothole season is upon us, and so is an even more blatant reminder of the condition of Michigan’s roads. With the amount of moisture Michigan receives—from rain to sleet to snow– coupled with cold temperatures, that often rise to the level of thawing out what is frozen only to drop to below freezing points again, and again, it is no surprise that Michigan is a pothole haven. So, as the snow for winter begins to disappear for one of the last times of the winter, Michigan drivers are again hitting the roads—quite literally—harder than before.
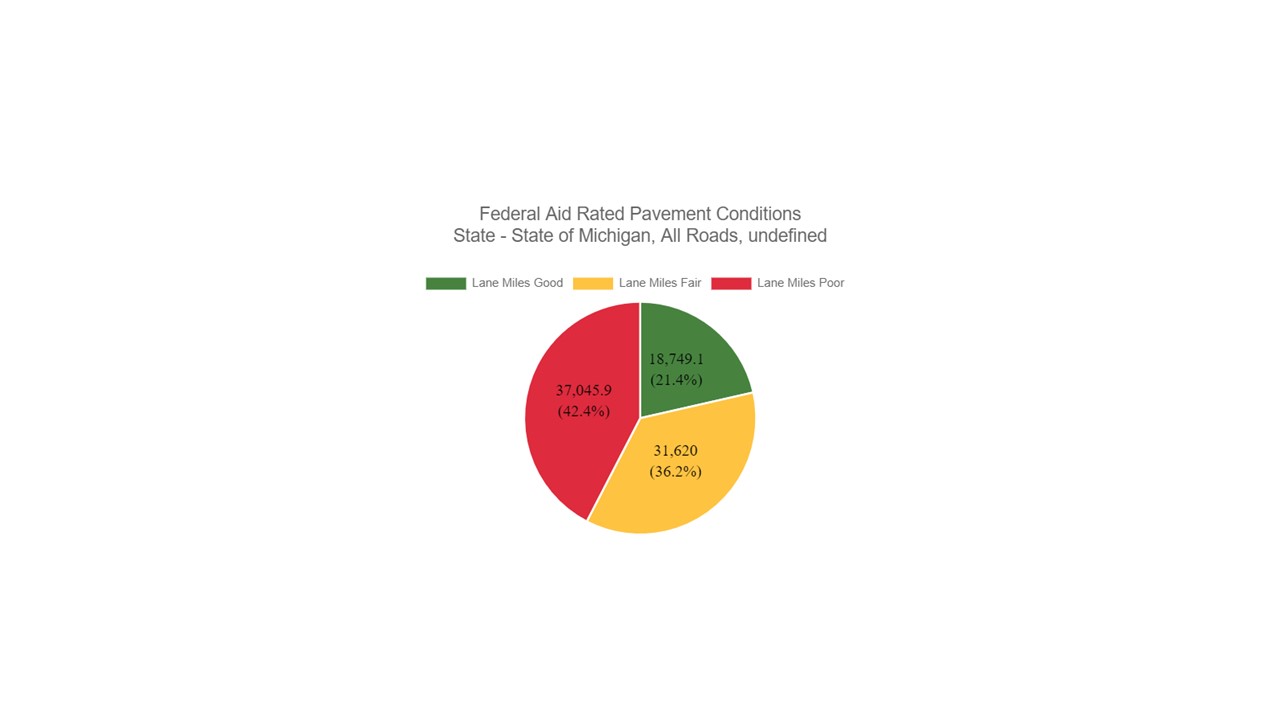
While data for 2020 and 2021 was unavailable from Michigan’s Transportation Asset Management Council at the county and city level, data for the State of Michigan in 2019-2020 shows that nearly half of Michigan’s roads were considered in poor condition. According to the data, 42.4 percent of the 87,415 miles in federal aid rated miles in Michigan were considered to be in poor condition, this was equivalent to 37,046 poor condition miles. Additionally, 36.2 percent of Michigan’s rated roads were considered to be in fair condition and 21.4 percent were considered to be in good condition. The percentage of roads considered to be in poor condition increased from the previous year (40 percent) while the percentage of roads in fair condition decreased. However, the percentage of roads considered to be in good condition remained the same 21.4.
Classification of road conditions defined by the Michigan Transportation Asset Management Council based on bin ranges of PASER scores and similarities in defects and treatment options. Good roads have PASER scores of 8, 9, or 10, have very few defects, and require minimal maintenance. Fair roads have PASER scores of 5, 6, or 7, have good structural support but a deteriorating surface, and can be maintained with CPM treatments. Poor roads have PASER scores of 1, 2, 3, or 4, exhibit evidence that the underlying structure is failing, such as alligator cracking and rutting. These roads must be rehabilitated with treatments like heavy overlay, crush and shape, or total reconstruction.
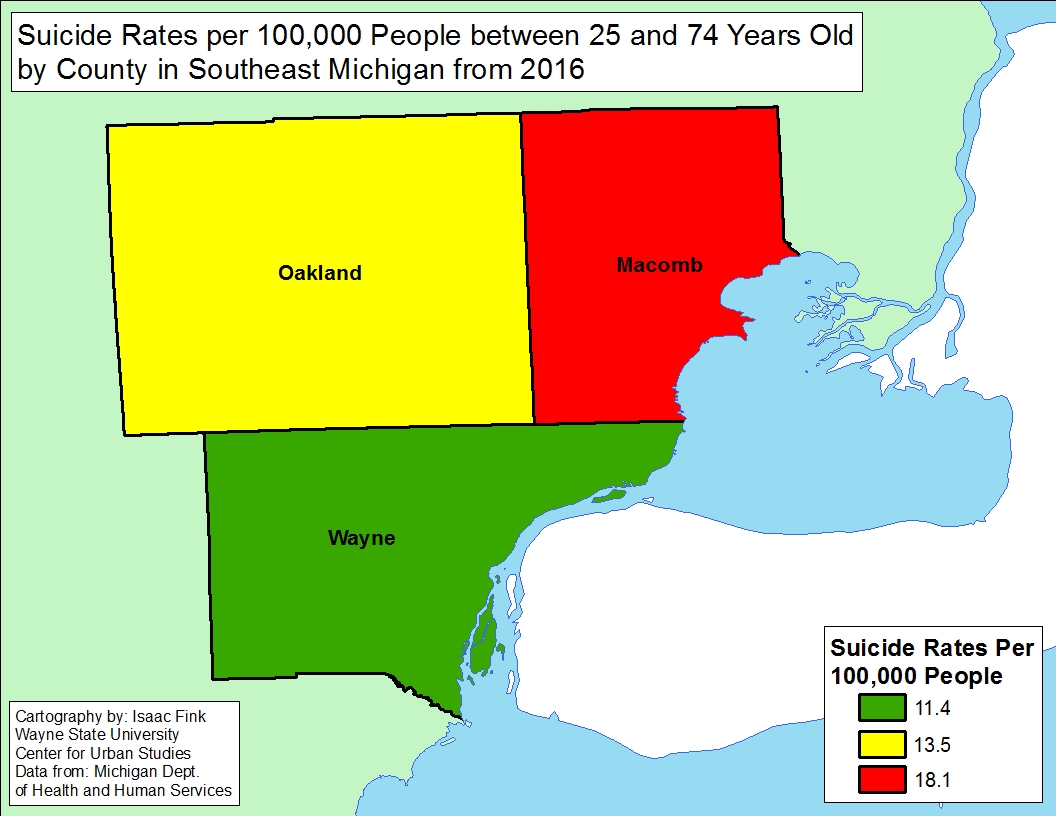
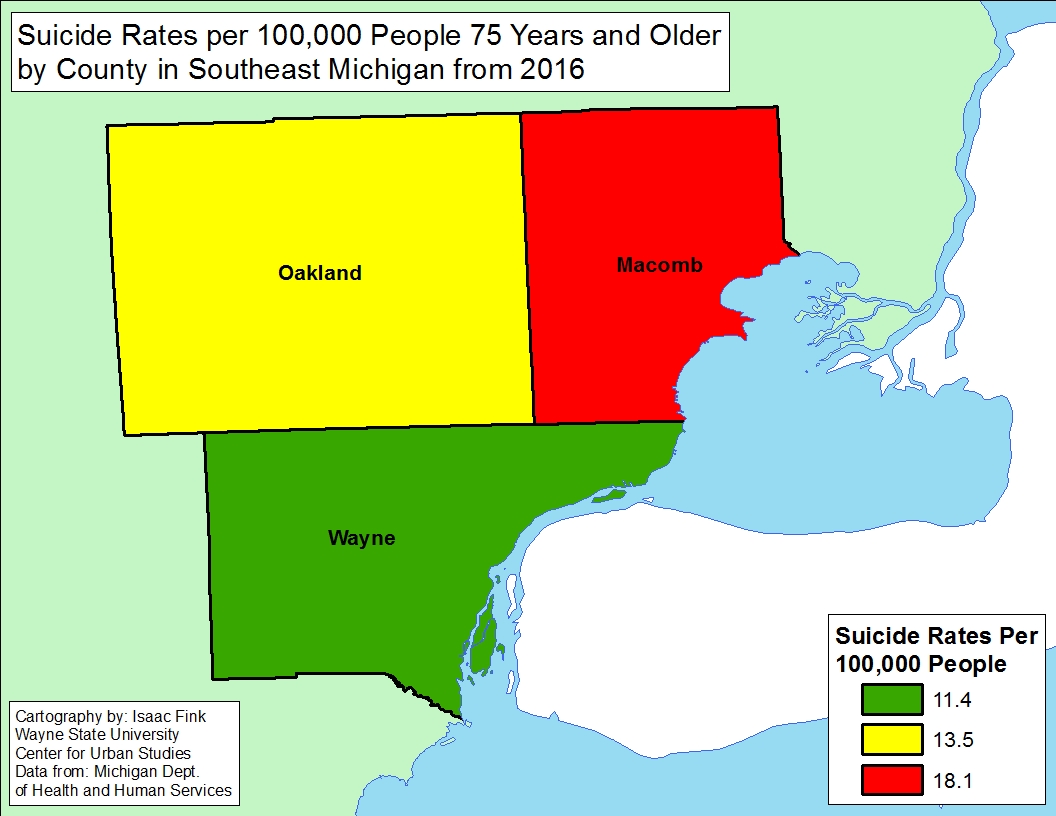
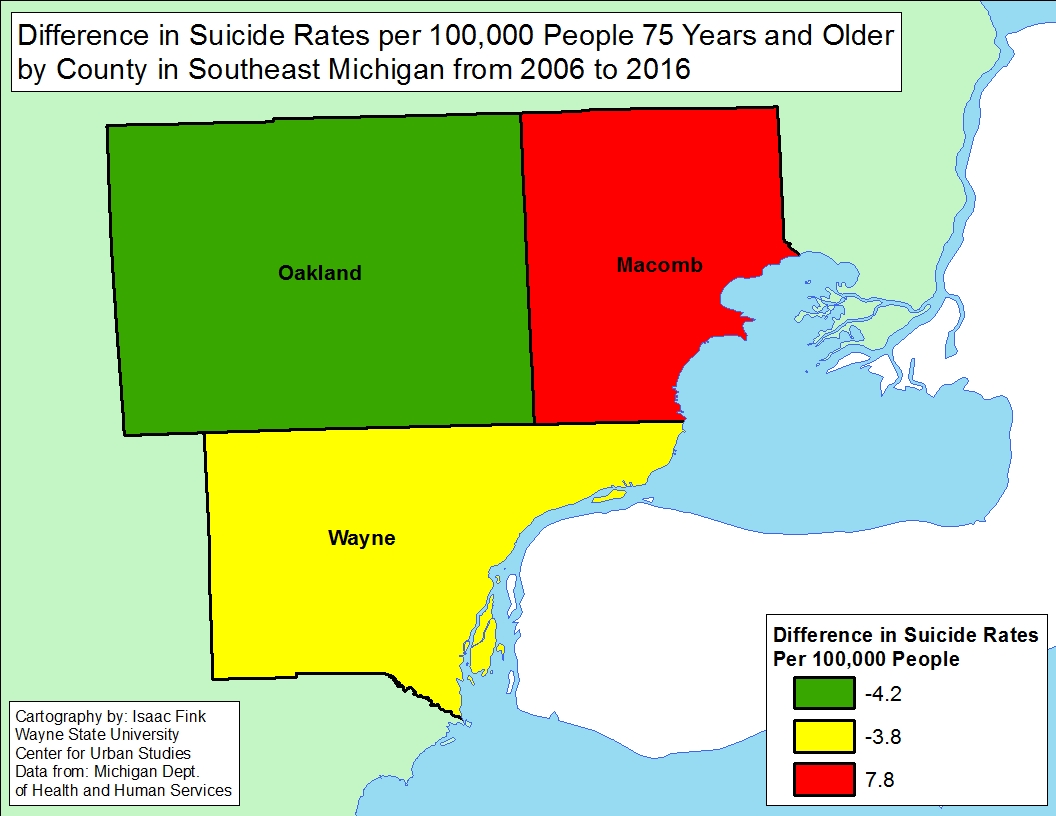
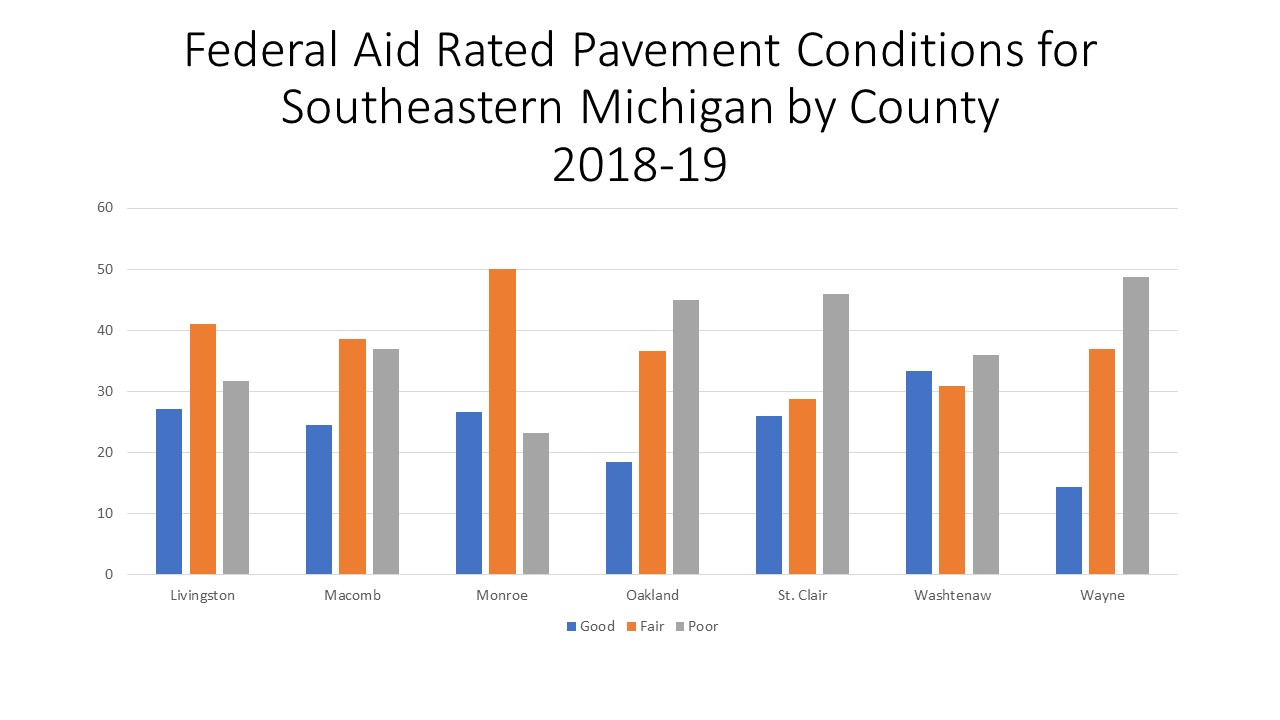
Just as we know almost majority of the roads in Michigan are in poor condition, this is similar for several counties in Southeastern Michigan. According to the most recent data (2018-19), four of the seven counties in Southeastern Michigan had a higher percentage of roads in poor condition than in fair or good condition. Wayne County had the highest percentage of roads in poor condition at 48.7 percent, followed by St. Clair County where 45.9 percent of the roads were in poor condition and then Oakland County where 44.9 percent of the roads were in poor condition. Washtenaw County was the only other county in the region where there was a higher percentage of roads in poor condition than in fair or good.
Livingston, Macomb and Monroe counties all had a higher percentage of roads in fair condition than in good or poor condition. Monroe County had the highest percentage of roads in fair condition at 50.1 percent, followed by Livingston County (41%) and Macomb County (38.6%). The percentage of roads in good condition was the lowest amongst the three categories for each county in the region. It was Washtenaw County though that had the highest percentage of roads in good condition at 33.3 percent; Wayne County had the lowest percentage of roads in good condition at 14.4 percent.
While weather certainly plays a role in the condition of Michigan’s roads, along with use and vehicle weight, funding the maintenance of Michigan’s roads is often the biggest decider in the State’s pavement conditions. Road funding in Michigan doesn’t come from one dedicated source. Rather, there is federal funding provided by the Federal Highway Administration Highway Trust Fund, state funding provided by state fuel taxes, vehicle registration fees, income taxes, additional appropriations decided on by the Legislature, and local funding provided by general tax revenue and additional road millages. All of these factors affect when and if a road is patched, paved or re-constructed, ultimately impacting the roadway’s condition and longevity.
While infrastructure bills, from the federal to the state to the local level continue to claim to push additional funding toward fixing the roads, forecasts from Michigan’s Transportation Asset Management Council show that by 2032 only 20 percent of Michigan’s roads may be in good condition, 34 percent may be in fair condition and 46 percenter may be in poor condition.
The time is now to begin evaluating, and re-evaluating how long-term infrastructure funding can be adjusted to better ensure Michigan’s roads end up in better condition than what they currently are in the future.