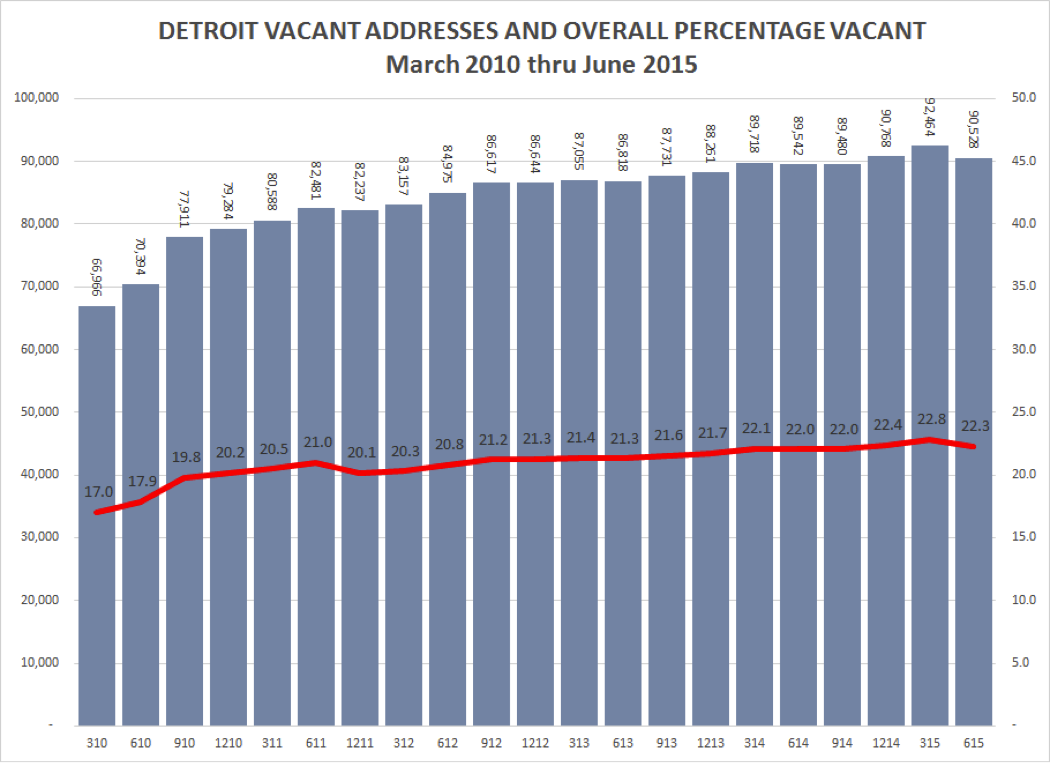
The most recent (June 2015) quarterly statistics from the U.S. Postal Service showed a decline in the number of vacant addresses in the city of Detroit. The total number of vacant addresses decreased by 1,936 from 92,464 to 90,528 for the period March 2015 to June 2015. The total number of residential addresses increased by 831 from 361,171 to 362,002. The total vacancy rate declined from from 22.8% percent to 22.3 percent.
However, the number of addresses classified as “no-stat” increased sharply by 1,563. Mail carriers denote properties as being either “vacant” or “no-stat.” Carriers on urban routes mark a property as vacant once no resident has collected mail for 90 days. Addresses are classified as “no-stat” for a variety of reasons. Addresses in rural areas that appear to be vacant for 90 days are labeled no-stat. So are addresses for properties that are still under construction, and urban addresses that the carrier decides are unlikely to be occupied again any time soon — meaning that both areas of high growth and severe decline may be labeled no-stat.
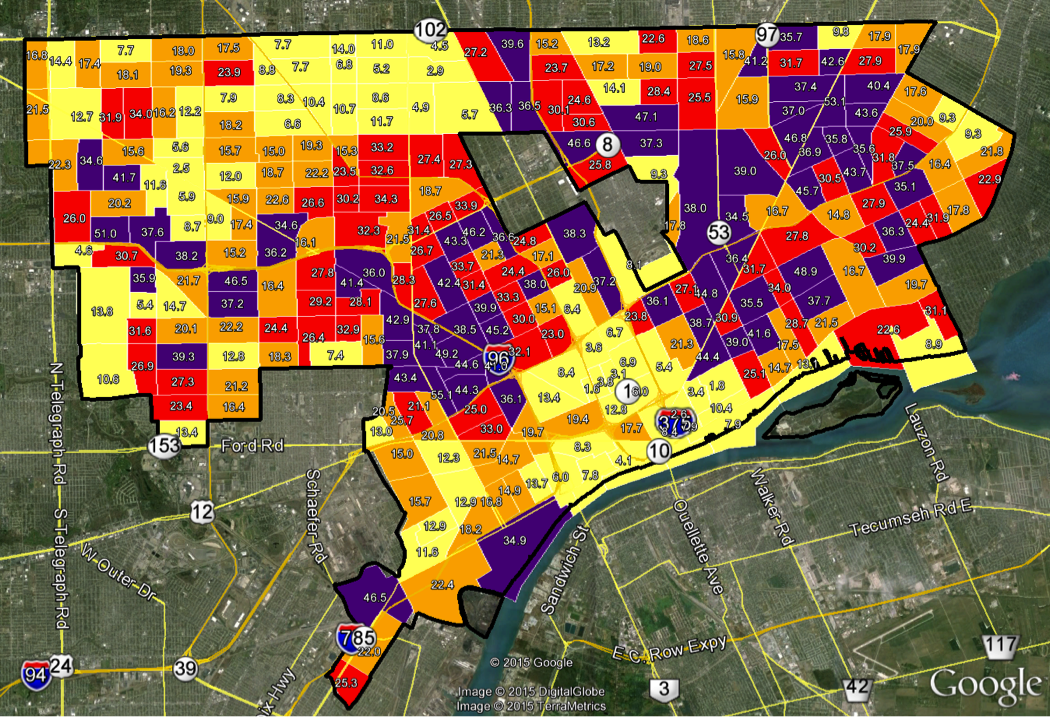
Source: United State Postal Service via HUD, March 2015.
June 2015 Address Vacancy Rates by Census Tract
(percentage of all addresses that are vacant)
Change in Address Vacancy Rates: June 2015 versus June 2014
(percentage point change)
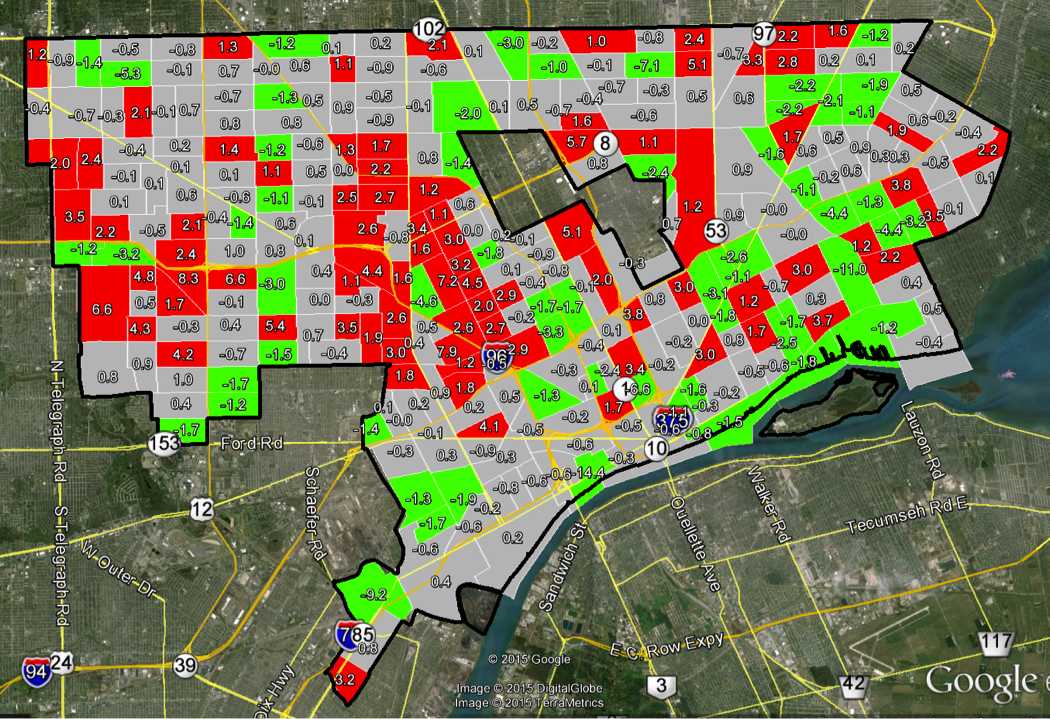
Red = Increase in address vacancy rate
Green = Decline in address vacancy rate (improvement)
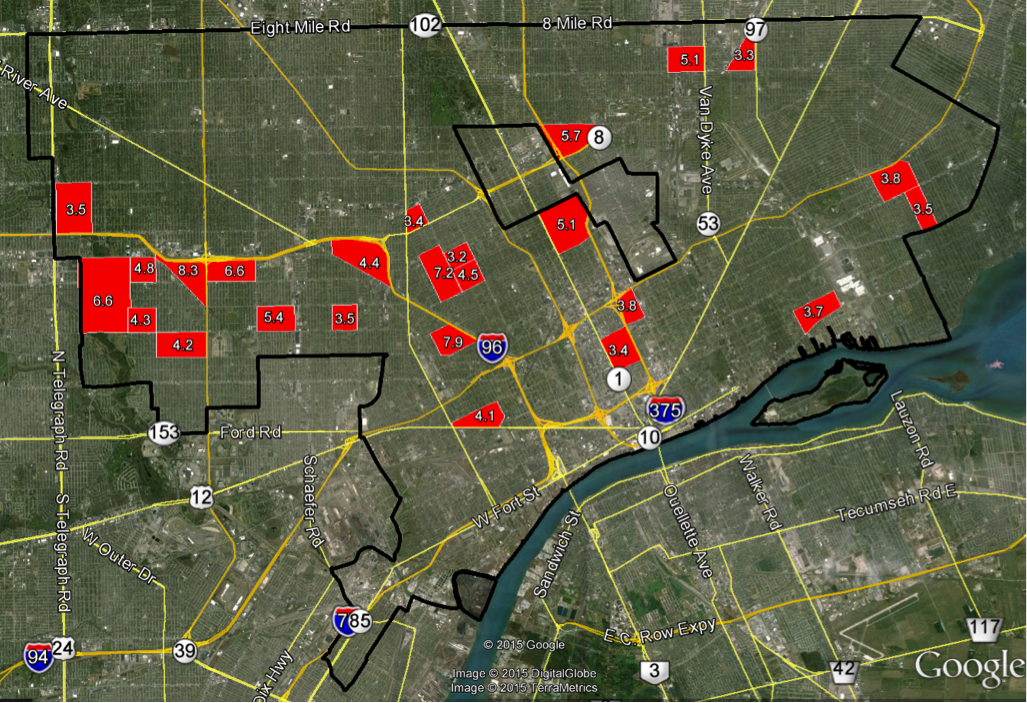
Top 25 Best Performing Neighborhoods for June 2015 versus June 2014
The map below illustrates the Detroit neighborhoods showing the largest percentage point reductions in their address vacancy rate. A reduction in the vacancy rate may result from an increase in occupancy or by way of demolition activity (which also reduces the number of vacant addresses). Concentrated demolition activity in the McNichols/Gratiot area has reduced the address vacancy rate but these areas still rank among the highest in the city at nearly 40 percent vacant.
For a map of demolitions, see the City’s Demolition Data Lens page at https://data.detroitmi.gov/view/vcn9-abmp

Top 25 Worst Performing Neighborhoods for June 2015 versus June 2014
The highlighted neighborhoods showed the largest increases in their vacancy rates between June 2014 and June 2015. Sixteen of the top 25 census tracts which showed increases in address vacancy are located on the west side of the city. Two eastside neighborhoods near Van Dyke and Outer Drive also showed sharp increases in address vacancy.