Rental Prices in Southeastern Michigan Continue to Rise

The rental market in Southeastern Michigan is mirroring that of the home-buying market. With low supply and rising prices, being further driven up by high demand, many are finding it difficult to secure a rental home, especially one they can afford, according to various news sources. 

According to Re/MAX of Southeastern Michigan, there are fewer rental units on the market than homes for sale. There were 2,480 single-family homes for rent from January through April, across 18 counties in central and southeastern Michigan, according to Realcomp. That number has decreased for two consecutive years, with 3,090 rental homes being available the same period in 2020, and 3,514 through the same period in 2019. 

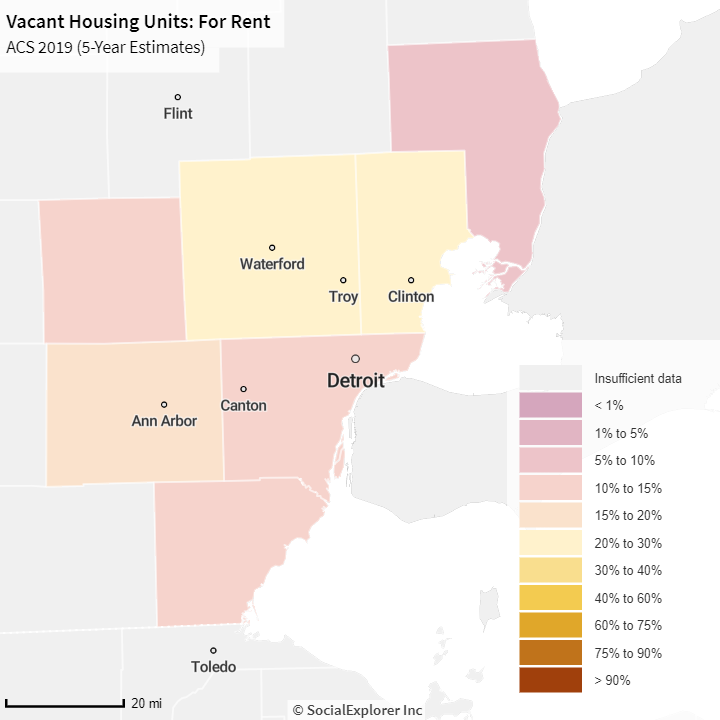
Below shows the percentage of vacant rental units available in 2019 by county in Southeastern Michigan, according to the American Community Survey. As shown, Oakland County had the highest percentage of vacant rental units at 23.8 percent, followed by Macomb County at 22.9 percent. St. Clair County had the lowest available rental stock at 7.3 percent. As mentioned above though, available rental stock across the region, and state, has decreased, increasing demand and making it more difficult and competitive for individuals to find rental units. According to Re/MAX, another factor driving low rental unit stock is that would-be homebuyers are remaining in rentals longer due to the low stock and high price of homes for sale.

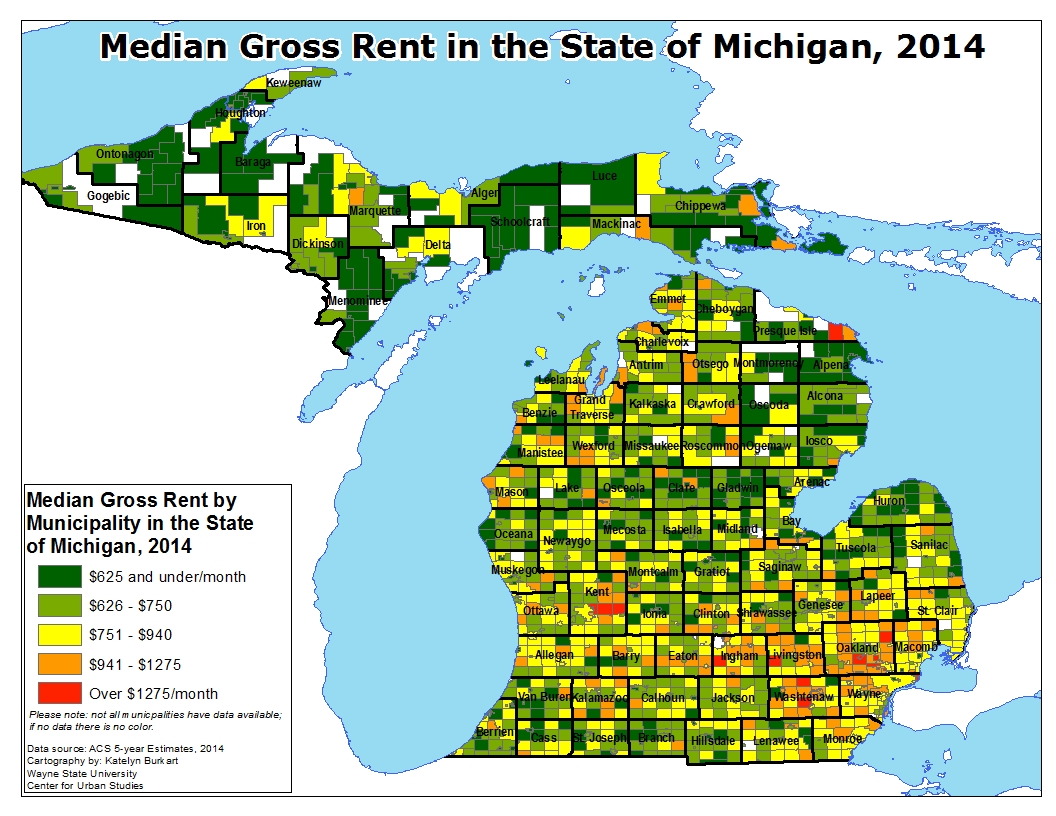
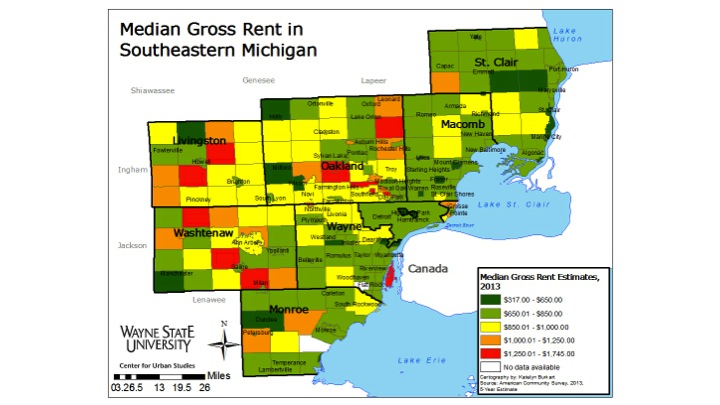
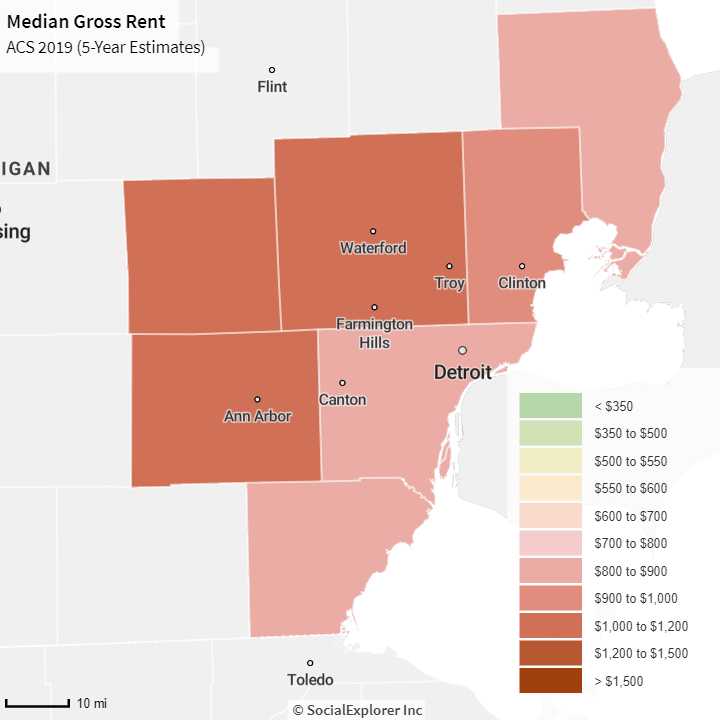
According to a recent Detroit News article, rental prices have increased upwards of 20 percent in the last year. According to the 2019 American Community Survey, Washtenaw County had the highest median gross rent at $1,114, followed by Oakland County with a gross median rent of $1,040 and Livingston County with a gross median rent of $1,053. These were the only area counties with gross median rents above $1,000 but with rental prices increasing upwards of 20 percent throughout the region, others, such as Macomb County (2019 median rent of $962) will be above that threshold. 

According to the Detroit News, which used ApartmentGuide.com as a source, the average rent for a one-bedroom apartment in Detroit rose from $1,332 to $1,516 between April 2020 and April 2021, and a two-bedroom apartment in Detroit rose from $1,764 to $2,319. In Farmington Hills, which is also in Wayne County, the average rent for a one-bedroom increased from $1,134 to $1,289 from April 2020 to April 2021, and a two-bedroom increased from $1,442 to $1,655. The City of Troy experienced the largest year-to-year change at 63.3 percent, according to the data, while Southfield experienced a 33 percent change and Rochester Hills experienced a 30 percent change. Ann Arbor, Grand Rapids, Lansing and Ypsilanti, all college towns, experienced decreases in average rental prices between 2020-2021, likely due to the decreased numbers of students needing housing because of the COVID-19 pandemic.

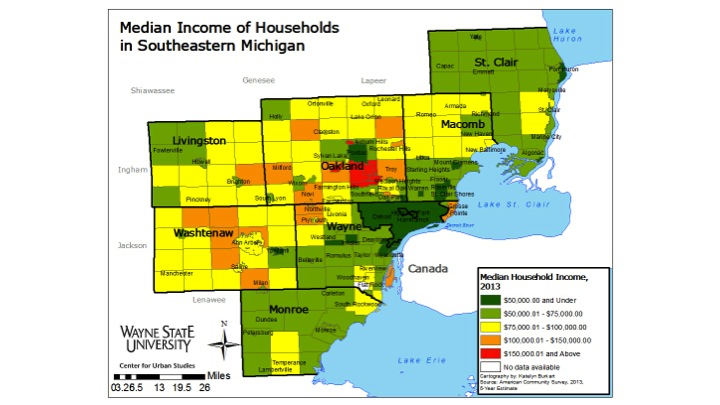
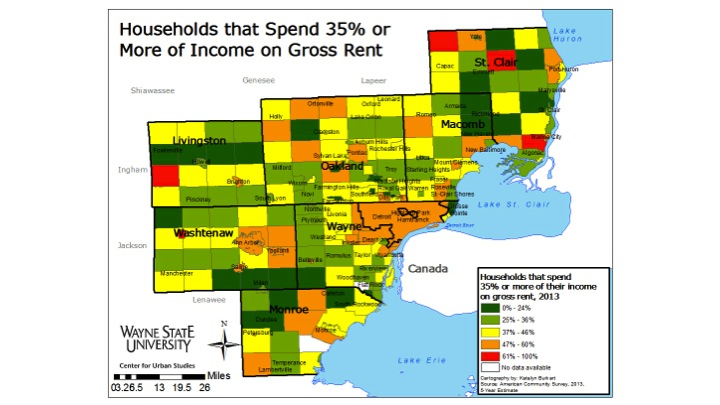
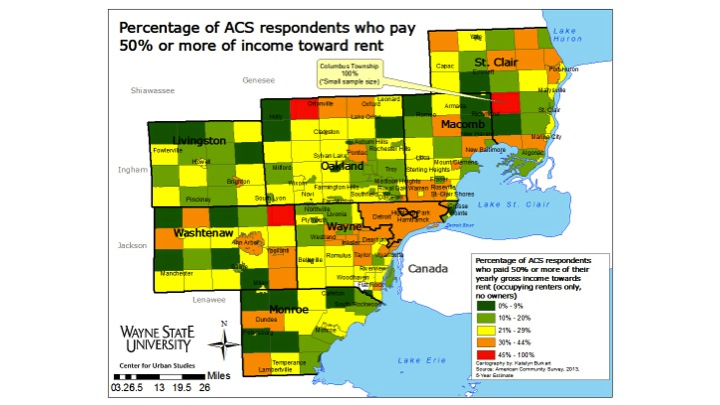
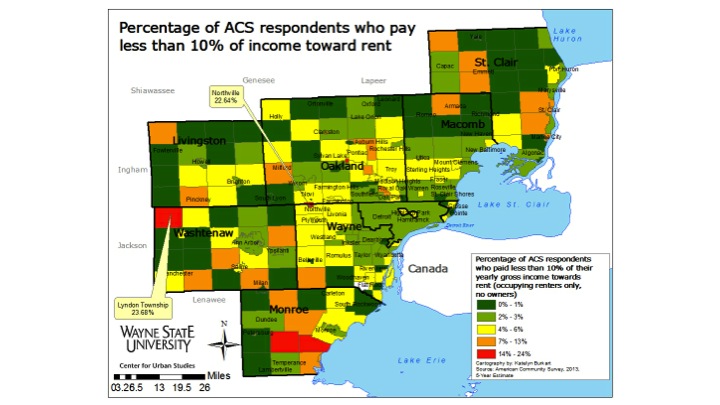
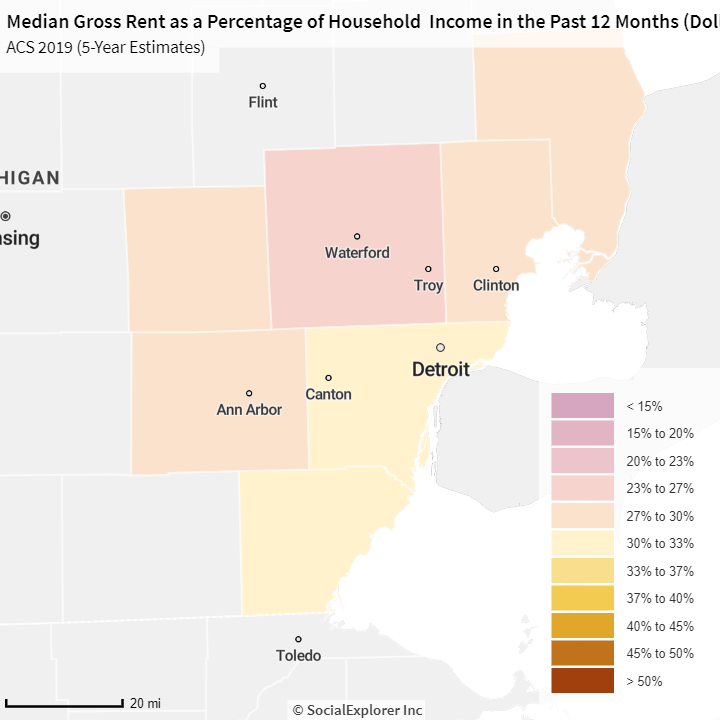
With increased rental unit pricing comes the concern of affordability. The average rule of thumb is that those who rent should spend about 30 percent of their income on their rental unit. In 2019, according to the American Community Survey, the average resident living in Wayne and Monroe counties was already living above that. According to the data, the average percentage of gross income spent on rent in Wayne County was 32 percent and in Monroe County it was 30.7 percent. Macomb, St. Clair and Washtenaw counties were all at the 30 percent threshold (29.3%, 29.7% and 29.8%, respectively). Oakland County had the lowest percentage of gross median income spent on rent at 26.8 percent.

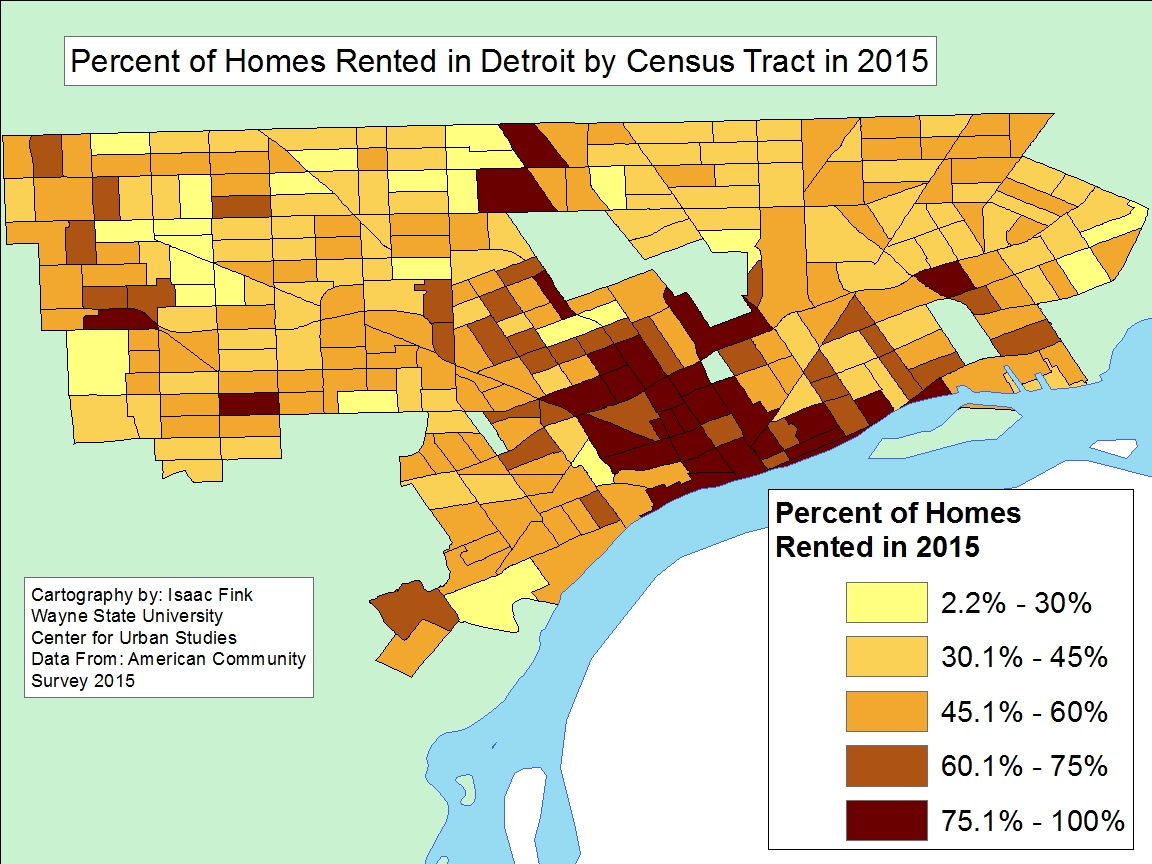
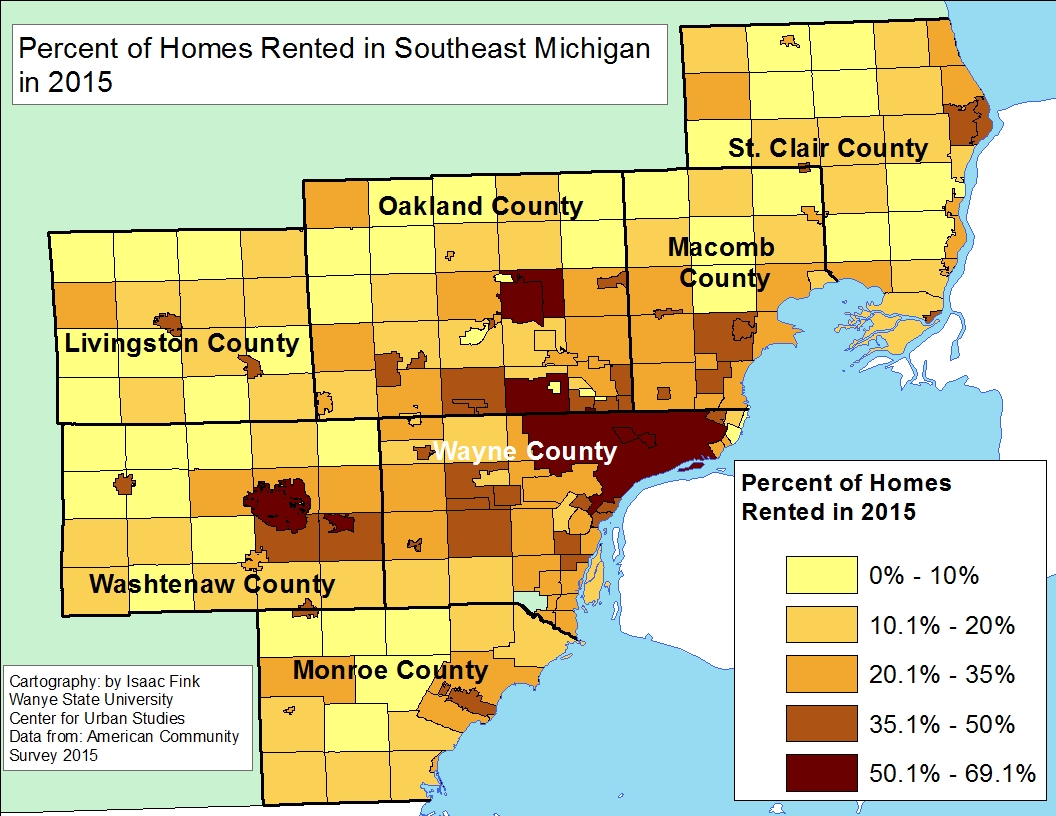
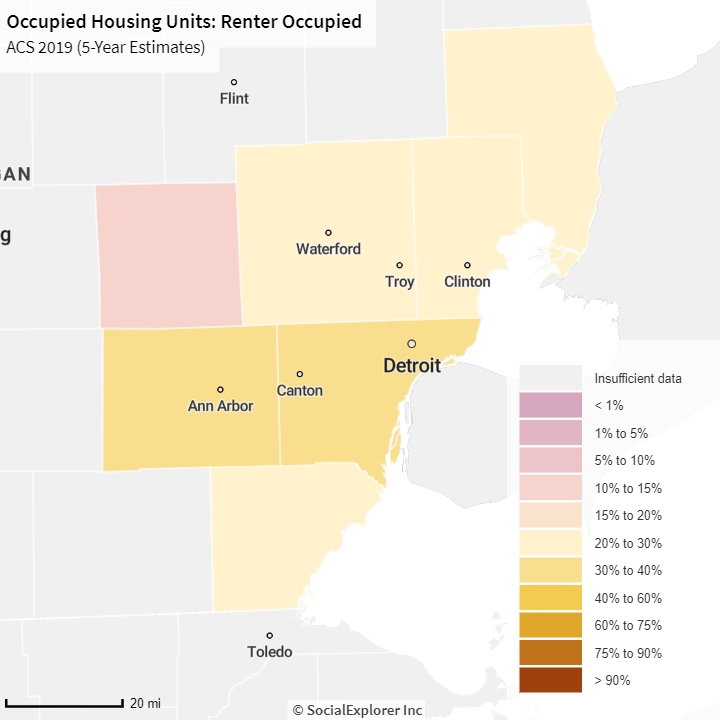
Increasing rental prices, driven by lack of supply, will affect thousands of people throughout the region. According to the 2019 American Community Survey, in Wayne County, 38 percent of occupied housing units in the county were occupied by renters. In Washtenaw County that percentage was 39, but it likely decreased in 2020 and 2021 due to the lack of students on college campuses because of the pandemic. Livingston County had the lowest percentage of occupied housing units occupied by renters at 15; all other counties in the region had percentages above 20.

The low rental stock and increase of rental prices is now drawing even greater concern as the Centers for Disease Control and Prevention’s moratorium on some evictions is set to end June 30. According to Michigan’s 2-1-1 service, which is a United Way service that connects individuals with various agencies to provide assistance, 21,318 inquiries were made between March 5, 2020 and June 9, 2021 about rental assistance. Furthermore, according to the Census Bureau’s Pulse Survey, about 250,000 Michigan residents said they were behind on rent or mortgage payments as of April 26, 2021.  In March of this year, Gov. Gretchen Whitmer approved allocating about $282 million in federal rental aid, $220 million of which is for emergency rental assistance. Michigan also received $660 million in rent aid from Congress in December of 2020, but how it can be allocated must be approved by the Michigan legislature. There may also be another round of funding of about $223 million to come to Michigan from the federal government, according to the Michigan State Housing Development Authority.

Higher Income Households Moving Into Select Neighborhoods in Detroit

The map below is one of the most striking we have produced recently in that it shows the clear concentration of higher income households moving into a relatively narrow range of neighborhoods near Downtown, east along Jefferson and north along Woodward.

It also shows that, with a few exceptions, many of the highest median income Census Tracts in the City of Detroit have amongst the newest homeowners. For example, majority of the Census Tracts along the Detroit River and bordering the Downtown and newer developed areas in the City have median incomes between about $69,000 and $132,000, and the average year of property purchase ranges between 2003 and 2012. The data used in this post is from the 2016 American Community Survey, thus these higher income tracts have an average length of residency between four and 13 years. In the map below, which highlights the average length of homeownership and median income, the earliest average year of homeownership for any one Census Tract is 1980.

Throughout the City’s most eastern and western Census Tracts the median incomes range between about $10,000 and $46,000, the lower two income brackets on the map, but the range of median move in date of homeowners is wide. For example, on the most western side of Detroit, average year of homeowner residency ranges between 1997 and 2012, with the average median income being between about $32,000 and $46,000. As you move further east, toward the central area of the City, the average length of homeownership increases and the average median income, those being in the lower half of the overall range, remains the same. There are of course some exceptions. For example, in the Palmer Park area the average median income ranges between about $70,000 and $132,000 in the Census Tracts and the average year in which a homeowner purchased a property ranges between 1991 and 1996. In Southwest Detroit, homeowners, on average, purchased their properties in 1991 or later, and the majority of the Census Tracts in that area have homeowners with median incomes ranging between $32,000 and $46,000. The Corktown Census Tract does have the same average length of homeownership, but the residents there tend to have higher incomes. Moving east beyond the central area of the Detroit we see similar patterns to the western area of the City. The longest average length of homeownership is located farther from the eastern border of the City, and the most eastern Census Tracts have some of the most recent average years of purchase.

The overall message of the homeownership map is that the Census Tracts with the highest median incomes tend to have some of the City’s newest homeowners, as do some of the City’s Census Tracts with the lowest average median incomes. This paints several pictures, the first being that neighborhoods near, north and east of Downtown are attracting those with median incomes more than two times higher than the overall median income for the City of Detroit ($26,000). Another picture could be that many people with low and moderate median incomes have also had some opportunities to purchase homes, however these homes are located on the outskirts of the City. Or citizens with relatively low incomes are buying homes that were foreclosed upon in the 2008 recession. Finally, the Census Tracts with lowest longest average length of homeownership also tend to have residents with among the lowest median incomes. This could be due to the fact that these homeowners are now retired and living off of Social Security, pensions or other forms of retirement based incomes. This is consistent with our prior posts on the distribution of households receiving government and pension payments.

The map that displays the median income and average length of residency at a property for renters is much different than the homeownership map. As would be expected, the average length of residency for a rental tenant in a particular property is much shorter than that of a homeowner. The earliest average year of renter tenancy for a Census Tract in the City is 2001. There are only three Census Tracts in the City where the average year a renter moved into a property is between 2001 and 2003; the median incomes for these Census Tracts tops out at about $32,000. Overall, the top median income for the renter map tops out at $52,000, furthering the conversation that renters tend to have lower incomes. The west side of the City had the highest concentration of newest tenants (average length of renter tenancy ranging between 2012 and 2014) with majority of the median incomes ranging between $9,000 and $23,000.

The renter map shows that, overall, those who rent tend to have lower median incomes than those who purchase homes and also do not have a tendency to remain in one location for long periods of time.

Overall, this post highlights how those with median incomes more than double the City’s median income are purchasing properties in developing areas of Detroit. However, those with among the lowest median incomes in the City either rent and move around every few years or have owned and remained in their home for well over 30 years.


Highland Park Home to Highest Number of Rental Units in the Region

In 2015 there were nine cities in Southeastern Michigan where more than 50 percent of the housing units were renter occupied. Ypsilanti had the highest percentage of renters at 69 percent, followed by Royal Oak Township at 67 percent. Ann Arbor, Auburn Hills and Detroit, all homes to universities, also had more than 50 percent of its housing units renter occupied. In Detroit, 51 percent of the occupied housing units were renters. Areas with the highest percentage of renters in Detroit were located along the river and in the lower Woodward Corridor. In these areas more than 75 percent of the housing units were occupied by renters. Conversely, areas such as Palmer Park and Rosedale Park had among the lowest percentage of renters, ranging between 2 and 30 percent. There were only 20 Census tracts in Detroit where 30 percent or less of homes were occupied by renters. As seen below, majority of the Census tracts throughout Detroit had between 30 and 60 percent of the occupied housing units occupied by renters.

Percent of Homes Rented_Detroit_Census Tract_JPEG

Percent of Homes Rented_SEMCOG_MDC_JPEG

At the county level, Livingston County had the lowest percentage of renters at 15 percent while Wayne County had the highest percentage at 37 percent. In Livingston County, Cohoctah Township had the lowest percentage of renters at 3 percent and Howell had the highest percentage at 48. In Wayne County, it wasn’t Detroit with the highest rental rate, but rather Highland Park at 64 percent. Grosse Pointe Farms had the lowest rental rate in Wayne County at 2.6 percent.

Regionally, the average percentage of homes rented was 22 percent in 2015; of the 210 communities in the region 112 of them had less than 22 percent of the housing units occupied by renters. Of those 112 communities, 47 of them had rental rates below 10 percent. Novi Township, located in Wayne County, had the lowest percentage of renters at 2 percent, followed by Orchard Lake (2.3%) and Grosse Pointe Farms (2.6%).

While there were less than 10 cities in the region with rental rates above 50 percent, we will highlight next week that there has been a trend toward renting in recent years, particularly in certain areas. In a recent Detroit Free Press article higher rental rates was attributed to the increased number of foreclosures that occurred during the mortgage crisis. A 2015 New York Times article discusses how homeownership rates had been falling for eight years straight at that time, largely due to the burst of the housing bubble.

Rent Costs Increase throughout Michigan between 2000-2014

In 2014 there were 122 different communities in the state of Michigan with gross median rental costs above $1,000; Bloomfield Hills topped this list with a gross median rent price of $2,001. Despite this community being at the top of the median gross rental cost list for the state it experienced a 5 percent median rental price decrease between 2000 and 2014. On the opposite end of the spectrum, in 2014 there were 72 different Michigan communities with median gross rental prices under $500 a month; Rose City in Ogemaw County had the lowest gross median rental cost at $294 per month. Like Bloomfield Hills, Rose City also experienced a decrease in its median gross rental cost between 2000 and 2014. However, for Rose City that decrease was much greater; there was a 50 percent median gross rental cost decrease between 2000 and 2014.

On a national basis, in 2014 the gross median rental cost was $920 and 41 percent of rental units throughout the U.S. had a gross median rental price above $1,000; 12.1 percent of the rental units in the U.S. had gross median rental costs below $500.

For this post, data from the year 2000 is from the decennial census while the 2014 data is from the 5 year American Community Survey. Additionally, when comparing gross median rent data between 2000 and 2014 (as seen in the second map) the 2000 rent prices were adjusted to reflect 2014 dollars so a more accurate reflection of the changes could be presented.

Gross rent is defined as the monthly amount of rent plus the estimated amount of utilities and fuel.

MedGrossRent2014

The map above shows the range of median gross rental costs throughout the state of Michigan in 2014. Looking at the highest bound of rents–$1,275 and there were 20 communities throughout the state, 13 of which were located in Southeastern Michigan and seven of which were located in Oakland County. Of those in the region, two were located in Wayne County-Grosse Pointe Shores and Grosse Pointe Farms. As noted, there were over 100 communities with gross rental prices above $1,000 in Michigan in 2014.

Regionally, there were also five communities on the lower end of the spectrum, with gross median rental costs below $625. The city of Highland Park was the only one located in Wayne County, with a gross median rent of $624. The city of Center Line had the lowest gross median rental cost in the region at $492.

The city of Detroit had a gross median rental cost of $756 in 2014. This was in the 42 percentile of gross median rental prices throughout the state. Detroit’s gross median rental cost was higher than more than 50 percent of the other communities in the state.

ChangeRent00to14

In total, there were 80 Michigan communities with gross median rental price increases above 50 percent between 2000 and 2014 (These are the communities for which there was full data for comparison). Of those 80 communities, four were located in the Southeastern Michigan region, two of which were located in Oakland County. Of those communities, Orchard Lake Township had the highest percentage change in gross median rent at 117 percent. In 2014 the gross median rent in the township was $1,909 and in 2000 (in adjusted 2014 numbers) the gross median rent was $879 ($635 in 2000 dollars).

Cross Village Township in Emmett County had the largest overall gross median rental cost increase between 2000 and 2014 (in 2014 dollars) at 132 percent. In 2014 the gross median rental price in the township was $915 while in 2000 the price (in 2014 dollars) was $415 (equivalent to $300 in non-adjusted 2000 dollars). It should be noted though that this Lake Michigan town had a population of 294 in 2014, meaning that a small number of large increases in rent could produce the large reported change in the median.

Of the 27 communities in Michigan with a decrease in gross median rental costs between 2000 and 2014 for which full data was available for comparison, only two were located in Southeastern Michigan. These communities-Rose and Sylvan Lake townships in Oakland County and Deerfield Township in Livingston County-experienced rental rate decreases at 1.5 percent, 2.7 percent and 25 percent, respectively.

Between 2000 and 2014 the city of Detroit’s gross median rental cost increased by 12 percent. Detroit’s gross median rental cost increase was higher than about 70 percent of the other Michigan communities between 2000 and 2014 (when comparing in 2014 dollars). While not depicted in either of the maps, it was reported on July 23 2016 by the Detroit News that the housing market in Downtown Detroit continues to soar, with average rents increasing more that 11 percent since 2011 in that area of the city. According to the article, the average monthly rent for a one bedroom apartment in Downtown Detroit is $1,359.

Overall, about 65 percent of the state’s cities or townships had gross median rental cost increases between 2000 and 2014, when dollars were adjusted for comparison. Various reasons may explain the overall increase in gross median rental costs (in comparable dollars) throughout the state, the most likely of which is greater demand. The 2008-2009 recession produced a large uptick in foreclosures, nationally and throughout the state. With this, many people were left looking for affordable rental units. With an increase in demand comes an increase in price. In a future post we will discuss the overall change in rental rates throughout Southeastern Michigan between 2000, 2010 and 2014, but according to the U.S. Census Bureau we do know that on a national basis the recession produced a greater demand in rental units. Since gross median rent also includes the estimated cost of utilities and fuel, increases in energy costs overtime are also likely contributors to the overall increase.

High rental burden evident through Southeastern Michigan

In Southeastern Michigan, there were 11 communities with a median rental cost above $1,200 per unit, yet none of these municipalities had more than 46 percent of their tenants paying more than 35 percent of their income on gross rent. Regionally, the median household income ranges between about $75,000 and $100,000 at the municipal level. According to the U.S. Department of Housing and Urban Development, no more than a third of a household’s income should go toward rent. To highlight how a community’s median income compares to the percentage of rent of that income a household pays we have made three different maps:

  • Households that spend 35 percent or more of income on rent
  • Households that spend 50 percent or more of income on rent
  • Households that spend 10 percent or less of income on rent


First though, two basic maps showing median gross rent at the municipal level and median income at the municipal level are below. Gross rent is defined by the U.S. Census Bureau as the “amount of the contract rent plus the estimated average monthly cost of utilities (electricity, gas, and water and sewer) and fuels (oil, coal, kerosene, wood, etc.) if these are paid for by the renter.”

Overall, Lodi Township in Washtenaw County had the highest median gross rent in Southeastern Michigan at $1,571. Two other Washtenaw County townships, Dexter and York, also had median rental costs above $1,200. At the county level, though, it was Livingston County with the highest median rental costs at $917. Howell and Genoa townships in Livingston County had median rental costs of $1,202. Only one community in Wayne County, Grosse Ile Township, had a median rental cost above $1,200 ($1,201). Wayne County had the lowest overall median rental cost at $777.

When looking at the median-income map we see the same communities, with the exception of those in Livingston County, with the highest median rental costs also have some of the highest median incomes. For example, the median income in Lodi Township is about $107,000 a month. A third of that would be about $36,000 a year spent in rent, or close to $3,000 a month. While Lodi Township did have the highest median rental cost in the region at $1,571, that is nearly half of what that one-third threshold would be. In the city of Detroit though, the median household income is $26,325 annually, or about $2,200 a month. With a median gross rent cost of $761, that is almost exactly a third of the average renters’ income. The difference between the highest median income and lowest median income in the region is 100 percent while the difference between the highest median gross rent and lowest median gross rent is 138 percent. This shows us that average rent prices are not in proportion to average incomes.

Slide03

Slide04

In Southeastern Michigan there are 22 communities, or about 10 percent of the region, in which 24 percent or fewer of renters pay less than 35 percent of their income to gross rent. We see that majority of the region’s renters set aside between 25 percent and 46 percent of their income for gross rent costs. There were only five communities in the region where 61 percent or more of the renters spent 35 percent or more of their income on rent. When increasing that threshold to 50 percent, there were only three (Groveland Township, Salem Township and Columbus Township) communities in the region where 45 percent or more of renters spent more than half of their income on rent. When an individual or a family spends for than 30 percent of their gross income on rent this is called rent burden and according to the National Center for Children in Poverty about 80 percent of low income households with children experience it.

Excluding Columbus Township because of the small sample size, the median income for both Groveland and Salem townships range between $75,000 and $100,000 while the median rent ranges between $650 and $1,000.

Slide06

Slide07

Only four communities in Southeastern Michigan had 14 percent of more of renters paying less than 10 percent of their income toward rent in 2013, according to the American Community Survey. Lyndon Township in Livingston County had the highest percentage at 23 percent and Northville, which is on the border of Wayne and Oakland counties, had 22.64 percent. The other two communities were located in Monroe Township.

Slide09


According to the National Center for Children in Poverty urban areas typically experience higher rates of rental burden. However, in Southeastern Michigan we see that there were also several rural communities, such as Groveland Township, where tenants also experienced rental burden.