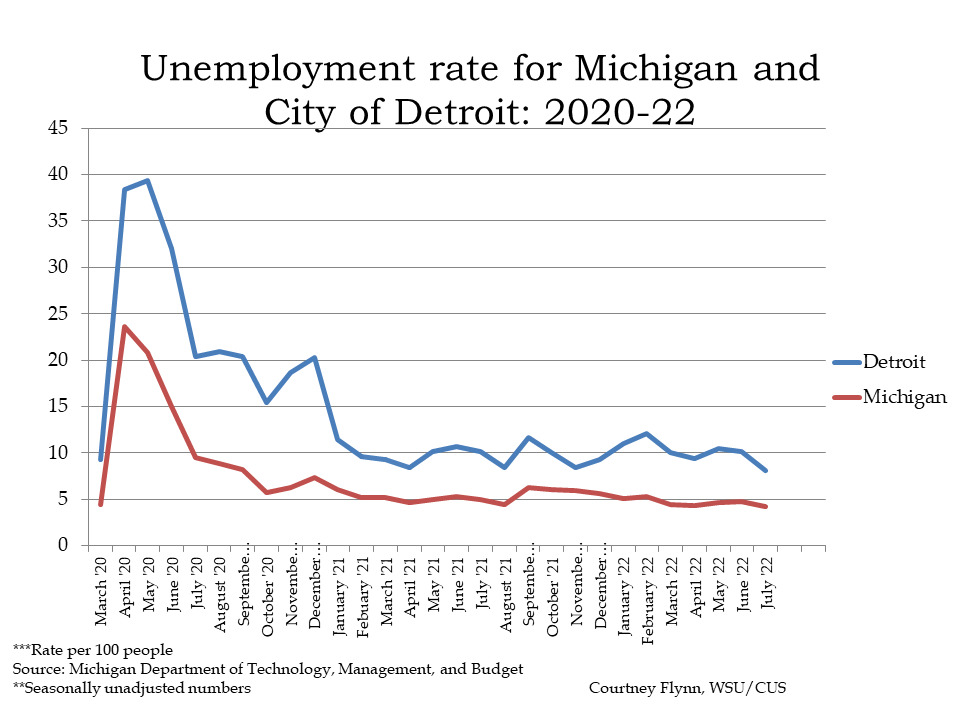
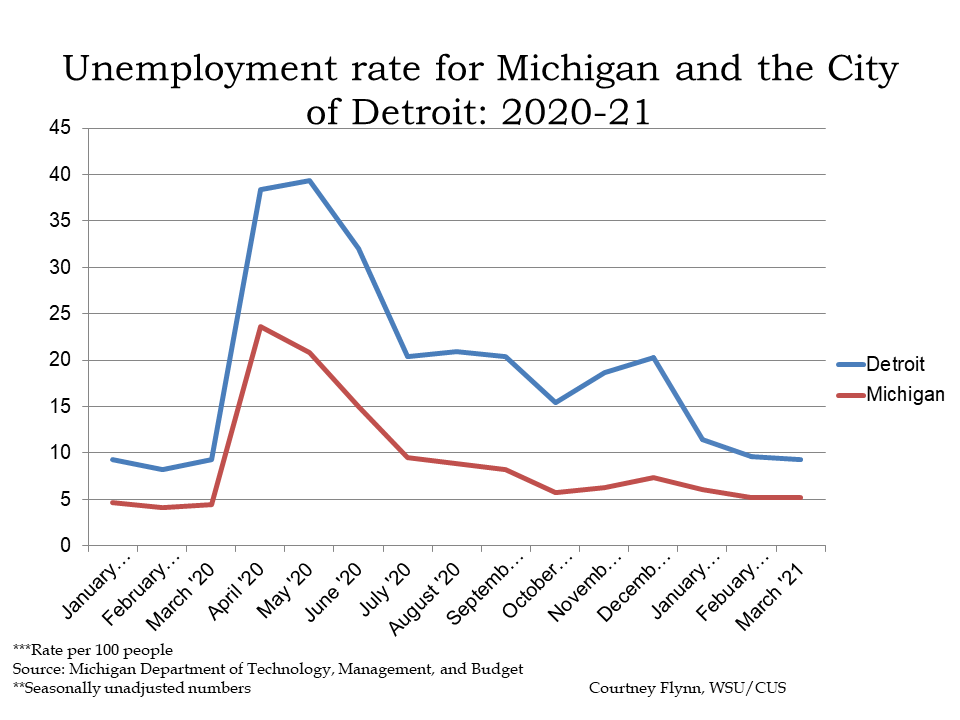
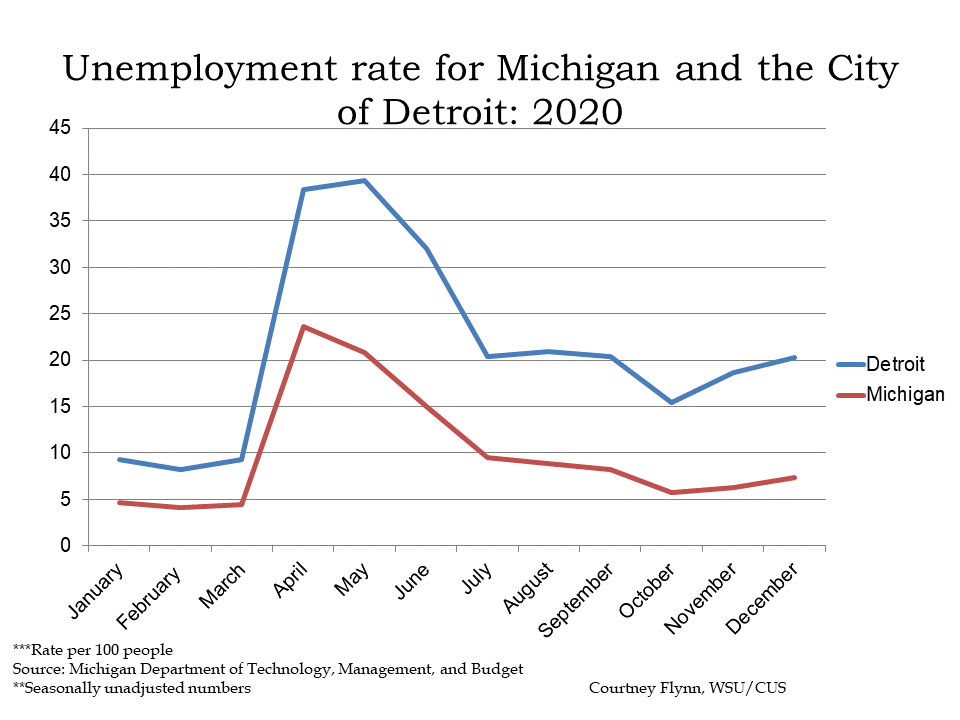
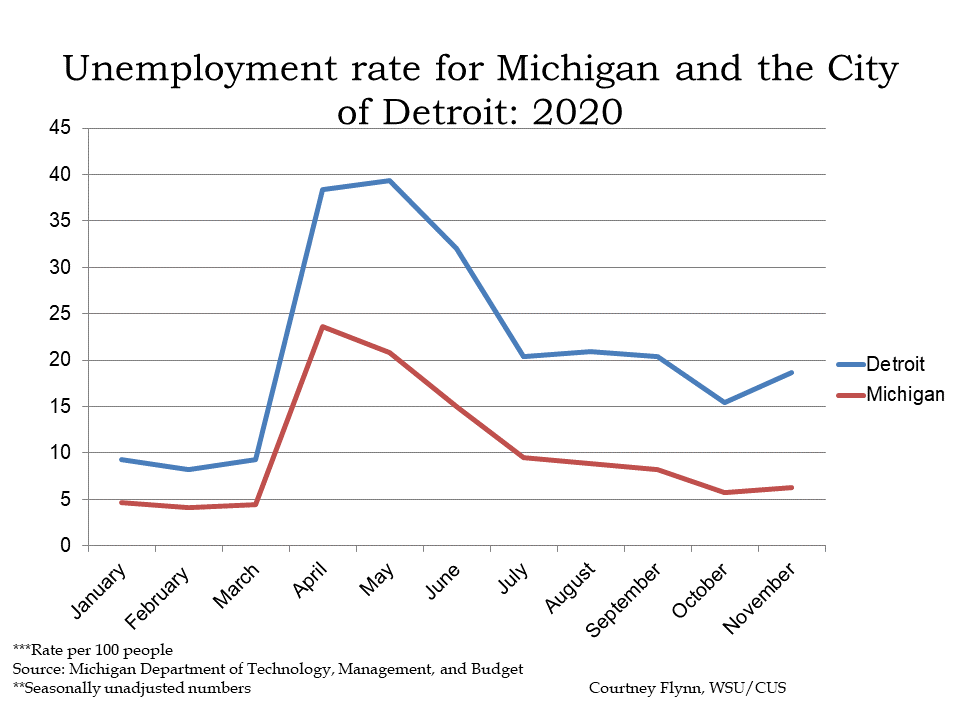
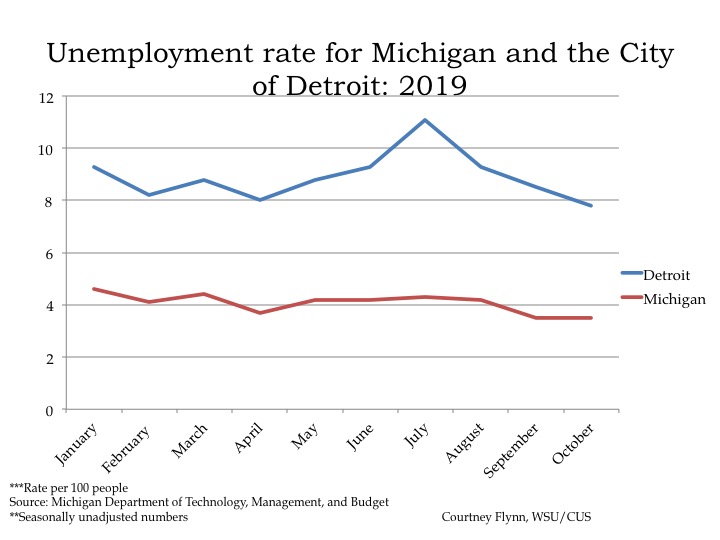
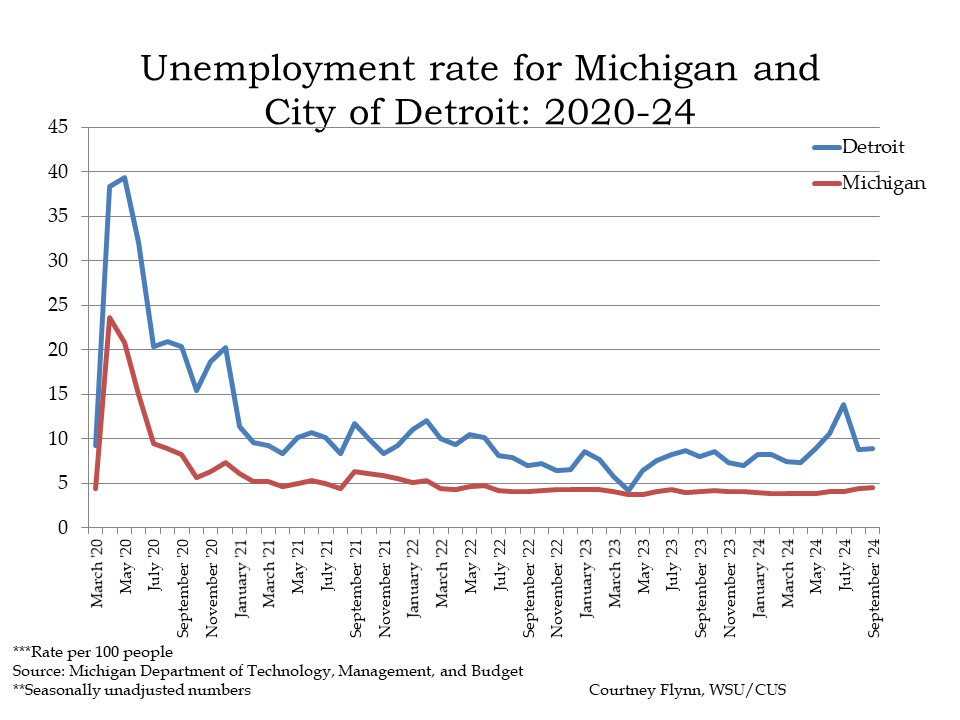
Michigan’s unemployment rate has been slowly increasing over the last few months, a trend which the City of Detroit is also experiencing but at a more increased rate. According to Michigan Department of Technology, Management and Budget, Michigan’s unemployment rate was reported at 4.5 percent in September of 2024. This unemployment rate has gradually increased for 3.9 percent since May of 2024.
In Detroit, the September 2024 unemployment rate was reported at 8.9 percent. This was a decrease from the 13.9 percent unemployment rate spike in July of 2024, however, in April of 2024 the unemployment rate for Detroit was 7.4 percent and it has continued to increase since then.
According to a recent Detroit Free Press article, there are several reasons for the increased jobless rates, including inflation, lack of interested people to fill open positions and the fact that some major Michigan employers have been cutting back on positions. For example, last week General Motors announced about 1,000 layoffs and since August Stellantis has cut about 2,850 positions. There are fields that are growing though. The construction industry in Michigan has experienced about an 8 percent increase in jobs and there has been about a 3 percent increase in government jobs.
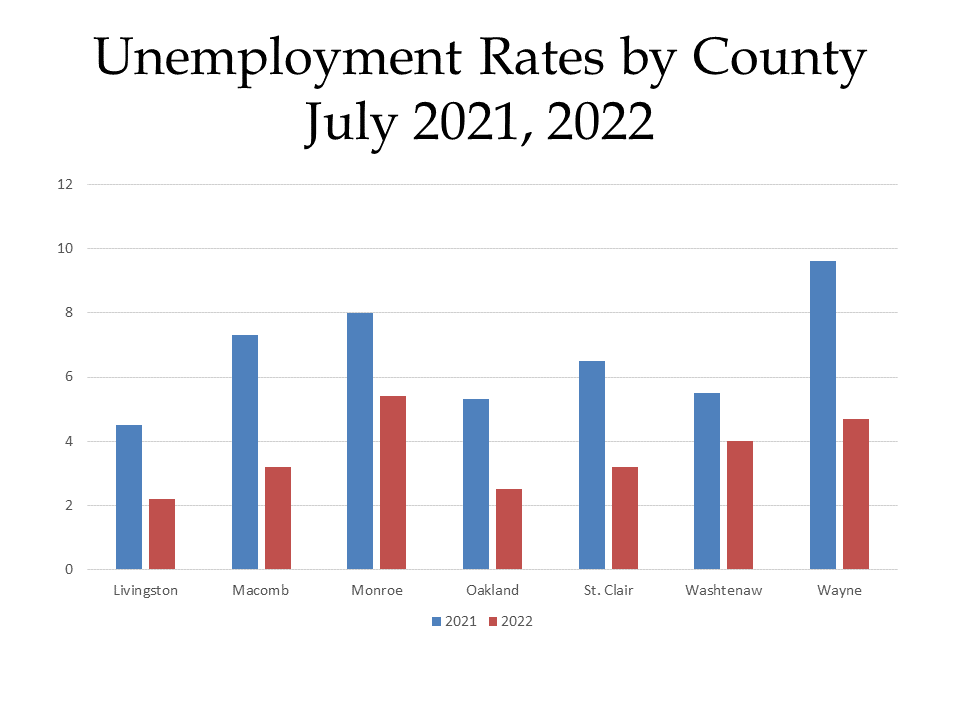
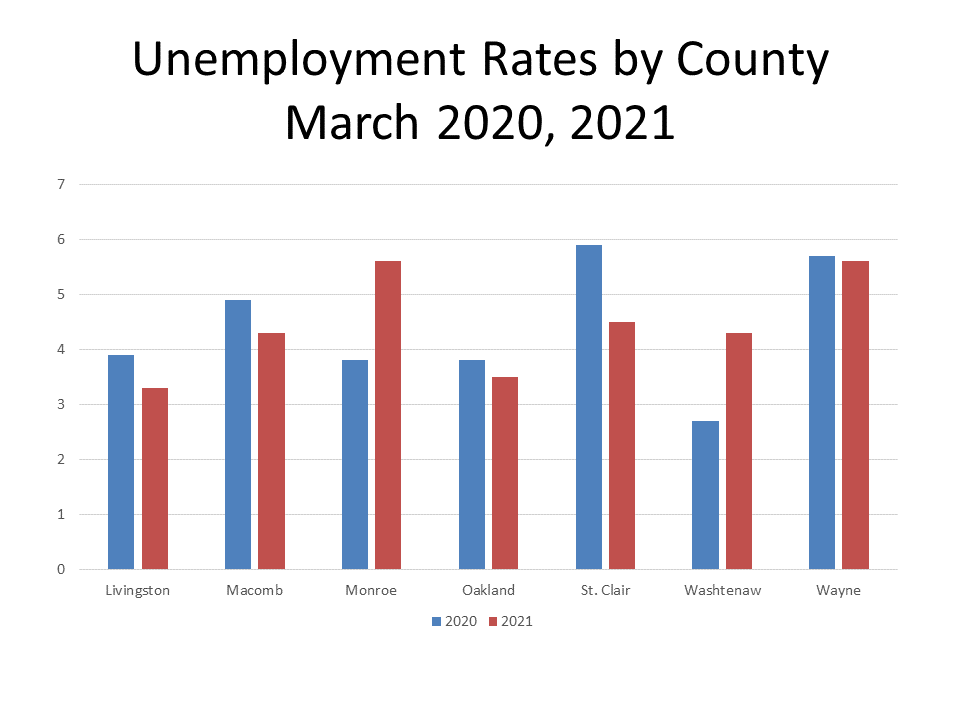
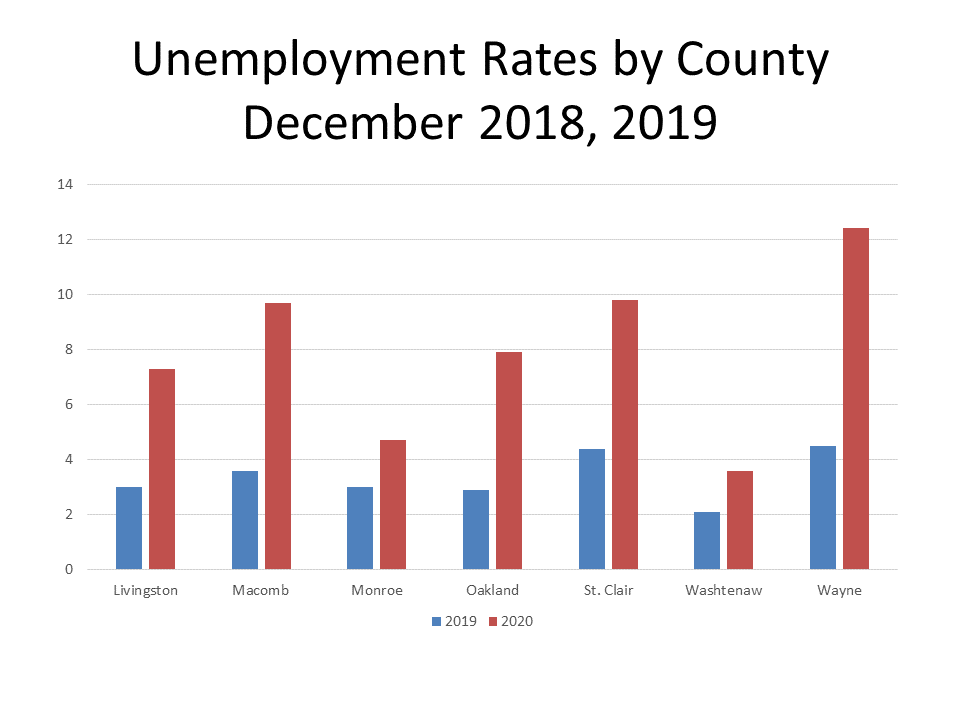
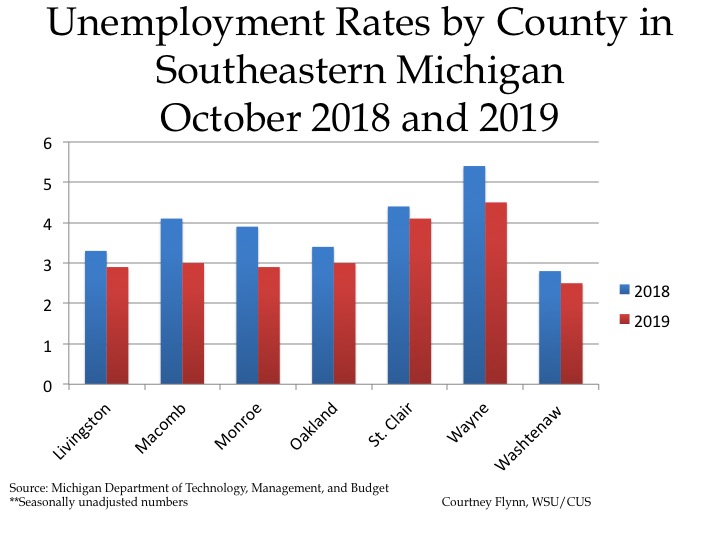
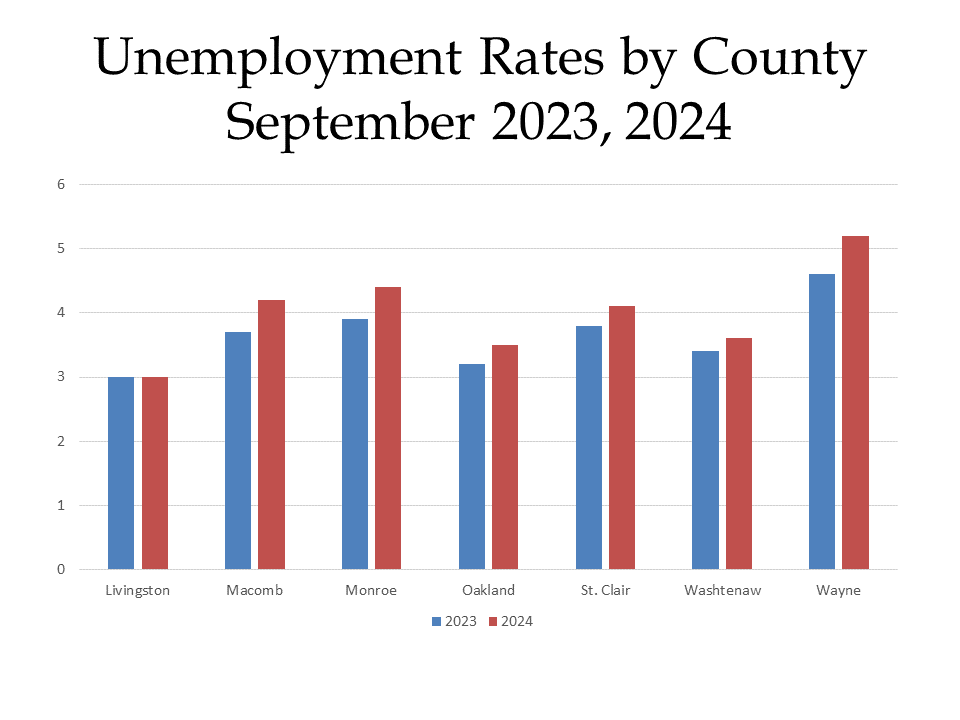
When comparing the unemployment rates of the seven counties in Southeastern Michigan between September of 2023 and September of 2024 the data shows that unemployment rates have increased for almost all counties over the last year. Livingston County was the only county where the unemployment rate remain unchanged; the reported unemployment rate was 3 percent. Wayne County not only had the highest unemployment rate in September of 2024 at 5.6 percent but it also had the largest increased from the year prior. Between September of 2023 and September of 2024 Wayne County’s unemployment rate increased 1.6 percent.
When comparing the unemployment rates of the seven counties in Southeastern Michigan between September of 2023 and September of 2024 the data shows that unemployment rates have increased for almost all counties over the last year. Livingston County was the only county where the unemployment rate remain unchanged; the reported unemployment rate was 3 percent. Wayne County not only had the highest unemployment rate in September of 2024 at 5.6 percent but it also had the largest increased from the year prior. Between September of 2023 and September of 2024 Wayne County’s unemployment rate increased 1.6 percent.
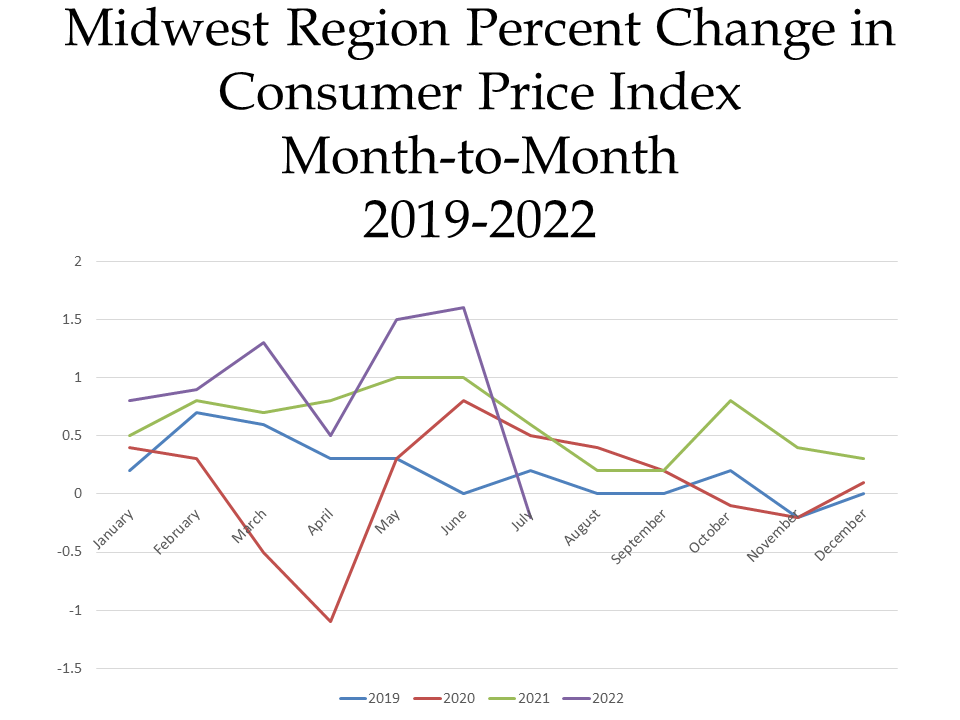
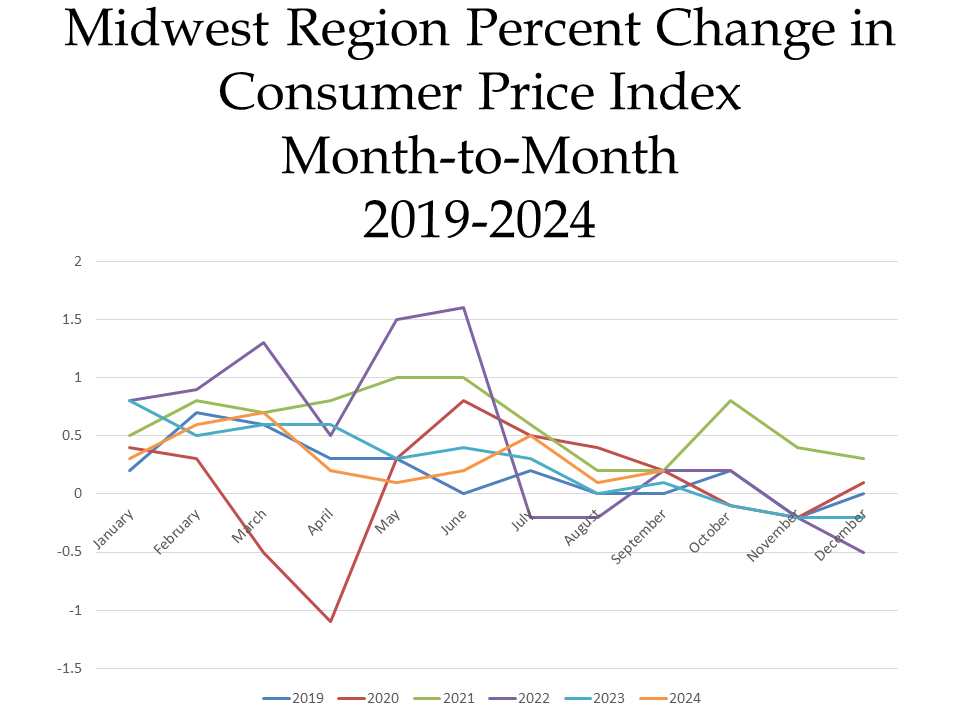
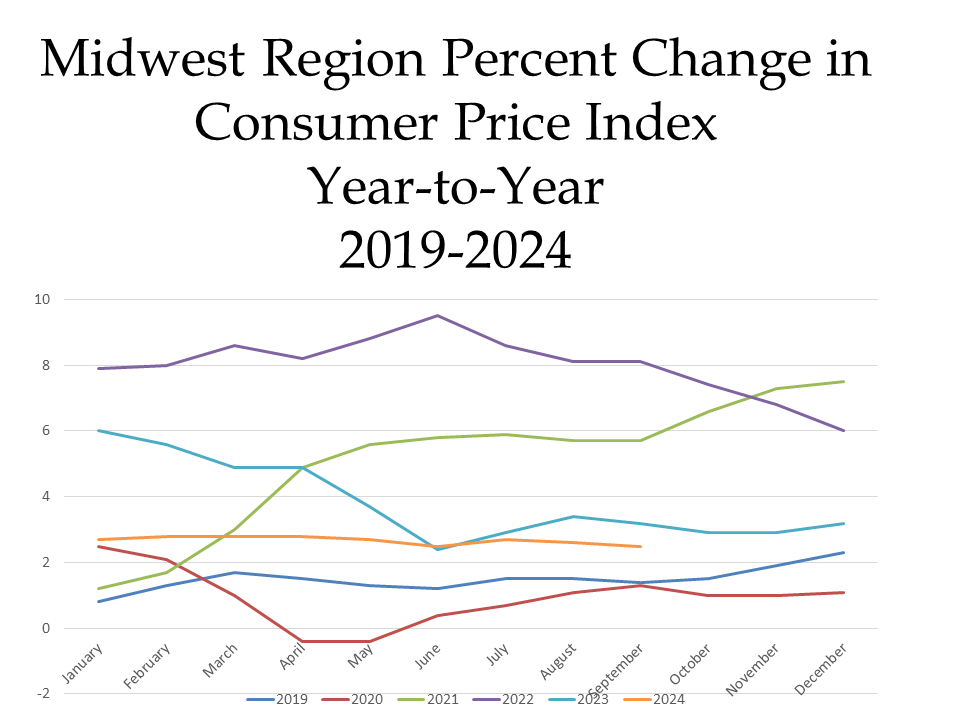
The charts below show the percent changes in the Consumer Price Index (CPI) on a month-to-month basis and a year-to-year basis for each month in years 2019, 2020, 2021, 2022, 2023 and 2024 in the Midwest Region. The CPI is a measure that examines the weighted average of prices of consumer goods and services, such as transportation, food, energy, housing and medical care. It is calculated by taking price changes for each item in the predetermined group of goods and averaging them.
The first chart below highlights how the CPI changed on a month-to-month basis between 2019 and 2024. Currently in 2024, the region’s prices were up 0.2 percent in the month of August. The highlights for the change include:
- Overall food prices increased by 0.4 percent, but the price of meat, fish, poultry and eggs increased 1 percent and the price of fruits and vegetables increased by 1.1 percent
- The energy index decreased by 2.4 percent.
- The cost of transportation decreased by 0.7 percent, and the cost of motor fuel decreased by 5.5 percent.
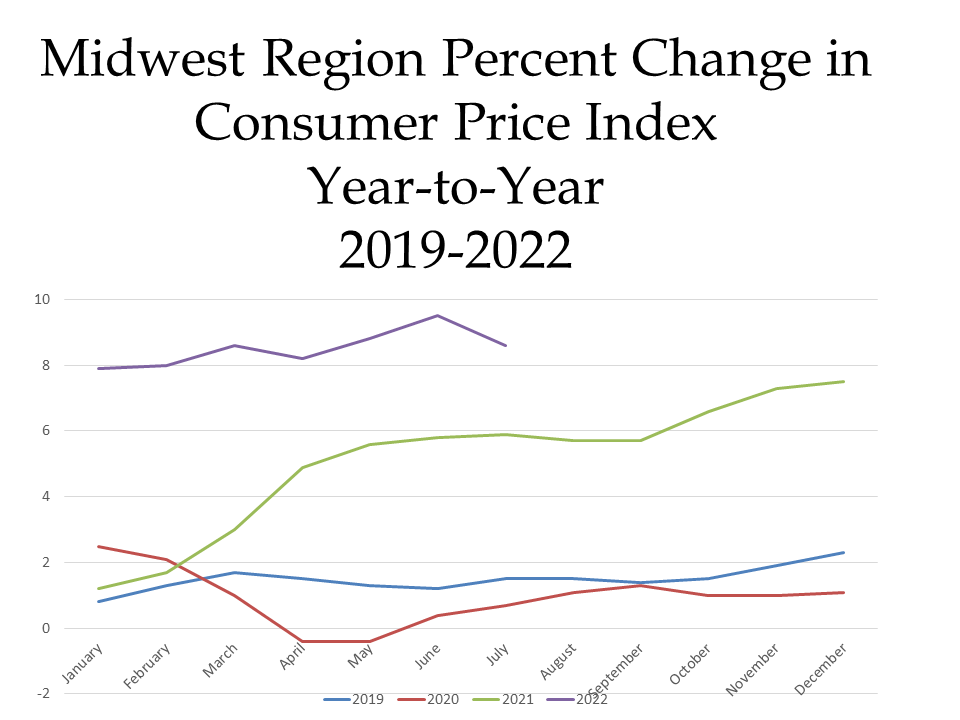
When examining the second chart, which shows how prices changed on a year-to-year basis, we see how prices remain lower than this point in time in 2021, 2022 and 2023.
In September of 2024 the CPI was reported to be 2.5 percent above what it was the year prior. Contributing factors to the continued increase in the CPI include:
- Food and beverage prices increasing 2.4 percent over the last year, with away from home food prices increasing 3.9 percent and food at home increasing 1.3 percent.
- Housing increasing 4.9 percent, with rent increasing 4.9 percent and the equivalent of rent increasing 5.2 percent.
- The cost of transportation decreased by 1.1 percent, with motor fuel decreasing 15.5 percent and motor vehicle insurance increasing 16. percent.
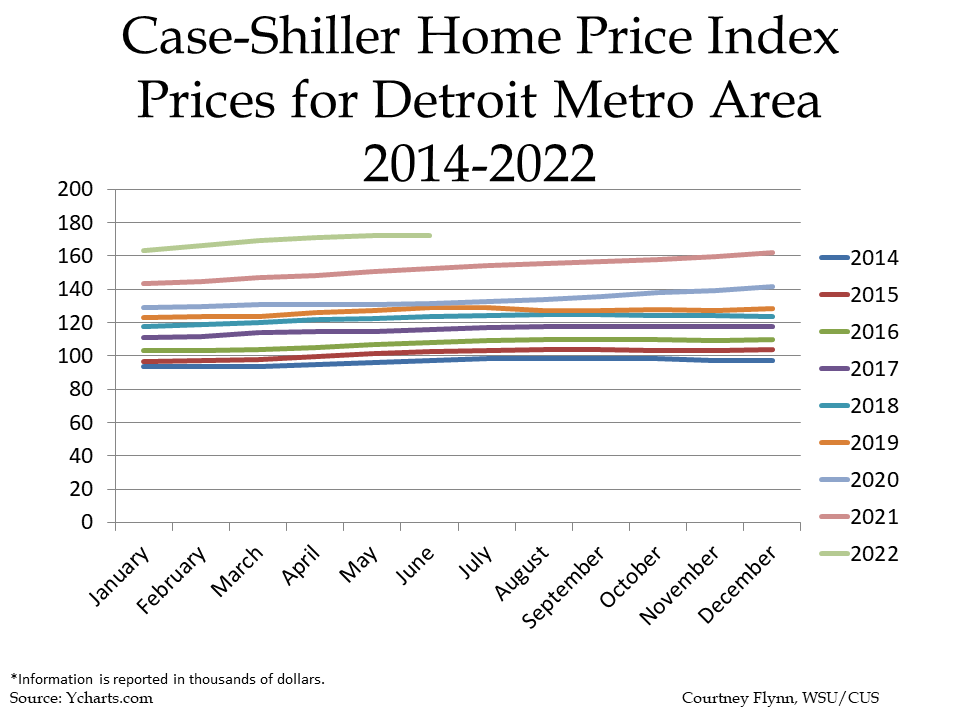
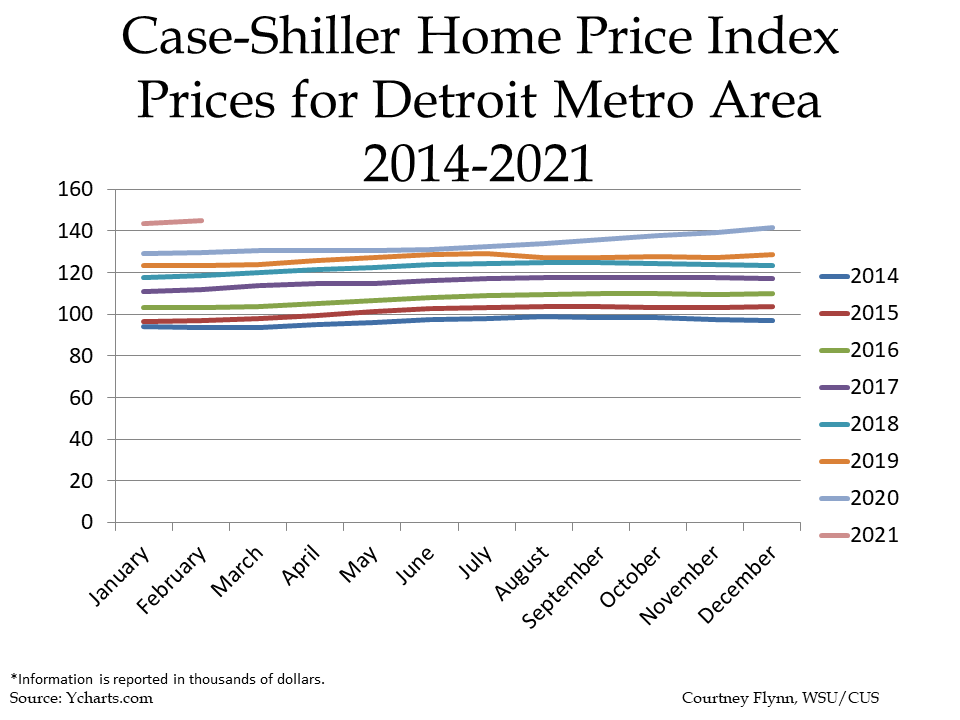
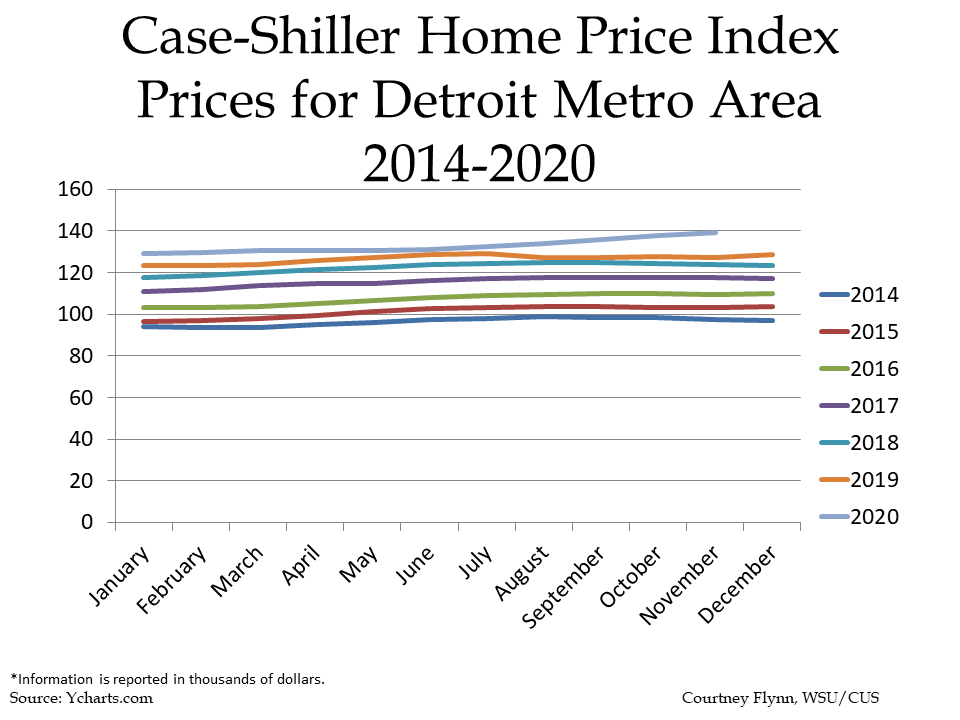
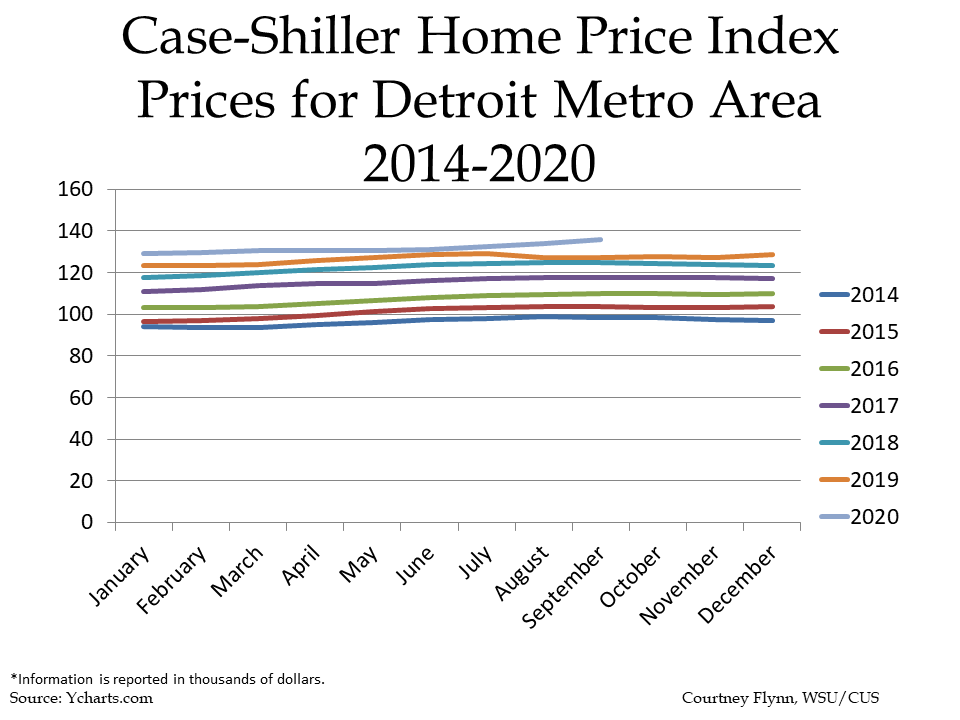
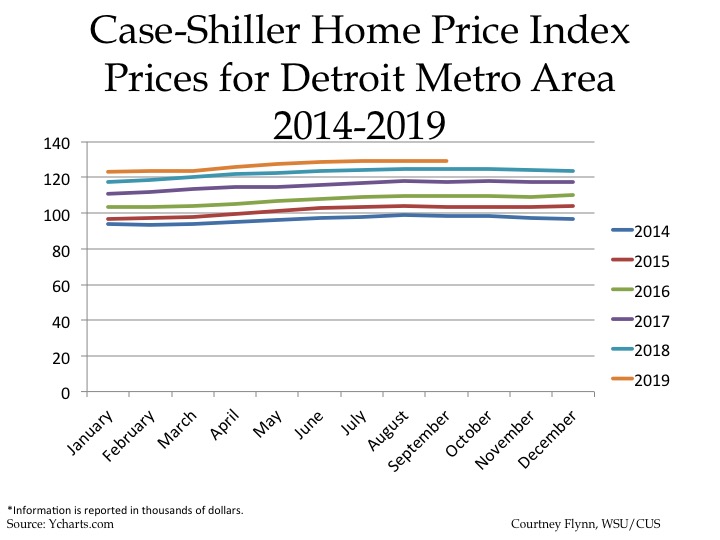
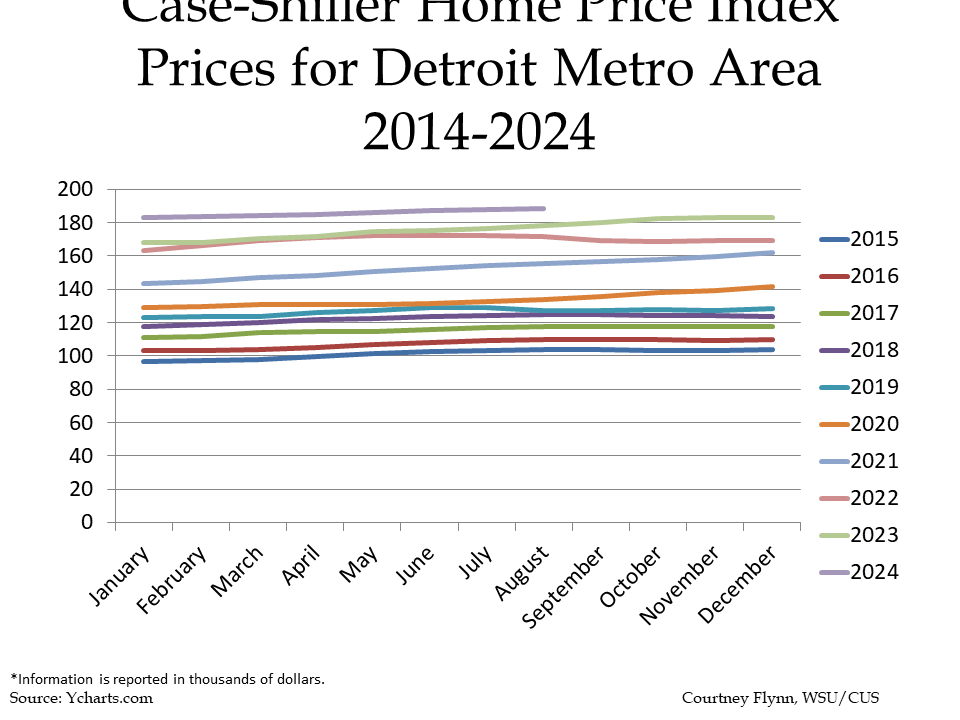
Home prices in Metro-Detroit for 2024 are again higher than in years’ past, with gradual increases occurring from month-to-month. In August of 2024, the average price of a single-family dwelling sold was $188,7600, according to the Case Shiller Index. In July of 2024, the average price of single-family dwellings sold was $188,000, which is $760 a difference from the month prior. While there was an increase, it is much lower than what we have seen in months’ and years’ past. However, the year-to-year comparison does show home prices continue to increase at high rates.
Between August of 2024 and 2023 the average price of a single-family dwelling increased $10,570; between August of 2024 and 2022 the price increased $17,350, between August of 2024 and 2020 the average price has increased $54,640 and between August of 2024 and 2014 the average price has increased $90,040.
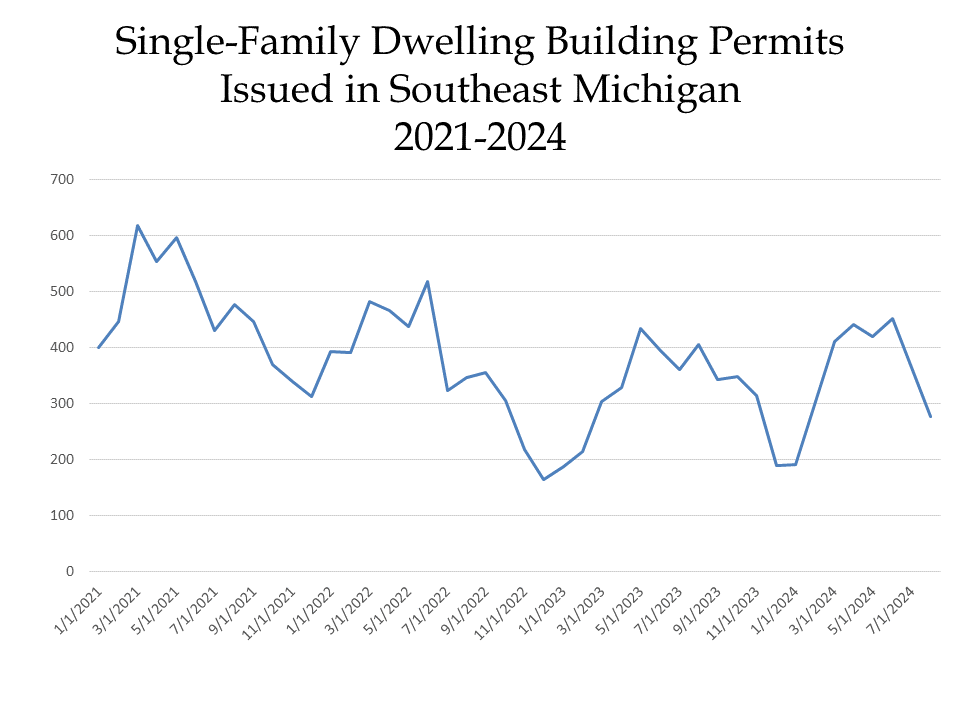
Building permits reached an annual peak in June of 2024 and then decreased for the remainder of the summer. The number of single-family dwelling building permits pulled in August of 2024 was 277. The last time fewer single-family dwelling permits were pulled was in January of 2023; 187 were pulled at that time. Despite the fewer number of building permits pulled, there was a call from the Governor to earlier this year to build more.