Detroit’s Infant Mortality Rate Reaches 13 Year High

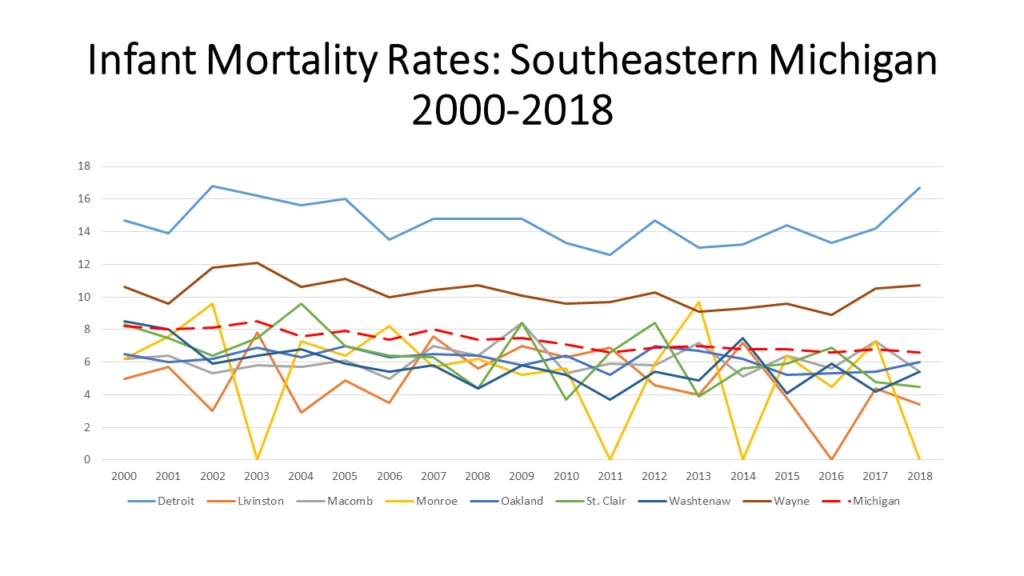
Michigan ranks 36th in the country in infant mortality and the City of Detroit has the highest number of infant deaths in the State, according to the Michigan Department of Health and Human Services. In 2018, the most recent year for which data was available, Detroit’s infant mortality rate was 16.7, the highest its been since 2002 when the rate was 16.8 These two rates translate to 9,476 (2018) infant deaths and 14,187 (2002) infant deaths, respectably. The infant death rate is the number of resident infant deaths divided by total resident live births X 1,000.  Infant deaths are deaths occurring to individuals less than 1 year of age.

As shown in the first chart below, Detroit infant mortality rates are consistently much higher than those of any county in Southeastern Michigan, and any other county in the State. Detroit’s infant mortality rates are also consistently higher than the State average. And, while the State’s infant mortality rates have been declining overall since 2000 Detroit’s rate has increased 3 points since 2016. It is important to remember that over 50 percent of children in Detroit families live below the poverty rate, far higher than elsewhere in the state.

Monroe and Livingston counties have regularly had the lowest rates; in some years not enough data was available for a rate. While we know that Detroit and Wayne County’s infant mortality rates are much higher than those in Monroe, Livingston and Washtenaw counties we also know that race plays a role in infant mortality rates. According to the US Department of Health and Human Services Office of Minority Health, African Americans • Have 2.3 times the infant mortality rate as non-Hispanic whites;

•Are 3.8 times as likely to die from complications related to low birthweight as compared to non-Hispanic white infants;

•Had over twice the sudden infant death syndrome mortality rate as non-Hispanic whites, in 2017.

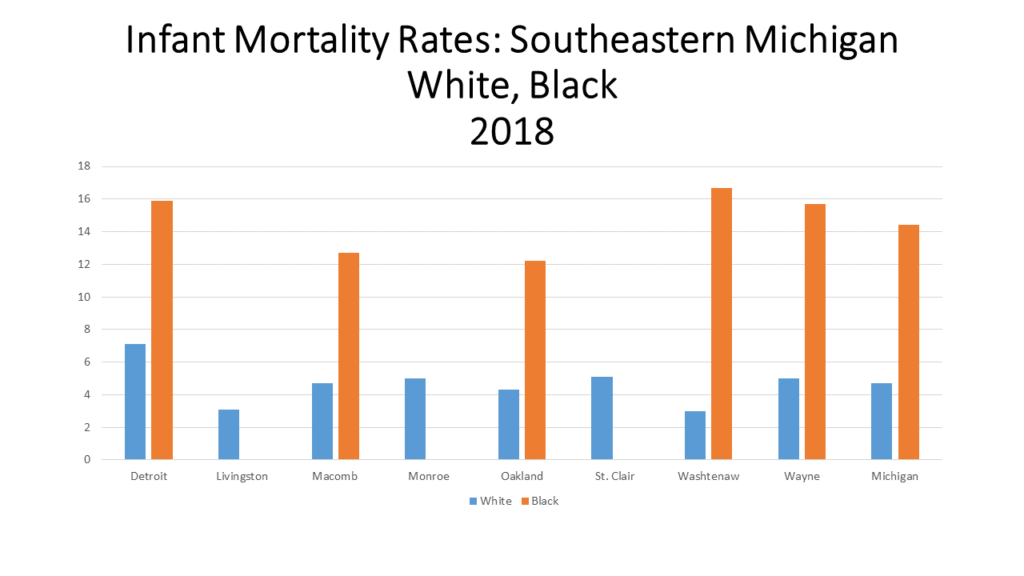
Additionally, in 2017, African American mothers were 2.3 times more likely than non-Hispanic white mothers to receive late or no prenatal care. The evidence of these statistics are also apparent in the second chart below.

In 2018, the most recent year for which data was available, the infant mortality rate for black babies in Detroit was 15.9 while for white babies it was 7.1. That gap between infant mortality rates of white and black was even larger at the State level ( 14.4 for black babies and 4.4 for white babies) and at the county level in the region (compared to that in Detroit), where median incomes tend to be higher. Furthermore, Detroit’s overall infant mortality rate is likely the highest in the State because it has among of the highest percentage of black residents. According to the US Census Bureau, 78 percent of Detroit’s population is black, 39 percent of Wayne County’s population is black while 1 percent of Livingston County’s population is black and 2 percent of Monroe County’s is black. Statewide, 14 percent of the population is black.

Not only should the increasing infant mortality rates of Detroit and Wayne County be of concern, but so should the causes. As alluded to above, race and income are contributing factors to infant mortality rates, as is racism. According to the Michigan League for Public Policy’s report “Strong Moms for Thriving Babies: Right Start 2020“ issues such as poverty and racism must be addressed in order for local infant mortality rates to decrease. Recommendations to do this include extending Medicaid coverage to 12 months postpartum; allowing for and enhancing reimbursement rates; increasing the number of high-quality home visiting programs to establish healthy starts for families by offering moms and their children, valuable health screenings and connecting families; restoring Michigan’s Earned Income Tax Credit; and advocating for paid paternity leave.

Statewide, a $12.6 million annual budget for the new program “Healthy Moms, Healthy Babies” was approved as part of the 2021 budget. This program is aimed at decreasing the infant mortality rate while providing the resources in order to accomplish that goal. Components of this program include:

• Plans to expand healthcare coverage for a mother to a year;

•Moving a woman’s first postpartum visit to within three weeks, with a comprehensive visit within twelve weeks;

•Requiring implicit bias training for medical professionals;

•Expanding home visits;

•Allowing the woman to chose what form of birth control works best for her.

The problem, however, is that divided evenly this would provide only about $116 per child under one. If it were concentrated on only the 19%  of children in poverty, this would set aside a bit over $500 per child. Is it likely this is enough to make substantial change?

Revenue Sharing for Michigan Counties Remains Stagnant

The State of Michigan has consistently disinvested in local government by providing less and less in revenue sharing. Cities, townships, villages and counties all rely on this funding to address there budget needs. But, since 2002 the State has withheld more than $8 billion. We have discussed the loss of revenue sharing-both constitutional and statutory-for the local municipalities, however we have not explored revenue sharing at the county level. Unlike cities, townships and villages, counties do not receive constitutional revenue sharing but rather only statutory revenue sharing. The chart below shows data from the Department of Treasury, which reported on the amount of revenue sharing each county received since 2013. The 2020 number below is the expected amount each county is to receive for fiscal year 2020.

According to the State Revenue Sharing Act of 1971 counties are to receive between 21 and 25 percent of sales tax revenue at the 4 percent rate. That changed for a short period of time when in Fiscal Year 2004-05 revenue sharing payments to counties were temporarily suspended. At that time counties were required to create a reserve fund with their own general fund dollars; counties were then allowed to withdrawal funds in lieu of the state revenue sharing funds that were not being dispersed, according to the Senate Fiscal Agency. Once a county exhausted its reserve fund then it could again become eligible for state revenue sharing funds. To add to that, in 2013 counties also became eligible for County Incentive Program Funds; 20 percent of a counties revenue sharing was based on eligibility in this program. These funds are allocated if a county meets certain transparency and accountability standards set by the State.

As the chart shows above, there has not been a serious increase in county revenue sharing since 2015, and between 2014 and 2015 Wayne County received the largest increase of about $10 million. This increase did not come from the County Incentive Program Funds, which accounted for about $10 million in 2014 and 2015, but from its statutory funding. In 2014 Wayne County received about $40 million in revenue sharing and in 2015 that increased to about $50 million. For Fiscal Year 2020 Wayne County it was proposed Wayne County receive about $52 million in revenue sharing, a small increase from its $50 million appropriation in 2015. In 2020 Wayne County’s revenue sharing payment is to be eligible to be $42 million from statutory funding and $10 million from the County Incentive Program. 

Another item to note is how Oakland County did not receive revenue sharing in 2013 and 2014. According to the data Oakland County was not eligible for any type of revenue sharing funding in either year. Although no specific information was available as to why, it could have been that the County used its reserve funds by 2013 and was not eligible for restored funding from the State until 2015.

One of the components of revenue sharing formulas is population, which is reflected in the amount of funding each county received in the chart above. Wayne County has the largest population, which is why it has consistently received the highest amount of funding and counties like Monroe and St. Clair or more rural with more lower populations and lower funding amounts.

Overall, the chart above show how revenue sharing for counties in Southeastern Michigan (and at a greater level, across the state) has remained stagnant for several years. The stagnation, and loss, of revenue sharing funds directly impacts that services a county provides. According to the Michigan Association of Counties, counties have lost $2.4 billion in revenue sharing funds. Additionally, in 2019, cities, townships and villages received more than $1 billion total in both constitutional and statutory revenue sharing funds and counties received $221 million in statutory funding. We will also look

Ethanol Fueled Vehicles Most Popular Among Those Powered by Alternative Fuels

With alternative energy sources slowly growing more popular for consumption, there are also certain sources that remain popular to fuel vehicles. The U.S. Energy Information Administration provides data on the number of vehicles that are powered by alternative energy sources. Ethanol is by far the most commonly used alternative fuel source used to power vehicles, followed by electric hybrid vehicles. While the use of some of these alternative fuel sources is growing, most of the fuel sources have experienced a decrease in use in recent years.

Of the alternative fuels sources the U.S. Energy Information Administration provides information on, ethanol was the most highly used fuel source. Ethanol is a renewable fuel made from corn and other plant materials.

In 2004 there were 674,678 vehicles that used ethanol as a fuel source. By 2013 that number reached its peak at more than 2.6 million vehicles using ethanol as a fuel source. While the number of vehicles using ethanol as a fuel source has declined in recent years ( in 2016 about 1.4 million vehicles used it as a fuel source), it still remains the most utilized renewable fuel source for vehicles.

The number of gas-electric hybrid vehicles produced on an annual basis has been increasing since 2004. In 2004 there were 88,272 gas-electric hybrid vehicles and in 2016 that number was 399,367. It was in 2013 when there was the most number of gas-electric hybrid vehicles, that number was 458,994.

The use of diesel-electric hybrid vehicles has not been as popular and has not grown as much as gas-hybrid vehicle. In 2004 there were 419 diesel-electric hybrid vehicles and by 2016 that number had only grown to 1,053. The number of diesel-electric hybrid vehicles peaked in 2009 at 2,223.

The use of electric vehicles didn’t really take off until 2013 when there was an inventory of 130,323. Between 2004 and 2010 though there were no more than 3,200 electric vehicles each of those years. It was in 2011 when the use of electric vehicles began to take off, and by 2016 there were 160,191 electric vehicles.

While compressed natural gas is widely available, its utilization as a fuel source falls below many of the other renewable fuel sources available to vehicles. In 2016 there were 5,730 vehicles fueled by compressed natural gas, a number that is below how many there were in 2004 (7,752). It was in 2013 when there was the most amount of vehicles fueled by compressed natural gas, that number was 9,454.

Building in Metro-Detroit Beginning to Slow

  • The State and City of Detroit’s unemployment rates decreased at the monthly and annual levels;
  • Regionally, August 2018 unemployment rates are lower than the prior year, with the exception of Macomb and Wayne counties;
  • Housing prices continue to rise in Metro-Detroit.
  • New building permits being pulled regionally decreasing

In August of 2018 the unemployment rate for the State of Michigan was 4.1, a small decrease from the July unemployment rate of 4.2, according to the most recent data provided by the Michigan Department of Technology, Management and Budget. The State unemployment rate for August of 2017 was 0.5 points above what it was in August of 2018.

The Detroit rate was 0.2 points lower in August of 2018 than in August of 2017. Also, the August 2018 unemployment rate for Detroit was 1.7 points lower than what it was the previous month (July 2017).

The chart above displays the unemployment rates for each of the seven counties in Southeastern Michigan for August of 2017 and 2018. In August of 2018 Wayne County had the highest unemployment rate at 5.3, with Monroe County having the second highest regional unemployment rate 4.5. These two counties were the only two in the region to have unemployment rates at or above 4.5 in August of 2018. Conversely, Oakland, Washtenaw and Livingston counties all had unemployment rates at or below 3.5 in August of 2018.

Regionally, Livingston County had the lowest unemployment rate in August of 2018 at 3. Livingston County also had the lowest unemployment rate in August of 2017 at 3.6 while Monroe County had the highest unemployment rate in August of 2017 at 5.7.

When comparing 2017 and 2018, Wayne and Macomb counties are the only two where the unemployment rate was higher in 2018 than in 2017. For Macomb County, in August of 2017 the unemployment rate was 3.9 and for 2018 it was 3.8. For Wayne County there was also a 1.0 difference, from 4.3 in 2017 up to 5.3 in 2018.

The above chart shows the Standard and Poor’s Case-Shiller Home Price Index for the Detroit Metropolitan Statistical Area. The index includes the price for homes that have sold but does not include the price of new home construction, condos, or homes that have been remodeled.

According to the index, the average price of single-family dwellings sold in Metro Detroit was $124,240 in July 2018; this was $510 higher than the average family dwelling price in June. The July 2018 price was an increase of $7,160 from July of 2017 and an increase of $15,070 from July of 2016, an increase of $20,900 from July of 2016 and increase of $26,110 from July of 2014.

While home prices have been growing in Southeastern Michigan, a recent Detroit News article detailed how construction is slowing down, largely in part due to land and labor shortages and the associated costs. Also according to the article, August housing permits for single-family home construction decreased by 1.8 percent statewide compared to this time last year. This 1.8 percent increase was nearly the same as it was at this time last year (from 2016 to 2017), but for 2016 that annual increase was about 10 percent, according to the article.

The chart below highlights how around 2011 the number of single family home building permits issued in each county in the region began to increase, spiking in about 2013. Then, more recently, Oakland, Wayne, Monroe and St. Clair counties experienced another increase in the number of permits pulled in 2017. However, the 2018 numbers, which are not complete for the year, do indicate that year end numbers will not compare with 2017. With only three months left in the year, and construction season slowing down for winter, it is likely many, if not all the counties in the region will not increase the annual number of building permits pulled over 2017.

Despite some regional housing growth, the Detroit News article indicated that affordable single family homes, particularly ones geared toward first-time buyers, are lacking in inventory in the region.