Small Businesses Growth in Michigan is Occurring, But at What Pace?

The growth of small businesses, or lack thereof, in Michigan varies depending on the sources.

While we know business closures have declined since the height of the pandemic and business applications continue to be submitted, anecdotes around employment in Southeastern Michigan tell a story that larger companies, which often have the capacity to offer higher wages and additional benefits, are gaining and retaining more employees than smaller businesses.

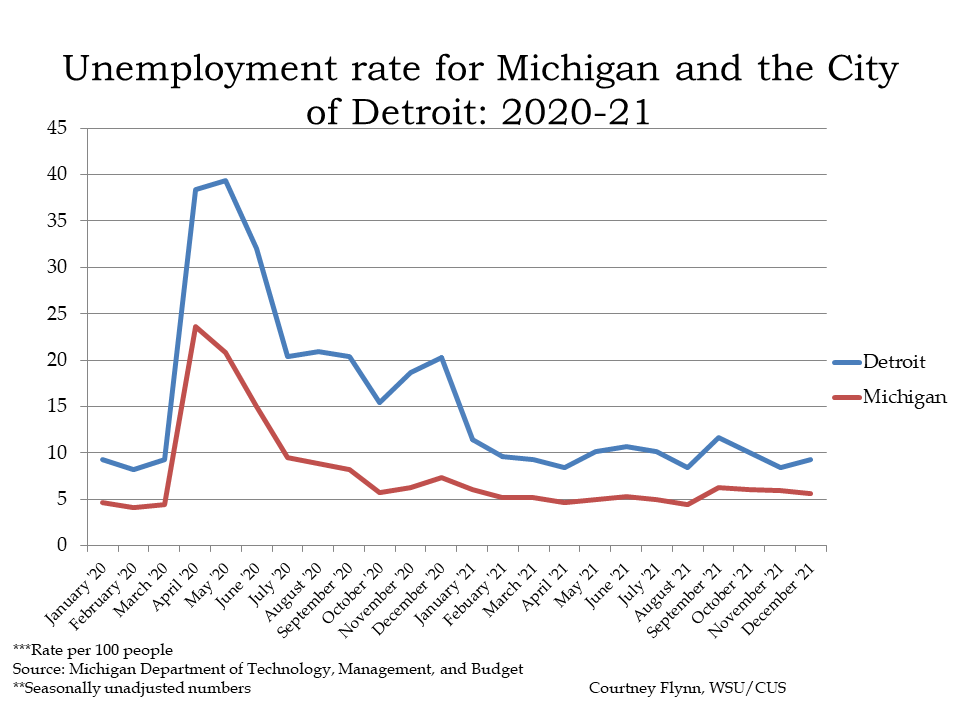
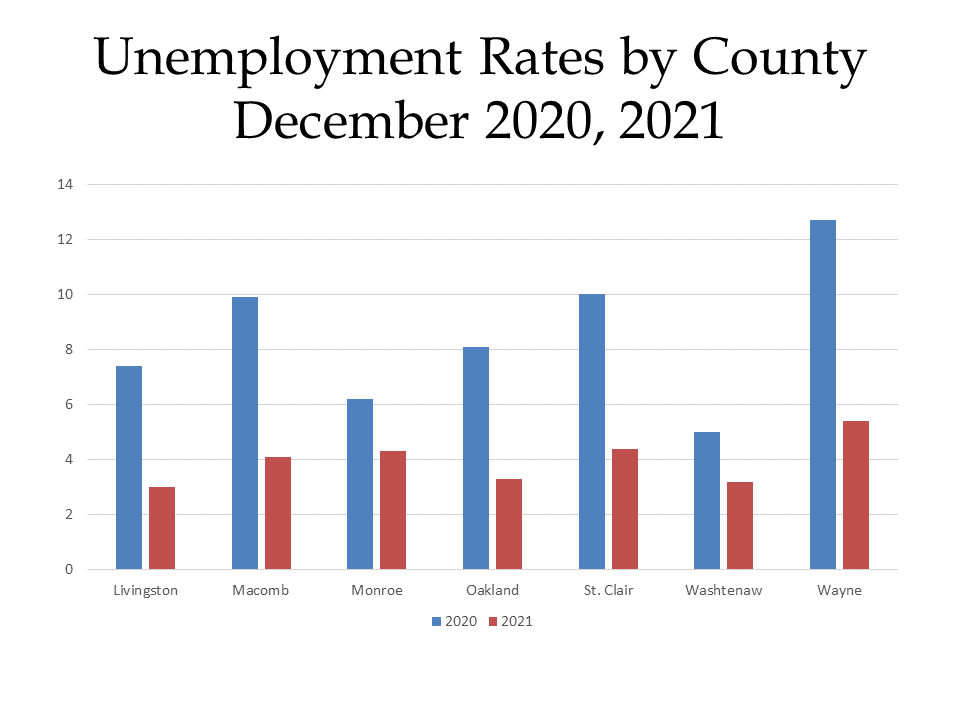
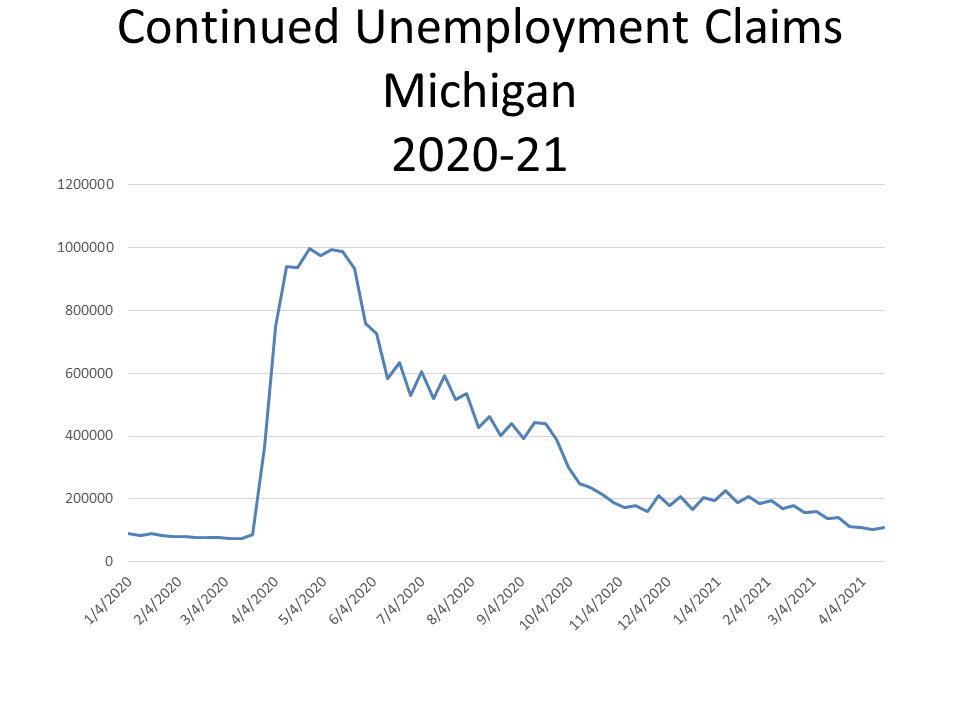
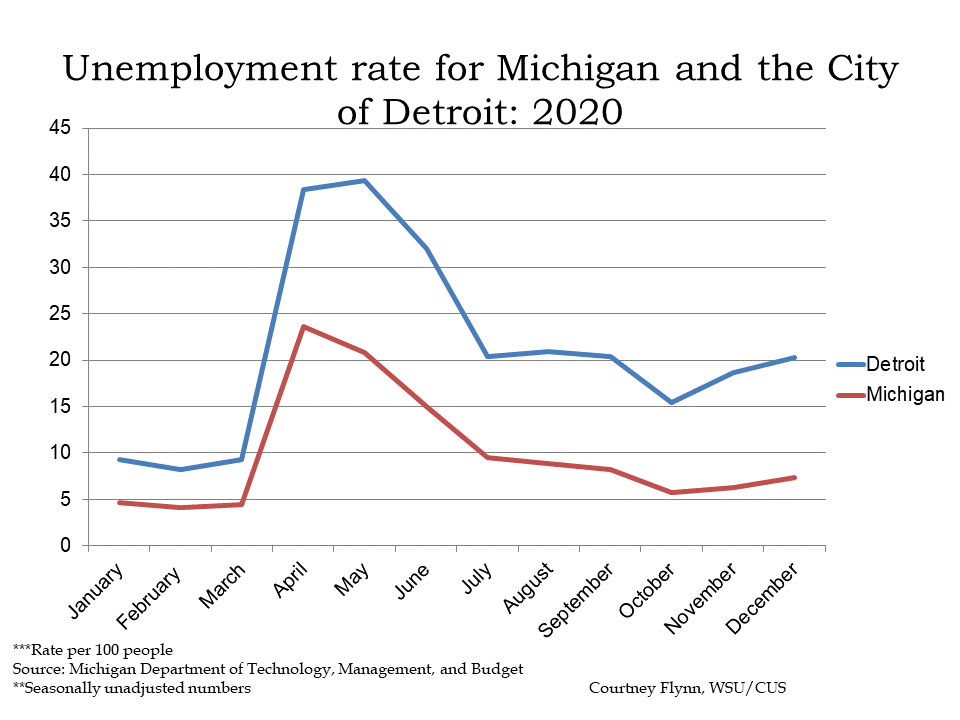
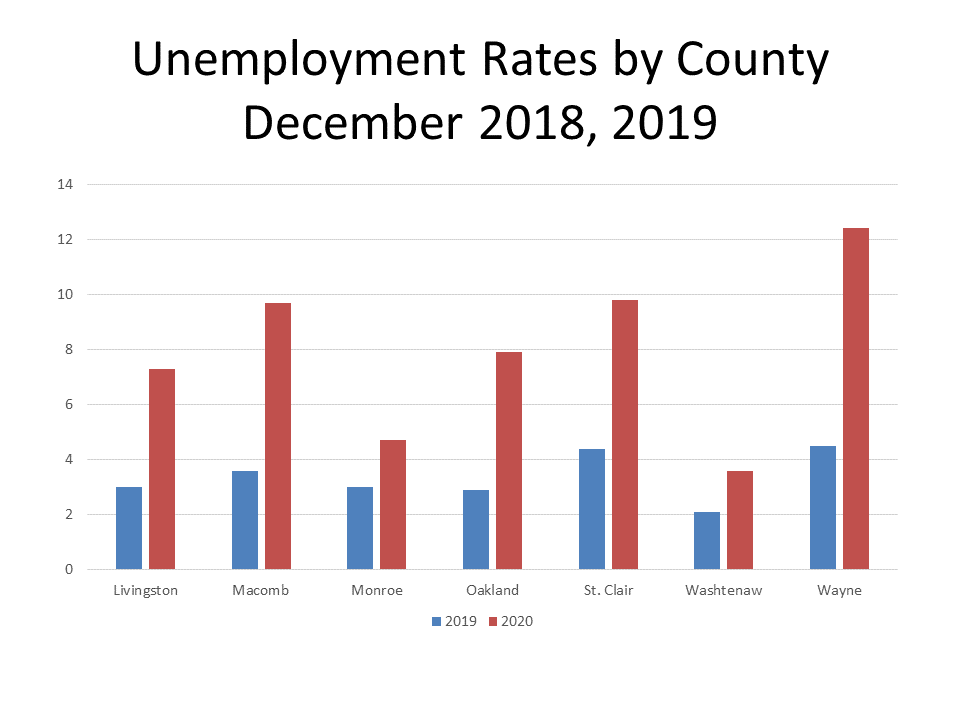
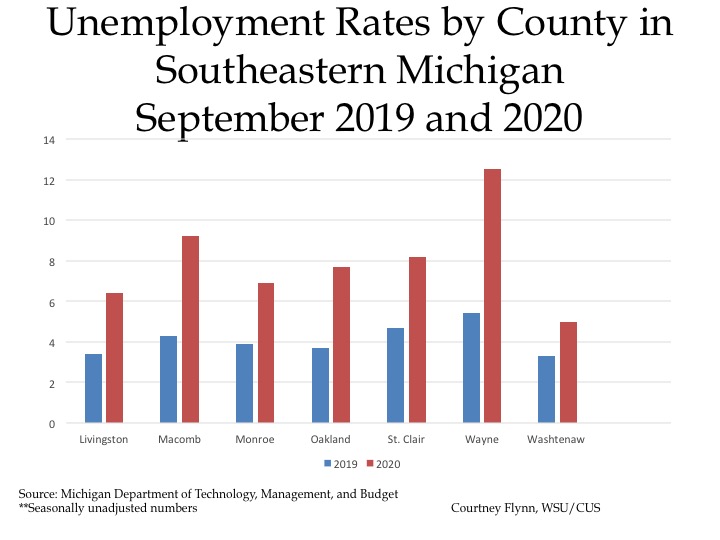
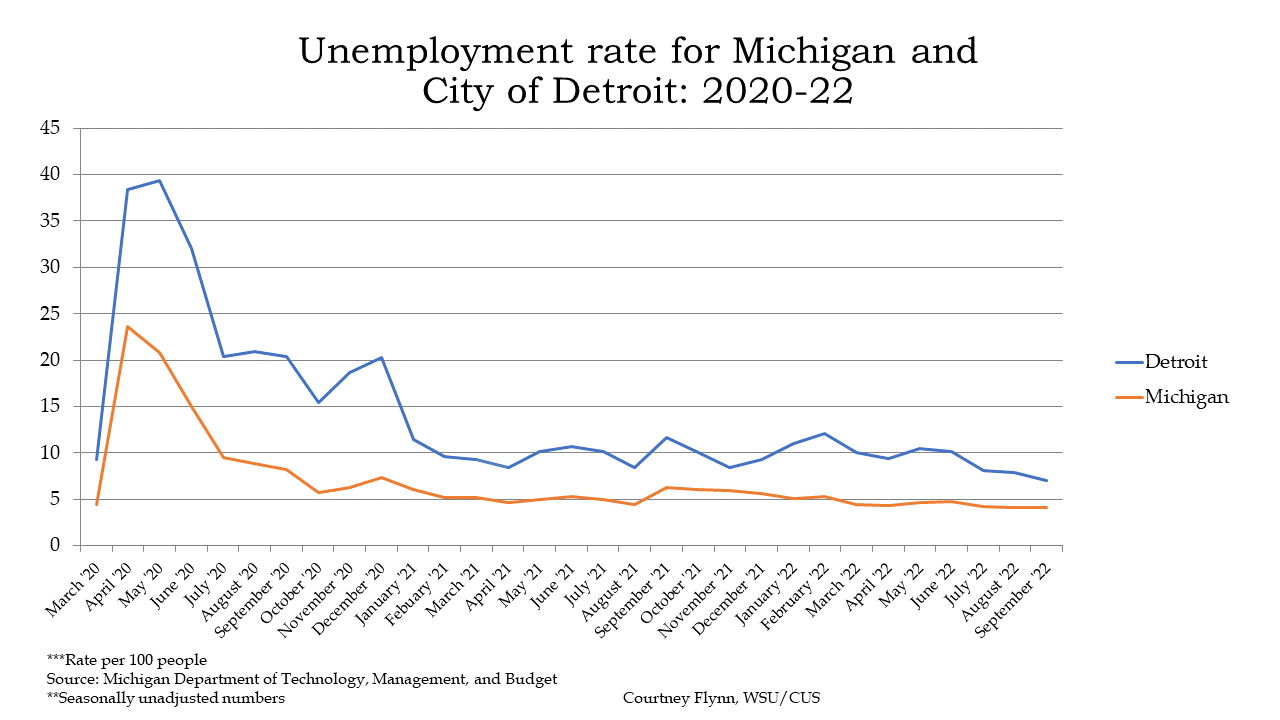
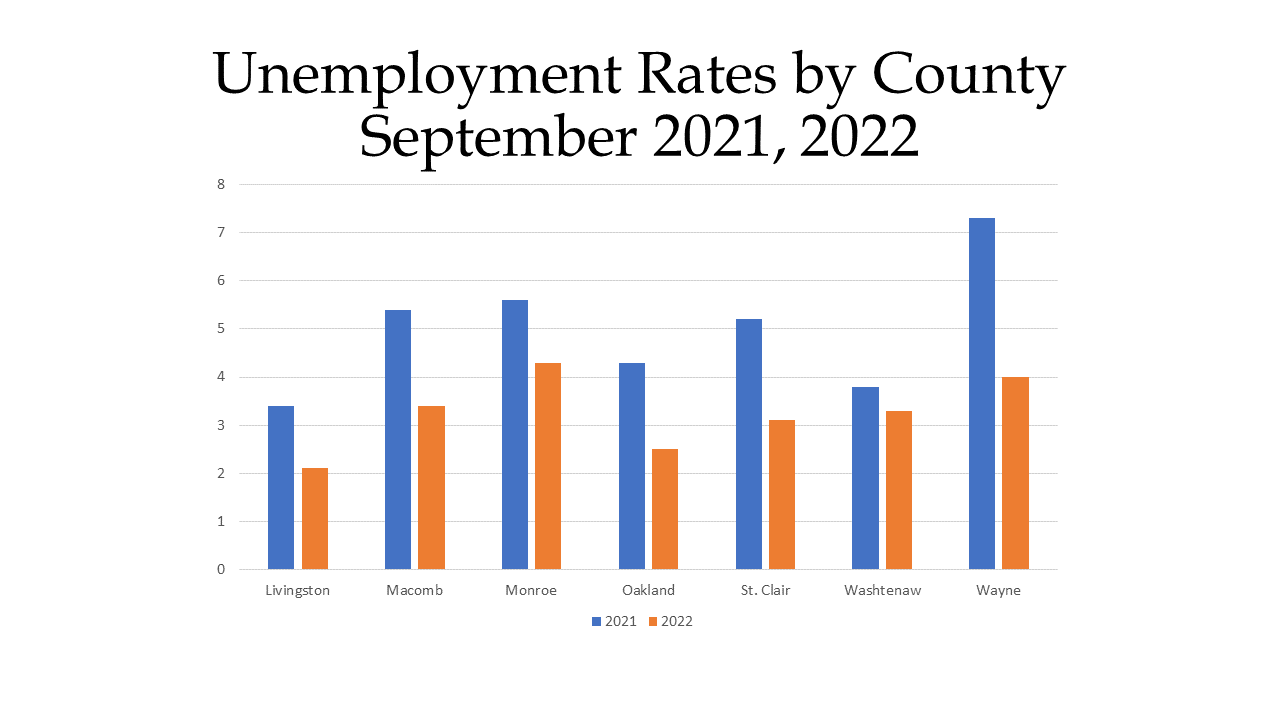
The data that we do know is that, according to a May 2022 press release from Gov. Gretchen Whitmer’s office there are 902,000 small businesses in Michigan which employ 1.9 million individuals.  We also know that unemployment in Detroit and Michigan has seen an overall decline. In September of 2022, according to the Michigan Department of Technology, Management and Budget the unemployment rate for the City of Detroit was 7 percent; the unemployment rate for the State of Michigan was 4.1 percent. These are two of the lowest unemployment rates each area has seen in over two years. When comparing unemployment rates by county between September of 2021 and September of 2022 we again see that unemployment rates for September of 2022 were down from the year prior. Overall, Livingston County had the lowest unemployment rate of 2.1 percent in September of 2022 and Wayne County experienced the largest decline with its unemployment rate changing from 7.3 percent in September of 2021 to 4 percent in September of 2022.

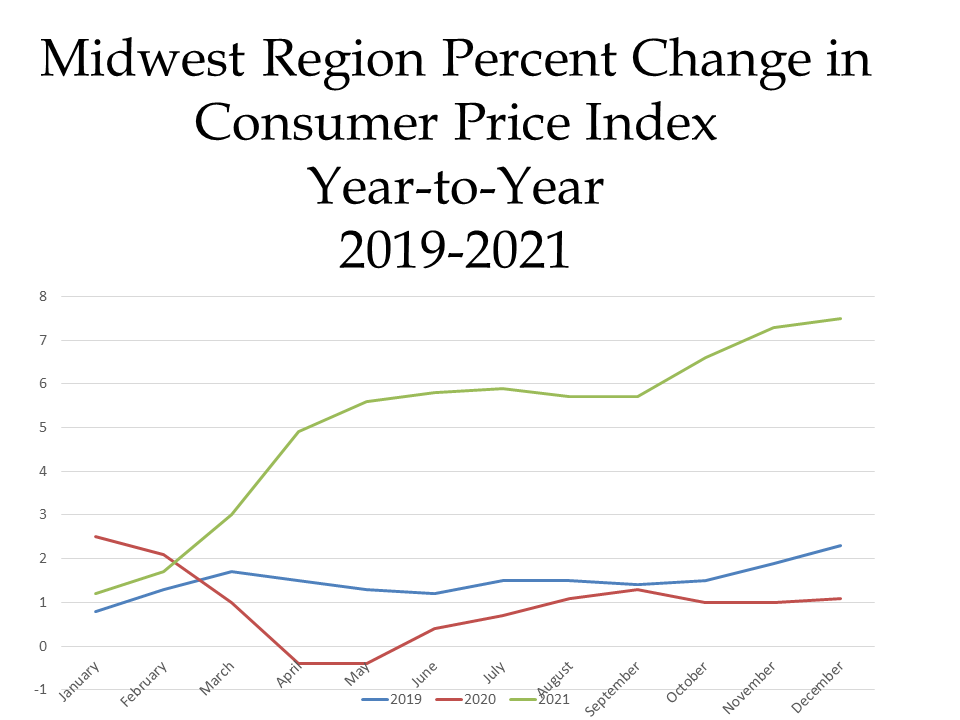
While low unemployment rates are one sign of a strong economy, according to a recent Detroit News article, 88 percent of respondents in a Goldman Sachs survey said small businesses are struggling compared to larger businesses. The reason? According to the survey, 42 percent of respondents said they lost employees to larger businesses that are paying more. With inflation continuing to rise, this is not surprising.

However, despite such challenges laid out by survey respondents, according to the 18th Annual Small Business Association of Michigan Entrepreneurship  Score Card, since 2020 small businesses in Michigan have outperformed the U.S. as a whole in terms of percent growth in businesses open and business revenue.

According to the scorecard, between January of 2020 and Feb. 6, 2022 small businesses in the State of Michigan have opened at a rate of 8.5 percent. In the U.S. small businesses have opened at a rate of 3.1 percent in that time frame. The Michigan rate represents an increase in small business revenue of 24.2% compared to 8% for the U.S., the report stated.

As displayed in the first chart below, the Southeast Michigan Council of Governments (SEMCOG) obtains data for the U.S. Census Bureau on small business applications in Michigan. According to this data, there 730 High-prosperity Business Applications during the week of November 18, 2022 and 250 Small Business Applications with Planned Wages. While the data for each category can shift somewhat dramatically from week-to-week, there is an overall trend of business applications in Michigan increasing since September of 2022 yet decreasing from both earlier in 2022 and since the beginning of the pandemic.

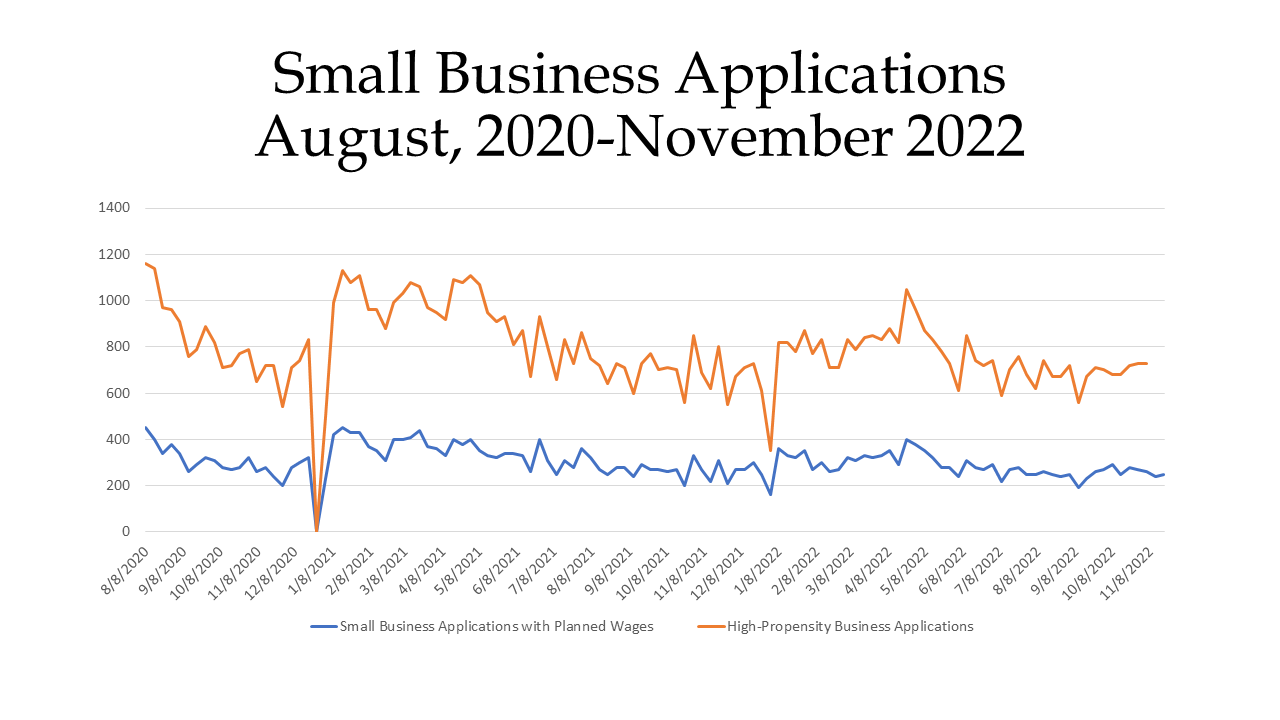
According to SEMCOG, high-Propensity Business Applications (HBA) are applications for a federal Employer Identification Number (EIN) where the characteristics of the application indicate that it is more likely to form a business with payroll. Businesses Applications with Planned Wages (WBA) are a subset of HBA that indicate a first wages-paid date, increasing the likelihood that such a business will have a paid employees.

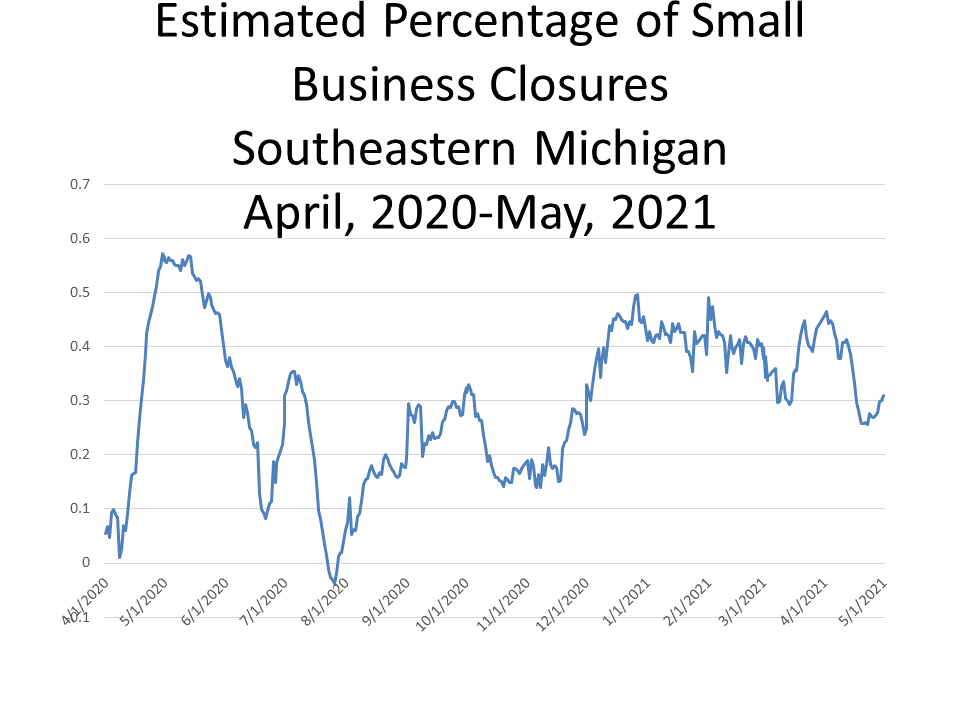
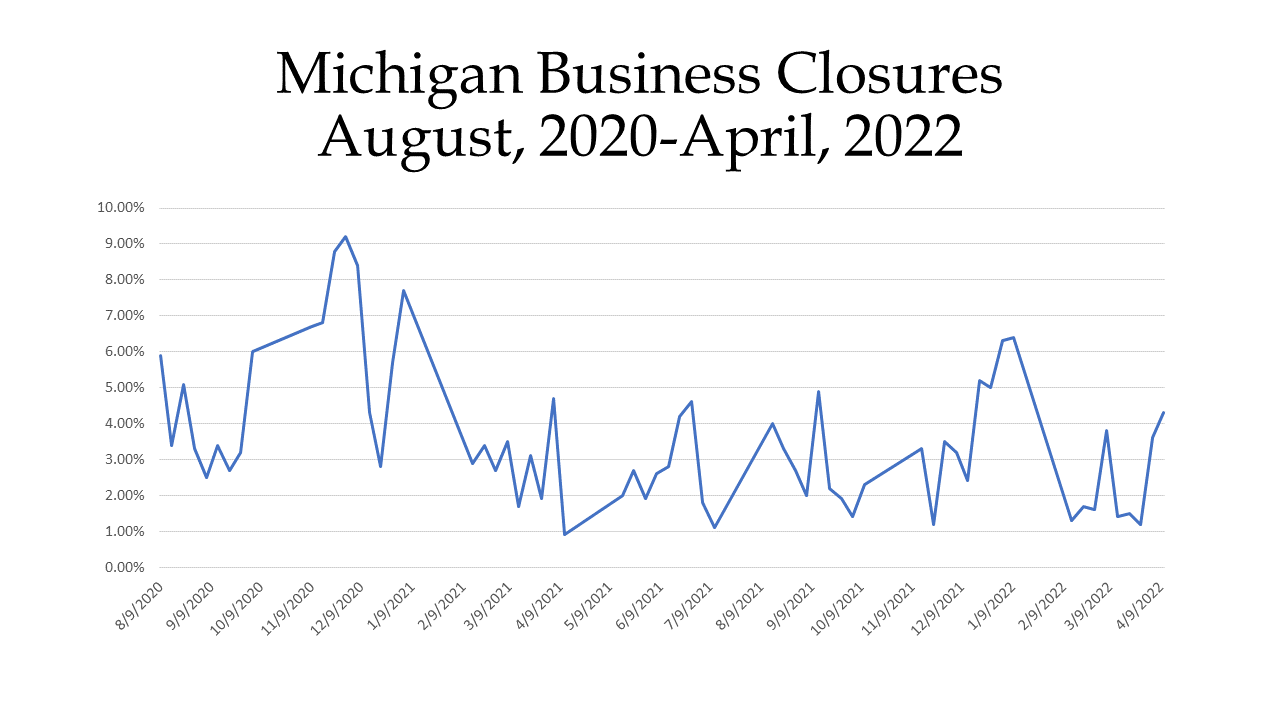
While the data shows businesses continue to open in Michigan, business closures slowed through April of 2022 (The last time such data was available through SEMCOG) compared to early on in the pandemic. According to SEMCOG data obtained from through the Census Bureau’s Small Business Pulse Survey, 4.3 percent of the 900,000 single-location businesses sample size closed during the week of April 9, 2022. The highest percent closure of this sample size was 9.2 percent during the week of November 20, 2020.

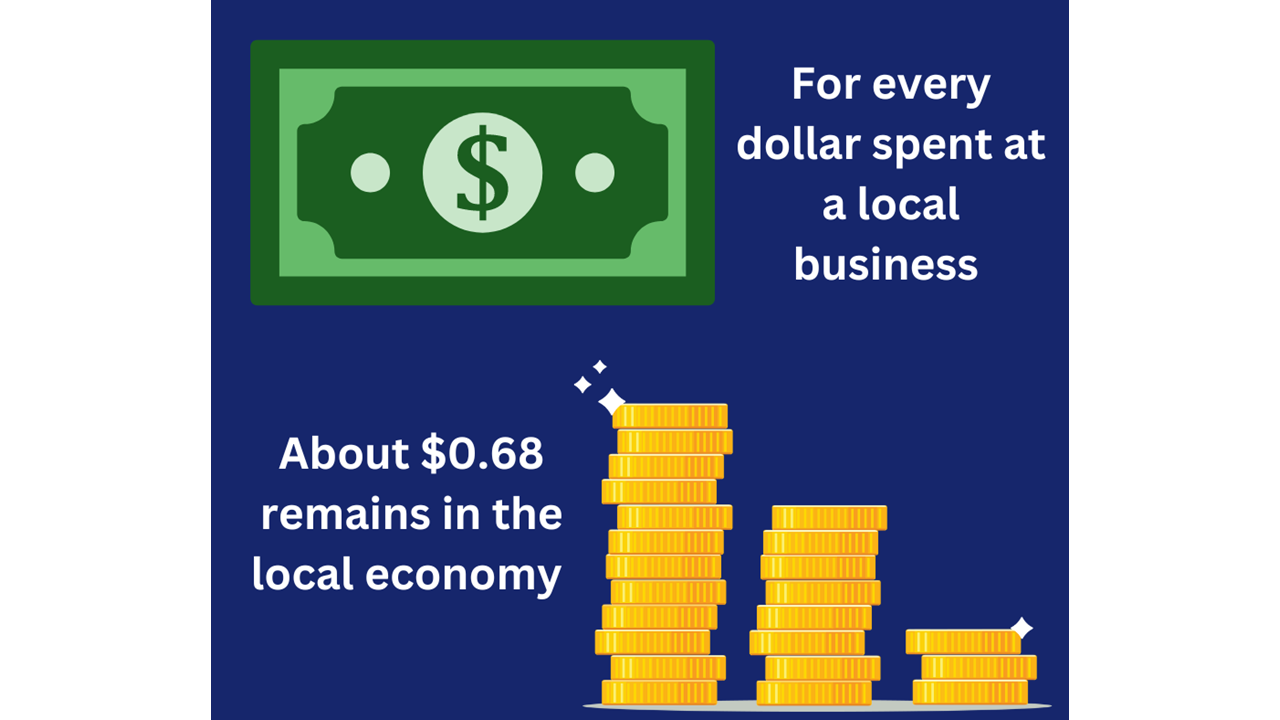
One way to help keep small businesses open is to shop local. This is the goal of Small Business Saturday, which occurs the Saturday after Thanksgiving. This is a campaign that American Express began in 2010 to help support small businesses in the midst of the Great Recession. It has certainly seen success over the years, with 51 million shoppers in the U.S. spending more than $23 billion at small businesses in 2021, according to American Express. However, the real takeaway here should be that for every $1 spent at a small business, it is estimated that $0.68 of those funds remain in the local economy (or, for every $100 spent, $68 remains in the local economy). This is something we should consider as part of our regular shopping habits, and not just one day a year.

Michigan’s Economy Pushes Forward As COVID Recovery Continues

According to recent data compiled by Bloomberg, Michigan’s economy has out-performed every other state’s in the last year based on equally weighted measures of employment, personal income, home prices, mortgage delinquency, state tax revenue and the stock market performance of its publicly-traded companies. One example of this is how the number of workers employed in Michigan has risen faster than the average number US of workers employed in the last year. Since April of 2020 the number of non-farm payrolls increased by 25 percent, according to the Bureau of Labor Statistics; the US average increased by 14.3 percent and Michigan lead every state in the nation with that 25 percent increase. Another example is how the bond ratings in the state have stood out compared to other state’s. Michigan’s AA-rated bonds returned 5.6 percent (income plus appreciation) since April 2020, outperforming neighboring Wisconsin (4.3%), Indiana (4.7%) and Ohio (4.7%) as well as the entire municipal market (5.3%), according to data compiled by Bloomberg. Additionally, bonds issued by the Michigan Strategic Fund returned a 15 percent interest rate and bonds issued by Detroit Downtown Development project returned a 14 percent interest rate, according to data compiled by Bloomberg. Closer inspection of this would probably also indicate that these bonds are carrying higher than market rates because of Detroit’s past financial challenges.

Another example highlighted by Bloomberg is how Michigan’s unemployment rate has recovered since the pandemic. The chart below shows the unemployment rates for Michigan and Detroit since January of 2020.

In December of 2021 the unemployment rate for the State of Michigan declined to 5.6 percent from the 5.9 percent it was reported at for November of 2021. In April of 2020, when Michigan first began experiencing the effects of the pandemic, the unemployment rate was reported at 23.6 percent.

For the City of Detroit, the unemployment rate for December of 2021 was 9.3 percent, an increase from the 8.4 percent it was reported at the month prior. When the pandemic first began Detroit’s unemployment rate was 38.4 percent and in December of 2020 the Detroit unemployment rate was 20.3 percent, meaning there has been a significant decrease in the local unemployment rate in the last nearly two years.

Digging deeper into the regional unemployment data, we see that each county in Southeastern Michigan had a lower unemployment rate in December of 2021 than December of 2020. Wayne County had the largest decrease over that year with a 7.3 unemployment rate decline. In December of 2020 Wayne County had a 12.7 percent unemployment rate and in December of 2021 it was reported at 5.4 percent. However, despite having the largest decline in its unemployment rate, Wayne County still reported the highest unemployment rate of the region in December of 2021 at 5.4 percent; Livingston County had the lowest at 3 percent.

The charts below show the percent changes in the Consumer Price Index (CPI) on a month-to-month basis and a year-to-year basis for each month in years 2019, 2020 and 2021 in the Midwest Region. The CPI is a measure that examines the weighted average of prices of consumer goods and services, such as transportation, food, energy, housing and medical care. It is calculated by taking price changes for each item in the predetermined group of goods and averaging them.

The first  chart below highlights how the CPI changed on a month-to-month basis between 2019 and 2021. Currently in 2021, the region’s prices were  up 0.8 percent in January, with higher prices for new and use motor vehicles (up 1.3 percent), household furnishings and operations (up 1.7 percent) and apparel (up 3.3 percent) being large contributors to the increase, without considering food and energy prices. Additionally, food prices increased 1.9 percent. The month-to-month changes reflect how pricing has changed one month to the next while the year-to-year CPI index reflects such changes on an annual basis, while considering each month.

When examining the second chart, which shows how prices changed on a year-to-year basis,  we see how prices continued to increase in 2021, with the December year-to-year CPI being the highest increase shown below. When examining both the month-to-month and year-to-year comparisons, the year-to-year data gives a clearer picture on just how much pries have increased in the last year. In December of 2021 the CPI was reported to be 7.5 percent above what it was the year prior. Contributing factors to the continued increase in the CPI include food prices increasing 8 percent over the last year and energy prices increasing 25 percent over the last year. Additionally, new and used motor vehicles increased 24.8 percent, shelter increased 4.6 percent and household furnishings and operations increased 11.6 percent.

While Michigan’s economy may be recovering since COVID first hit, the State’s housing market is not exempt for the increasing prices being witness across the country. Home prices continue to increase, as has already been indicated by the increasing CPI. In Metro Detroit, according to the Case-Shiller Home Price Index, the average price of single-family dwellings sold was $161,880 in December of 2021; this was $2,290 higher than the average family dwelling price in November. The December 2021 price was an increase of $20,220 from December of 2020 and $64,900 from December of 2014.

Unemployment Rates Leveling Off, Consumer Consumption Increasing

In March of 2021 the unemployment rates for the State of Michigan and for the City of Detroit continued to a decline, which is a more recent trend. The State of Michigan reported an unemployment rate of 5.2 in March, which is the same at its February rate. However, since December of 2020 the State’s unemployment rate declined from 7.3 to 5.2.  For the City of Detroit, the unemployment rate for March of 2021 was 9.3, which is 0.3 points lower than the February unemployment rate and 11 points lower than the December 2020 rate. Both the Michigan and the Detroit rates were similar to the January 2020, pre-pandemic rates.

The chart above shows unemployment rates beginning to level off and the chart below reflects a similar message for some counties. Livingston, Macomb, Oakland and Wayne counties all reported higher unemployment rates in March of 2020 than March of 2021. In March of 2020 St. Clair County had the highest unemployment rate of 5.9, followed by Wayne County with an unemployment rate of 5.7.  Washtenaw County had the lowest unemployment rate in March 2020 at 2.7, but by March of 2021 that increased to 4.3. Washtenaw and Monroe counties were the only two in the region with higher unemployment rates in March of 2021 than March 2020. Both Monroe and Wayne counties had the highest unemployment rates in March of 2021 at 5.6. Livingston County had the lowest unemployment rate in March of 2021 at 3.2.

Just as the unemployment rate in the region is declining, so is the number of continued unemployment claims. These claims, also referred to as insured unemployment, are the number of people who have already filed an initial claim and who have experienced a week of unemployment and then filed a continued claim to claim benefits for that week of unemployment. Continued claims data are based on the week of unemployment, not the week when the initial claim was filed, according to the Southeastern Michigan Council of Governments.

The chart below shows a spike in April and May of 2020, when COVID restrictions tightened throughout the State. Since then though there has been a steady decline in the number of continued claims. The largest declines occurred between May and June of 2020 and September and November of 2020. Although there have been some increases in the number of continued unemployment claims since November of 2020, the April 10, 2021 number of 102,721 unemployed claims is the lowest number of claims in over a year.

Although unemployment numbers have been on the decline, there has been a recent increase in the number of small business closures, according to the Opportunity Insights Economic Tracker. This source uses credit card transaction data from 500,000 small businesses, Opportunity Insights estimates closures from the number of small businesses not having at least one transaction in the previous three days. The data cover many industries, including healthcare services, leisure and hospitality, and retail and transportation. The date source does says it has less coverage in manufacturing, construction, and finance.

According to the data, 31 percent of small businesses closed as of May 1, 2021. This number was an increase from the 26 percent of small business that were estimated to be closed on April 23, 2021. 

Since April of 2020 the percentage of small business closures has increased, but those numbers are not as high as when the pandemic began.

Below shows the consumption expenditures of goods in the U.S. between 2019 and 2021. According to the U.S. Bureau of Economic Analysis, durable goods have an average useful life of at least 3 years (e.g. motor vehicles) while nondurable goods have an average useful life of less than 3 years (e.g. food) and services are commodities that cannot be stored or inventoried and are consumed at the time of purchase (e.g., dining out). The chart below shows how consumption of services continues to remain steady, but not back to pre-COVID levels. On March 1, 2021 it was estimated that there was $8,182 billion in consumption of services, a slight increase from the month prior but below the January 1, 2020 levels.

The expenditures on durable and non-durable goods are now increasing above pre-COVID levels with the amount spent on durable goods being $2,314 billion as of March 1, 2021 and the amount spent on non-durable goods being $3,342 billion.

According to the Case-Shiller Home Price Index, the average price of single-family dwellings sold in Metro Detroit was $148,500 in February of 2021; this was $1,500 higher than the average family dwelling price in January. The February 2021 price was an increase of $14,070 from February of 2020 and $49,430 from February of 2014. Home prices have continued to increase year-after-year but the recent average price of single-family dwellings sold in the Metro-Detroit area has increased at a higher rate than in previous years.  

Economic Indicators: Unemployment Rates, Housing Costs Remain Higher than Pre-COVID

We are a year into the COVID pandemic, unemployment rates have peaked and then declined, but they are still substantially higher than a year ago. Average home prices have increased as demand for homes has increased. Broader consumption trends though, while they are faring better than nearly a year ago, have yet to fully recover to pre-pandemic levels. Below we show just how these various indicators have changed over the last year.

In December of 2020 the unemployment rates for the State of Michigan and for the City of Detroit continued to increase after declines following the initial unemployment spikes due to COVID-19. The State of Michigan reported an unemployment rate of 7.3 in December, a higher rate than what was reported in November, which was 6.3. For the City of Detroit, the unemployment rate for December of 2020 was 20.3, which is higher than the November rate of 18.7. The December unemployment data further highlights how the unemployment gap between the State and Detroit continues to grow wider as the COVID case numbers increased rapidly over the holidays.

In line with what was reported above, COVID impacted unemployment rates at the county level in Michigan as well. In December of 2020 each county in Southeastern Michigan had a significantly higher unemployment rate than the year prior. According to data from the Michigan Department of Technology, Management and Budget, Wayne County experienced the largest increase at about 8 points. In December of 2020 Wayne County had an unemployment rate of 12.4 and in December of 2019 it was 4.5. Washtenaw County experienced the smallest increase at 1.5 points. In December of 2020 Washtenaw County had an unemployment rate of 3.6 and in December of 2019 it was 2.1. While there were overall unemployment increases, the differences in the unemployment percentages between each county is, at least in part, dependent on the type of jobs available in each county and the occupations of residents. For example, in Wayne County the top occupations are office and administrative support, production and sales and food service. In Washtenaw County the top occupations are office and administrative support, education instruction, health care practitioners and food service workers. Throughout much of the year some positions related to office and administrative support and food service have been considered non-essential or experienced higher layoff rates while those in health care and education have been at less risk of being unemployed.

The Bureau of Economic Analysis recently released data on the per capita personal income by county for 2019, showing that overall incomes in Southeastern Michigan did grow between 2018 and 2019. In 2019 Oakland County had the highest per capita personal income at $72,271 but it had the lowest percent change between 2018 and 2019 at 2.7 percent.  Wayne County had the lowest per capital personal income at $44,512 with the percent change from the year prior being 3.3 percent. St. Clair County had the lowest percent change in per capita income between 2018 and 2019 and 2.7 percent; its per capita personal income in 2019 was $45,662.

When examining personal income growth between 2017-18 and 2018-19 the percent change was lowest for the most recent year of data, as opposed to the growth from between 2017-18.

We have yet to know what the impact COVID will have on personal income for 2020, but the data below does show that growth was already beginning to slow down prior to the pandemic. That coupled with higher rates of unemployment, business closures and decreases in spending on goods and services may very well mean lower personal incomes for 2020.

The automobile industry continues to be a driving force in Michigan’s economy and the latest data on vehicle sales show that the number of auto sales for lightweight vehicles has been steadily increasing in recent months while light truck and car sales slightly declined in February of 2021. However, compared to a year ago, sales still remain below what they were. In February of 2021 auto sales for: sales of light weight vehicles were 16.5 million, compared to 16.8 million the year prior; light truck sales were 12.3 million compared to 12.5 million in February of 2020; car sales were 3.4 million, compared to 4.2 million the year prior.

Below shows the consumption expenditures of goods in the U.S. between 2019 and 2021. According to the U.S. Bureau of Economic Analysis, durable goods have an average useful life of at least 3 years (e.g. motor vehicles) while nondurable goods have an average useful life of less than 3 years (e.g. food) and services are commodities that cannot be stored or inventoried and are consumed at the time of purchase (e.g., dining out). The chart below shows how services have yet to make it back to the pre-COVID consumption levels, but the consumption of durable and non-durable goods have risen. In January of 2021 $8,016 billion in services was consumed, $2,148 billion in goods was consumed and $3,206 billion in nondurable goods was consumed.

According to the Case-Shiller Home Price Index, the average price of single-family dwellings sold in Metro Detroit was $139,240 in November of 2020; this was $145 higher than the average family dwelling price in October. The November 2020 price was an increase of $11,770 from November of 2019 and $15,200 from November of 2018. So, just as unemployment rates remain higher than what they were a year ago so do average home prices. This is interesting though because with higher unemployment rates traditionally comes lower incomes and hesitation around the housing market. However, during the COVID-19 pandemic, as shown, the average price for a home has been increasing despite higher unemployment rates. Demand for existing homes has been up substantially across the nation over the last year

COVID Continues to Impact Michigan Economy

The COVID-19 pandemic continues to have an impact on the national, statewide and local economy. This will most certainly continue as new daily case numbers continue to rise. On Nov. 9, 2020 the State of Michigan reported 216,804 confirmed COVID cases, between Nov. 7 and Nov. 8 the Michigan Department of Health and Human Services estimated that was an average of 4,505 new COVID cases a day. Although Gov. Gretchen Whitmer does not have the executive powers she once did, the Michigan Department of Health and Human Services, and other agencies, have the ability to institute certain mandates. Currently, several—but certainly not all — businesses remain open, but scrutiny on safety precautions to slow the spread is increasing.

Current unemployment rates are discussed in this post to show one facet of the economic impact the pandemic has had on the economy. In future posts we will continue to dig into the other economic impacts of the virus, and also how local governments have fared with federal and state aide.

In September of 2020 the unemployment rates for the State of Michigan and for the City of Detroit declined from recent record highs as a result of COVID-19. However, unemployment rates remain higher now than at this time last year. The State of Michigan reported an unemployment rate of 8.2 in September, a lower rate than what was reported in August, which was 8.9. The State unemployment rate for September of 2019 was 3.5. In September of 2008, when the Great Recession was just getting underway, the unemployment rate was 8.4 percent.

For the City of Detroit, the unemployment rate for September of 2020 was 20.4, which is only slightly lower than the August rate of 20.9. In September of 2019 the unemployment rate was 8.1.

The data above shows a story that we are all familiar with now, the pandemic has had a direct affect on our economy locally and statewide. Another image the data highlights though is that the unemployment gap between the State and Detroit has grown wider since the pandemic hit. Federal Reserve Chairman Jerome Powell was recently quoted in the Detroit Free Press saying women, minorities and low-income workers are suffering the most in this downturn. Detroit is home to the largest black population in the state and also has among the highest percentage of residents who live at or below the poverty level.

The chart below displays the unemployment rates for each of the seven counties in Southeastern Michigan for September of 2019 and 2020. In September of 2020 Wayne County had the highest unemployment rate at 12.5. Washtenaw County had the lowest unemployment rate at 5. Each county though had a higher unemployment rate in September of this year compared to September of 2019. Just as Wayne County had the highest unemployment rate it also had the largest increase between 2019 and 2020; in that year it increased 7.1 points. Washtenaw County had the lowest increase at 1.7 points.

In addition to COVID impact employment rates, it has also impacted the housing stock and sale and rental rates. According to a recent Detroit Free Press article, housing prices continue to increase due a high demand but low stock of homes, low mortgage rates and also the fact that the early shutdown of the economy pushed the spring home selling season farther out into summer and now fall.

The chart below shows the Standard and Poor’s Case-Shiller Home Price Index for the Detroit Metropolitan Statistical Area. The index includes the price for homes that have sold but does not include the price of new home construction, condos, or homes that have been remodeled. While it does show an increase in average home prices, it has yet to reflect those of late summer and early fall.

According to the index, the average price of single-family dwellings sold in Metro Detroit was $132,460 in July of 2020; this was $131 higher than the average family dwelling price in June. The July 2020 price was an increase of $3,240 from July of 2019.