Overall cancer rates declined across all counties in Southeastern Michigan in the last decade. Cancer rates also declined for nearly all major categories—breast, colon/rectal, lung/bronchial and prostrate—in most counties. The category “all other sites” of cancer, however, increased between the 1998-2002 period and the 2008-2012 period for four of seven counties. These counties were Livingston, Macomb, Washtenaw and Wayne.
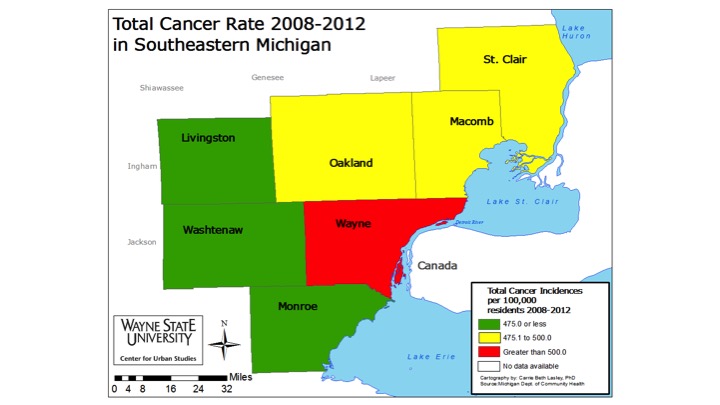

For the total average cancer incidence rates per 100,000 people Monroe County had the largest decrease at nearly 100 between 1998 and 2012; the 1998-2002 average was 478.6 and the 2008-2012 average was 378.8. Oakland and St. Clair counties had similar rate decreases (73.8 and 84.1, respectively) between that time. For the 1998-2002 average Oakland County’s overall cancer incidence rate was 565.9, and St. Clair County’s rate for this time was 581. For the 2008-2012 averages, Oakland County posted a rate of 492.1 and St. Clair County posted a rate of 496.9.
From 477.6 to 471.9, Washtenaw County had the lowest decrease at 5.7. It was Livingston County that had the lowest average rate for 2008-2012 at 441.1 per 100,000 people; Livingston County’s average rate for 1998-2002 was 451.5.
For Wayne County, the average cancer incidence rate per 100,000 people was 568.2 for 1998-2002 and 525.5 for the 2008-2012 average.
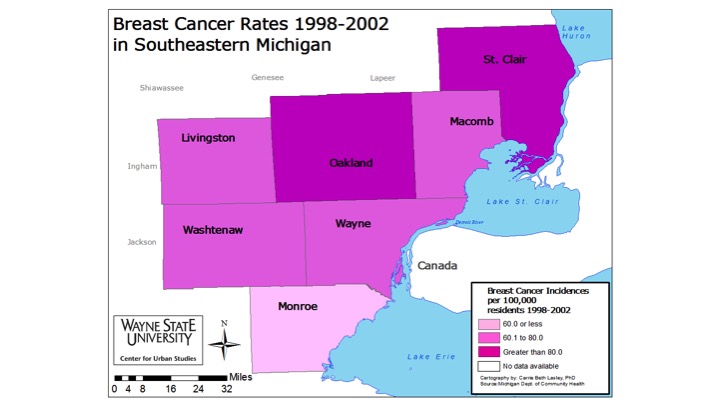
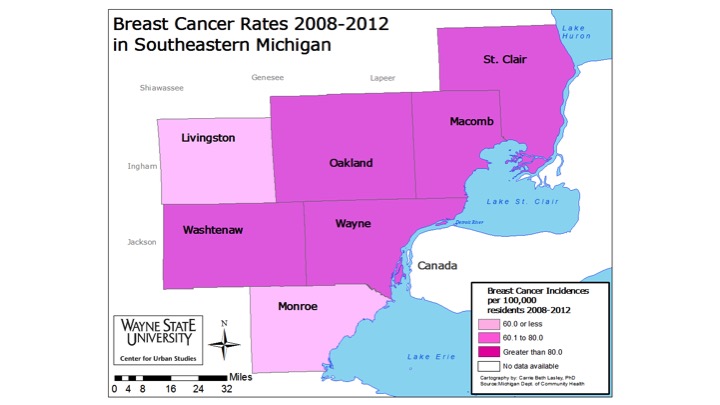
Livingston, St. Clair and Oakland counties all experienced a decrease in their average breast cancer rates between 1998 and 2012. From 1998-2002 Oakland and St. Clair counties had the highest breast cancer rates with Oakland County reporting a breast cancer rate of 84.6, and St. Clair County a rate of 83.7. St. Clair County had the largest decrease from the 1998-2002 to 2008-2012 average; the rate dropped 20.4 points, from 83.7 to 63.3.
Washtenaw County only experienced a 2 point decrease across those two time periods; it had the highest average rate for the 2008-2012 time period of 73.1.
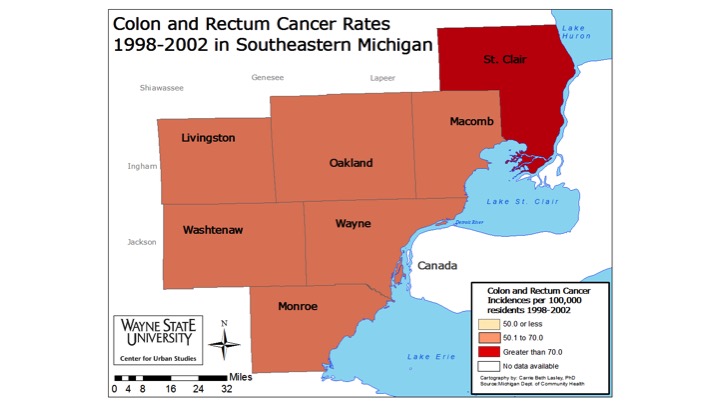
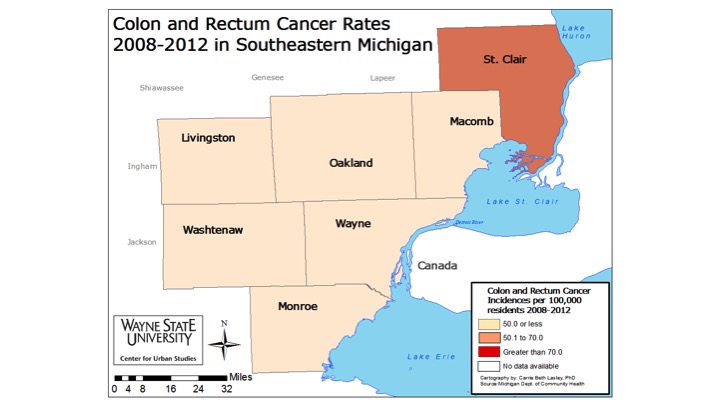
Average colon and rectum cancer incidence rates throughout the seven county region decreased between 1998 and 2012, with Monroe County posting the largest rate decrease. For the 1998-2002 average rate per 100,000 people Monroe County’s average incidence rate was 60.2, and for the 2008-2012 average the rate per 100,000 people was 35.8; the overall decrease was 24.4. For the 2008-2012 period St. Clair County had the highest average rate per 100,000 people at 51.6, though it had experienced a very substantial reduction from 74.2 in the 1998-2002 period.
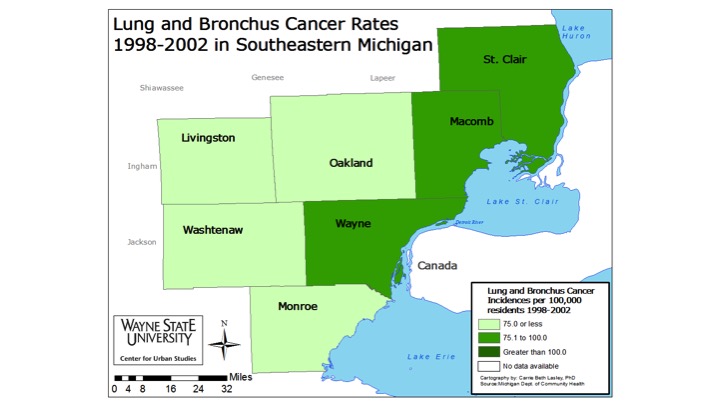
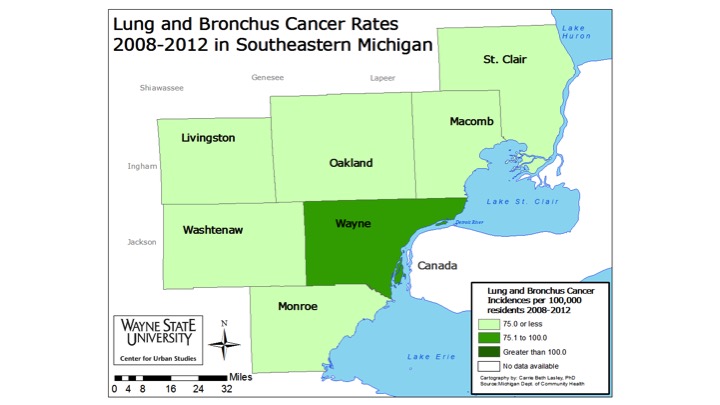
Lung and bronchus average cancer incidence rates in all seven counties decreased between 1998 and 2012, with St. Clair County experiencing the largest decrease at 17.3, from 90.1 to 72.8. Wayne County had the highest rate at 82.9 for 2008-2012, compared to 90.1 for 1998-2002.
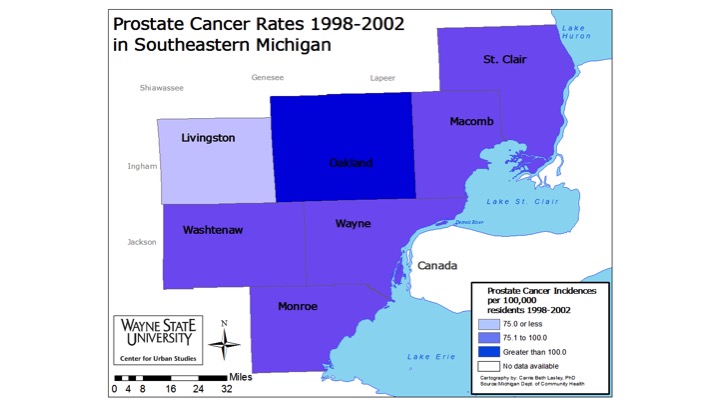
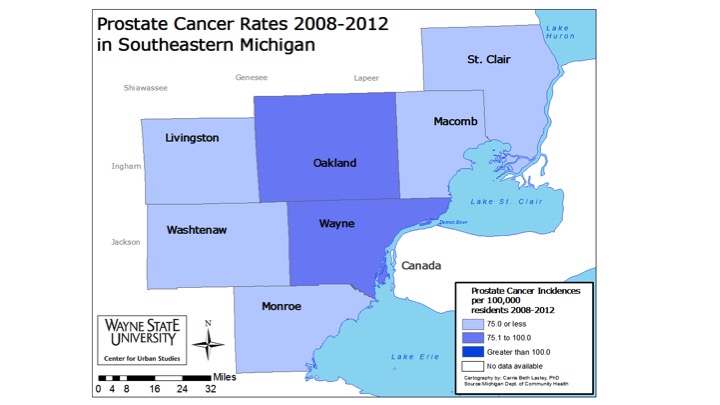
Monroe County had the largest average prostate cancer incidence rate decrease per 100,000 between 1998 and 2012 of 36.1; the 1998-2002 rate was 76.7 and the 2008-2012 rate was 40.6. Oakland County also experienced a large rate decrease from the 1998-2002 average to the 2008-2012 average; the Oakland County rates went from 104.7 to 79.4. Despite the 25.3 average rate decrease Oakland County’s average prostate rate remained the highest in the region for 2008-2012 at 79.4.
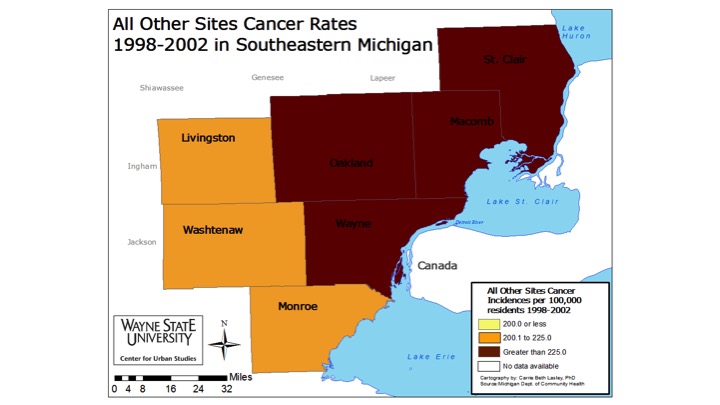
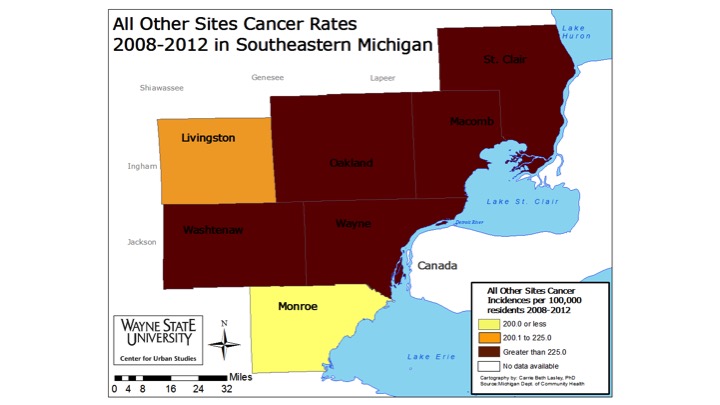
When looking at all other average cancer incidence rates for the region four of the seven counties experienced rate increases per 100,000 people. Those four counties were Livingston, Macomb, Washtenaw and Wayne counties. Washtenaw County had the largest average rate increase at 15.1 per 100,000 between 1998 and 2012, from 216.4 to 231.5. Monroe County had the largest average incidence rate decrease between 1998 and 2012 at 22. Monroe County’s 2008-2012 average rate was 185.4, the lowest rate in the region, and its 1998-2002 rate was 207.4. Overall, Macomb County had the highest average incidence rate for 2008 to 2012 at 246.4; its 1998-2002 rate was 241.7.