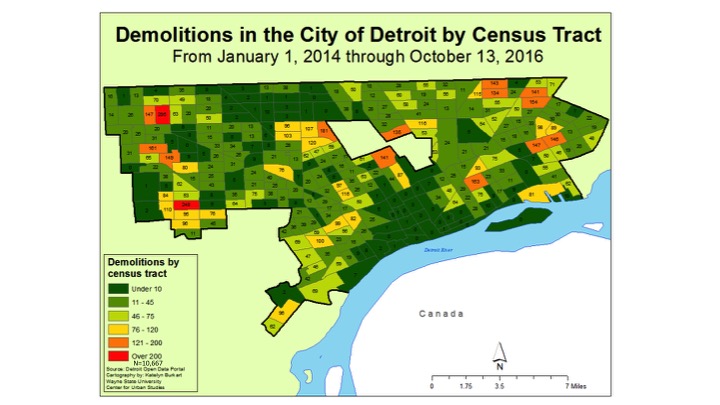
Since January 1, 2014 the City of Detroit reports on its Demolition Program webpage that there have been 10,667 demolitions of vacant buildings as part of its blight removal program, as shown in the maps below. These demolitions were made possible through the Detroit Demolition Program, which receives federal funding to aid in the removal of blight. Just last week it was announced the U.S. Department of Treasury released an additional $42 million in funds to support the program. However, that funding, and the program, was suspended from August through just a few weeks ago while the U.S. Department of Treasury and the Michigan State Housing and Development Authority worked to create new guidelines for the demolition program. These guidelines create greater oversight by limiting the number of houses in a bid package, requiring more transparency in what subcontractors are used and having state employees working in the Detroit Land Bank and Building Authority offices, according to the Detroit News.
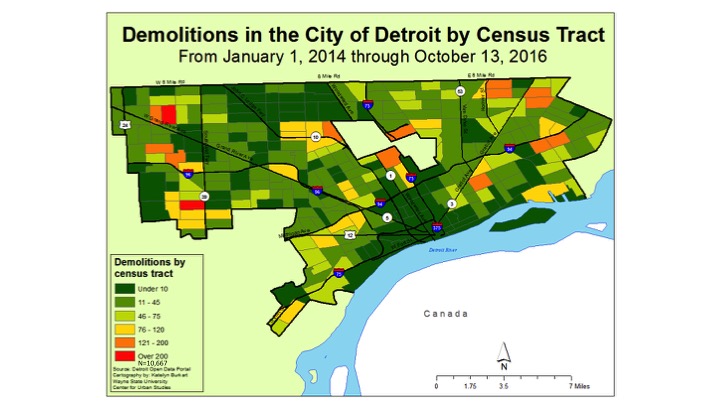
According to the City of Detroit’s demolition project page, there are 2,459 structures in the demolition pipeline, meaning they are scheduled to be demolished in the near future, and 3,096 that have already been demolished in 2016. The first two maps below show the 10,667 demolitions that have occurred in the City, by Census Tract, since January 1, 2014. The data used to create those two maps was provided from the City of Detroit’s Open Data Portal.
The third map shows vacancies in the City of Detroit, as reported by the U.S. Postal Service.
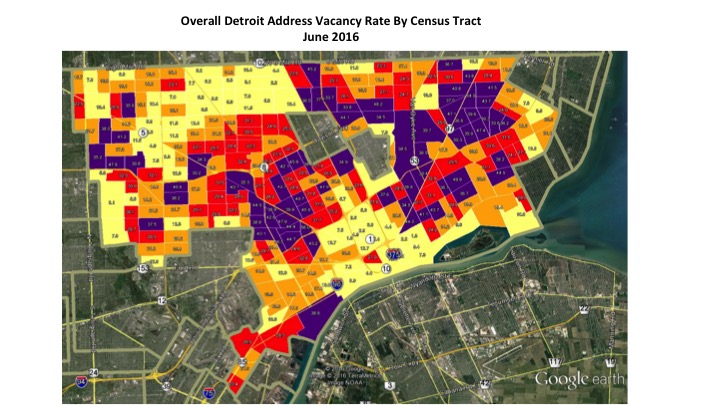
The first two maps above illustrate how certain areas of the City experience much lower rates of demolition than others. The third map shows what the vacancy rates were in the City of Detroit as of June 2016. In comparing the first two maps with the third we are able to identify discrepancies there are between where demolitions are occurring and where vacancy rates are the highest.
When examining the first two maps we see on the City’s northwest side (in the Evergreen/Rosedale area), within one Census Tract there were 295 demolitions between January 1, 2014 and October 13, 2016. The third map shows that as of June 2016 there was a 35.9 percent vacancy rate in that Census Tract, according to the U.S. Postal Service. There was only one other Census Tract in the City that had more than 200 demolitions. This Census Tract was located in the Cody/Rouge area on the west side of the City. This Census Tract had a vacancy rate of 37.5 percent in June of 2016, according to the U.S. Postal Service.
The Census Tract with the highest vacancy rate in June of 2016 is just east of Groesbeck Avenue (M-97); it had a vacancy rate of 50.3. However, according to the demolition data there have only been 15 demolitions in that Census Tract since January 1, 2014. Overall, this pocket of the City (northeastern area of the City along M-97) had vacancy rates ranging between 38 and 51 percent while the number of demolitions per Census Tract, in general, ranged between 15 and 54. There were exceptions, such as the two neighboring Census Tracts just east of I-94 where the vacancy rates were 33.6 percent and 31.6 percent and the number of demolitions in both areas were among the highest in the City, 147 and 145 respectively.
Areas in the City with among the lowest vacancy and demolition rates are Midtown, Downtown and Corktown. Also, Midtown and Downtown have some of the City’s newest housing units. Other areas in the City with the lowest demolition numbers are located on and around the Woodward Corridor, both north and south of Highland Park. The Palmer Park area, and the neighborhood to the west had several Census Tract where there were less than 10 demolitions in the time frame mapped. This area, in general, also had lower residential vacancy rates in June of 2016, ranging between 6 and 15 percent by Census Tract.
Near the Woodward Corridor though there are three Census Tracts, all of which border Highland Park, that had between 121-200 demolitions with vacancy rates for those three Census Tracts ranging between 20 and 35.
While a great deal of blight removal has already occurred in the City, there is still plenty of work to do. According to the City’s website, the goal is to remove 40,000 blighted properties within an eight year time frame. This post shows certain areas where there have been high rates of demolition in areas with high vacancy rates. However, this post also shows the opposite-Census Tracts with high vacancy rates and low demolition numbers. As the City moves forward with reaching is 40,000 structure demolition goal vacancy rates should continuously be monitored to help determine demolition priorities.