In the City of Detroit in September 2016 the total percentage of vacancies was 21.9 percent, according to the U.S. Postal Service. This vacancy percentage was nearly unchanged from the 22 percent total vacancy rate the U.S. Postal Service reported in June of 2016. Similarly, when looking at the percentage of residential vacancies and business vacancies in the City these too nearly went unchanged between June and September. The U.S. Postal Service reports that the September 2016 residential vacancy rate was 22.4, down 0.1 percent. The September 2016 business vacancy rate was 25.9, up .02 percent from June.
Overall, in the month of September there were 87,762 reported total vacancies, 80,002 of which were residential, 7,670 of which were businesses and 104 of which were considered “other.” Between June and September, the total 0.1 percent vacancy decrease was equivalent to a decrease of 579 vacant addresses; there was a decrease of 641 vacant residential addresses and an increase of 62 vacant business addresses.
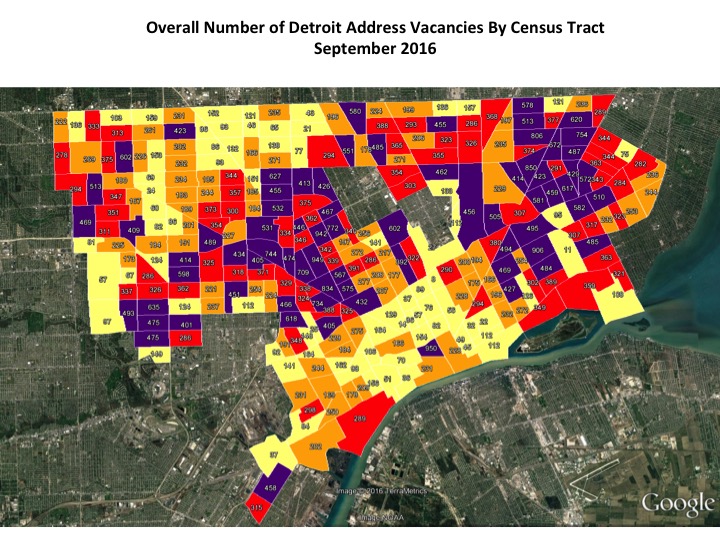
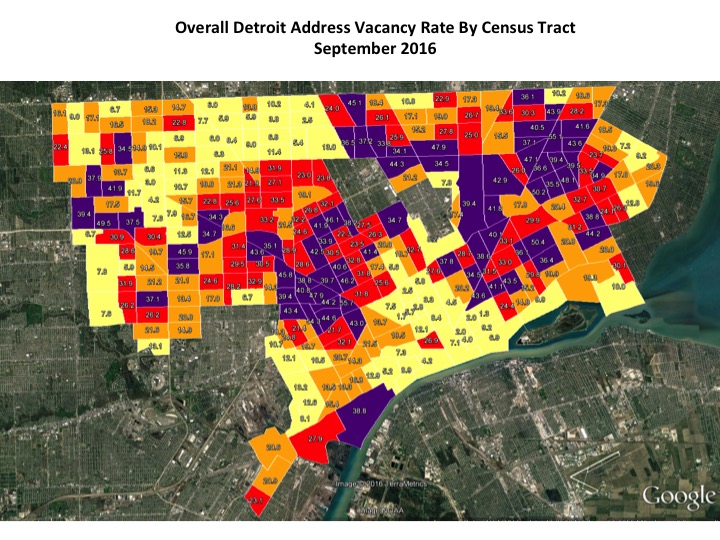
The first two maps below show, by Census Tract, the total number of vacancies and the total percentage of vacancies. The Census Tract with the highest number of total vacancies is on the east side, just north of Belle Isle. This Census Tract had 906 vacancies, which was 50.6 percent of the total number of structures in that Census Tract.
As the first map shows, majority of the Census Tracts with vacancies above 400 were located either on the cities east side, or just west of the downtown area of Detroit. When looking at the total percentage of vacancies in Detroit by Census Tract we see there is a slight shift in which Census Tracts have among the highest amount of vacancies in terms of percentage versus total numbers. This is directly related to the total number of structures in each Census Tract. For example, just east of Hamtramck there is a Census Tract with 229 vacant addresses, a number that does not put in amongst the Census Tracts with the highest vacancy numbers. However, these 229 vacant addresses in that Census Tract mean there is a 42.9 percent vacancy rate. Just south of that Census Tract is another where there are 307 vacancies which make up 18 percent of the structures there.
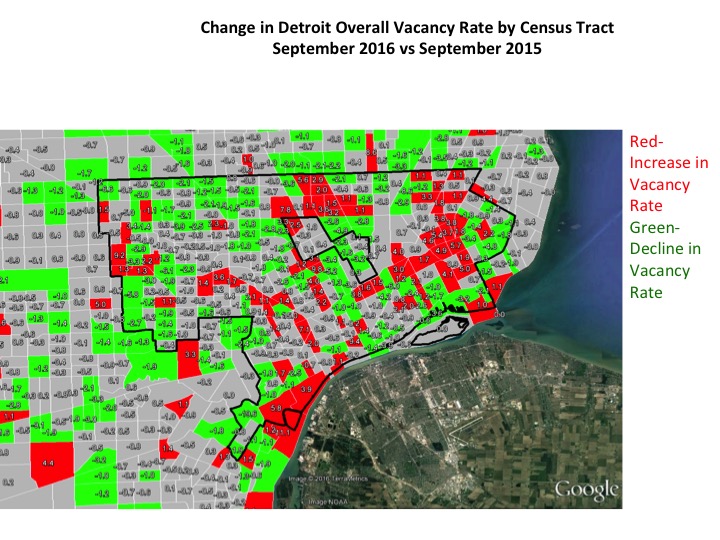
When comparing the total number of vacancies between September 2015 and 2016 we see that there are several Census Tracts that experienced an increase in the total number of vacancies. It was a Census Tract just north of Highland Park that experienced the greatest increase at 7.8 percent. Vacancy increases over the last year occurred the most on the City’s east side, however they were not isolated there.
Overall, while there were Census Tracts with vacancy rate increases there was a total decrease of 5,446 vacant addresses between September 2015 and September 2016.
In addition to these changes, in September of 2016 there was a decline in the number of “no stat” addresses; that number decreased by 2084 in the last year. Mail carriers denote properties as being either “vacant” or “no-stat.” Carriers on urban routes mark a property as vacant once no resident has collected mail for 90 days. Addresses are classified as “no-stat” for a variety of reasons. Addresses in rural areas that appear to be vacant for 90 days are labeled no-stat, as are addresses for properties that are still under construction. Urban addresses are labeled as no-stat when the carrier decides it is unlikely to be occupied again any time soon — meaning that both areas where property is changing to other uses and areas of severe decline may have no-stat addresses.