The map below is one of the most striking we have produced recently in that it shows the clear concentration of higher income households moving into a relatively narrow range of neighborhoods near Downtown, east along Jefferson and north along Woodward.
It also shows that, with a few exceptions, many of the highest median income Census Tracts in the City of Detroit have amongst the newest homeowners. For example, majority of the Census Tracts along the Detroit River and bordering the Downtown and newer developed areas in the City have median incomes between about $69,000 and $132,000, and the average year of property purchase ranges between 2003 and 2012. The data used in this post is from the 2016 American Community Survey, thus these higher income tracts have an average length of residency between four and 13 years. In the map below, which highlights the average length of homeownership and median income, the earliest average year of homeownership for any one Census Tract is 1980.
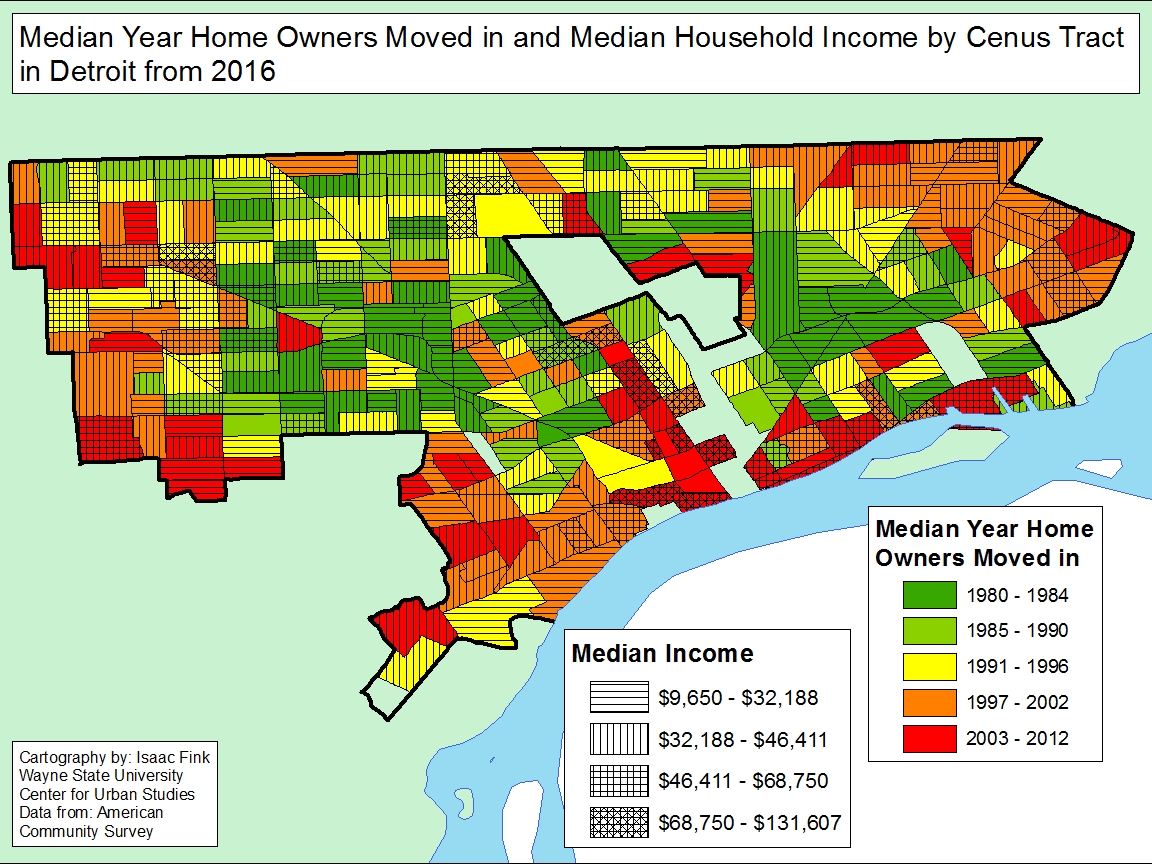
Throughout the City’s most eastern and western Census Tracts the median incomes range between about $10,000 and $46,000, the lower two income brackets on the map, but the range of median move in date of homeowners is wide. For example, on the most western side of Detroit, average year of homeowner residency ranges between 1997 and 2012, with the average median income being between about $32,000 and $46,000. As you move further east, toward the central area of the City, the average length of homeownership increases and the average median income, those being in the lower half of the overall range, remains the same. There are of course some exceptions. For example, in the Palmer Park area the average median income ranges between about $70,000 and $132,000 in the Census Tracts and the average year in which a homeowner purchased a property ranges between 1991 and 1996. In Southwest Detroit, homeowners, on average, purchased their properties in 1991 or later, and the majority of the Census Tracts in that area have homeowners with median incomes ranging between $32,000 and $46,000. The Corktown Census Tract does have the same average length of homeownership, but the residents there tend to have higher incomes. Moving east beyond the central area of the Detroit we see similar patterns to the western area of the City. The longest average length of homeownership is located farther from the eastern border of the City, and the most eastern Census Tracts have some of the most recent average years of purchase.
The overall message of the homeownership map is that the Census Tracts with the highest median incomes tend to have some of the City’s newest homeowners, as do some of the City’s Census Tracts with the lowest average median incomes. This paints several pictures, the first being that neighborhoods near, north and east of Downtown are attracting those with median incomes more than two times higher than the overall median income for the City of Detroit ($26,000). Another picture could be that many people with low and moderate median incomes have also had some opportunities to purchase homes, however these homes are located on the outskirts of the City. Or citizens with relatively low incomes are buying homes that were foreclosed upon in the 2008 recession. Finally, the Census Tracts with lowest longest average length of homeownership also tend to have residents with among the lowest median incomes. This could be due to the fact that these homeowners are now retired and living off of Social Security, pensions or other forms of retirement based incomes. This is consistent with our prior posts on the distribution of households receiving government and pension payments.
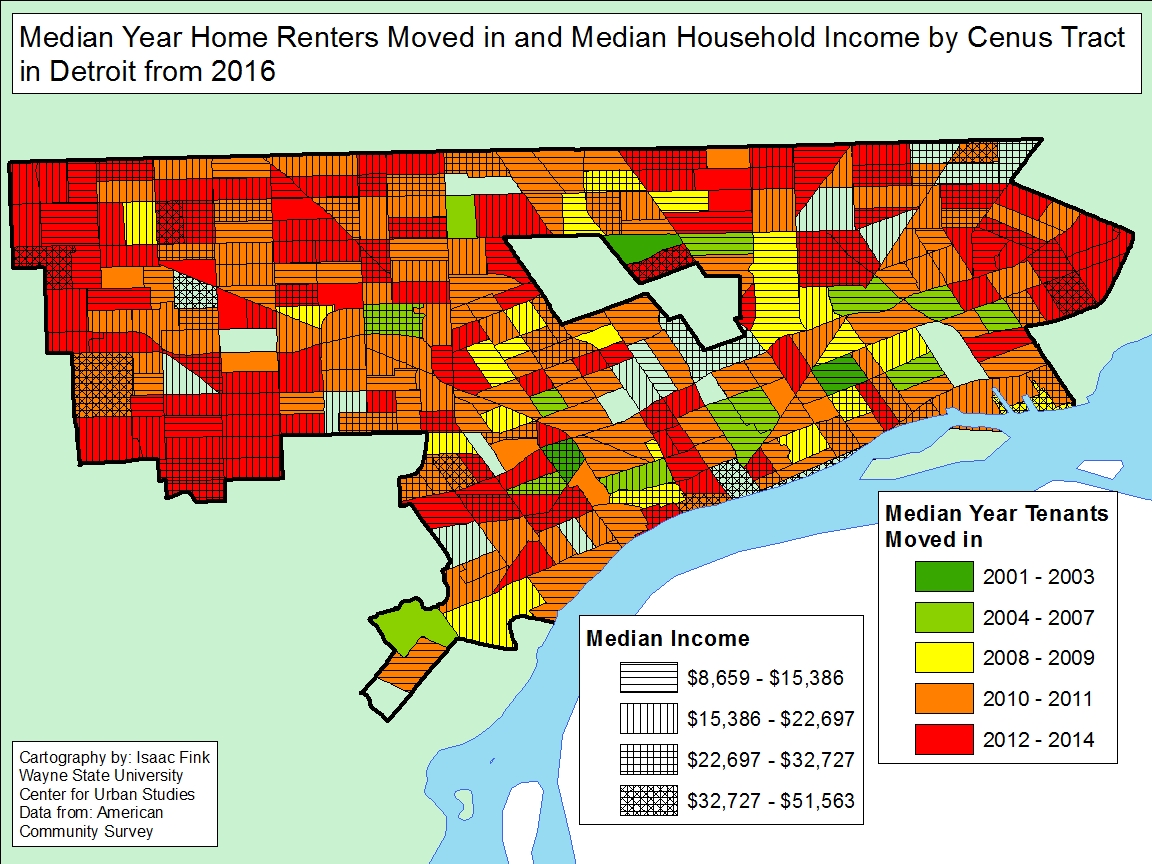
The map that displays the median income and average length of residency at a property for renters is much different than the homeownership map. As would be expected, the average length of residency for a rental tenant in a particular property is much shorter than that of a homeowner. The earliest average year of renter tenancy for a Census Tract in the City is 2001. There are only three Census Tracts in the City where the average year a renter moved into a property is between 2001 and 2003; the median incomes for these Census Tracts tops out at about $32,000. Overall, the top median income for the renter map tops out at $52,000, furthering the conversation that renters tend to have lower incomes. The west side of the City had the highest concentration of newest tenants (average length of renter tenancy ranging between 2012 and 2014) with majority of the median incomes ranging between $9,000 and $23,000.
The renter map shows that, overall, those who rent tend to have lower median incomes than those who purchase homes and also do not have a tendency to remain in one location for long periods of time.
Overall, this post highlights how those with median incomes more than double the City’s median income are purchasing properties in developing areas of Detroit. However, those with among the lowest median incomes in the City either rent and move around every few years or have owned and remained in their home for well over 30 years.