- In November unemployment rates remain stagnant at the state level, decrease in Detroit;
- Majority of Southeastern Michigan counties have higher average weekly wages than the national average;
- Housing prices continue to rise in Metro-Detroit.
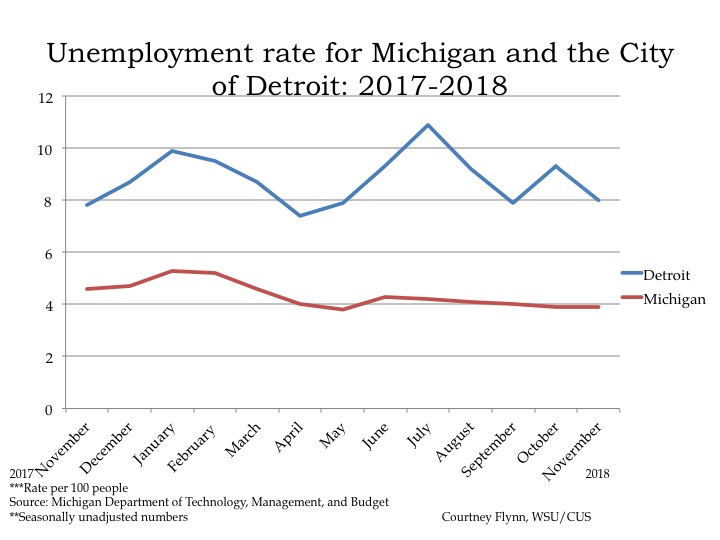
In November of 2018 the unemployment rate for the State of Michigan was 3.9, a rate that did not change from the previous month, according to the most recent data provided by the Michigan Department of Technology, Management and Budget. The State unemployment rate for November of 2017 was 0.7 points above what it was in November of 2018.
The Detroit rate was 1.3 points lower in November of 2018 from the previous month. Also, the November 2018 unemployment rate for Detroit was 0.2 points higher than what it was in November of 2017.
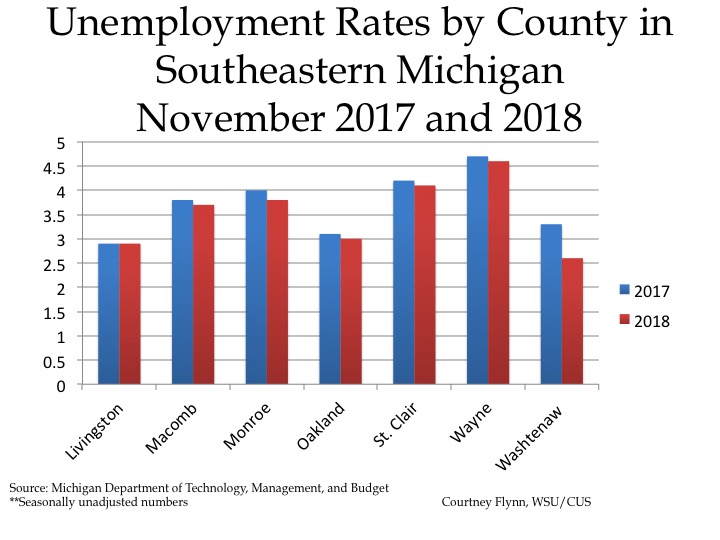
The chart above displays the unemployment rates for each of the seven counties in Southeastern Michigan for November of 2017 and 2018. All declined except for Livingston, which stayed the same. In November of 2018 Wayne County had the highest unemployment rate at 4.6, with St. Clair County having the second highest regional unemployment rate 4.1. Livingston, Oakland and Washtenaw counties were the only three in the region with unemployment rates at or below 3 in November of 2018. The unemployment rate for Livingston County was 2.9, the unemployment rate for Oakland County was 3 and the unemployment rate for Washtenaw County was 2.6.
Washtenaw County experienced the largest decline, with the November 2017 unemployment rate being 3.3 and the November 2018 unemployment rate being 2.6.
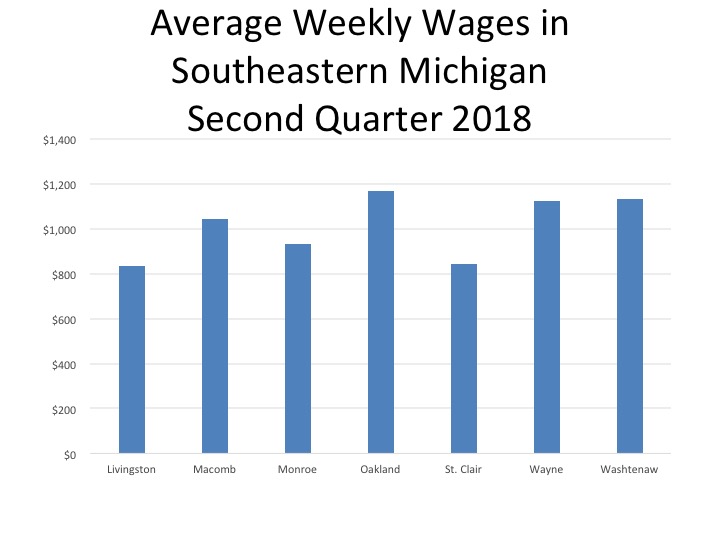
Regionally, according to the Bureau for Labor Statistics, Oakland County has the highest average weekly wages for all industries at $1,168, with Washtenaw County following closely at $1,134 and Wayne County just behind that at $1,125. The U.S. average weekly earnings were $887; St. Clair and Livingston counties are the only two in the region with average weekly earnings below the national average.
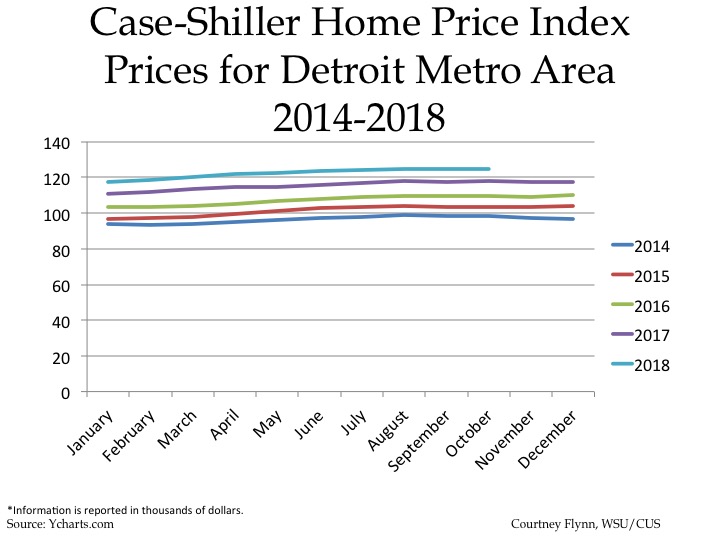
The above chart shows the Standard and Poor’s Case-Shiller Home Price Index for the Detroit Metropolitan Statistical Area. The index includes the price for homes that have sold but does not include the price of new home construction, condos, or homes that have been remodeled.
According to the index, the average price of single-family dwellings sold in Metro Detroit was $124,840 in November 2018; this was $30 lower than the average family dwelling price in October. The November 2018 price was an increase of $6,990 from November of 2017 and an increase of $15,050 from November of 2016, an increase of $21,570 from November of 2015 and increase of $26,620 from November of 2014. Note that the amount of annual increase is declining steadily.