COVID Continues to Impact Michigan Economy

The COVID-19 pandemic continues to have an impact on the national, statewide and local economy. This will most certainly continue as new daily case numbers continue to rise. On Nov. 9, 2020 the State of Michigan reported 216,804 confirmed COVID cases, between Nov. 7 and Nov. 8 the Michigan Department of Health and Human Services estimated that was an average of 4,505 new COVID cases a day. Although Gov. Gretchen Whitmer does not have the executive powers she once did, the Michigan Department of Health and Human Services, and other agencies, have the ability to institute certain mandates. Currently, several—but certainly not all — businesses remain open, but scrutiny on safety precautions to slow the spread is increasing.
Current unemployment rates are discussed in this post to show one facet of the economic impact the pandemic has had on the economy. In future posts we will continue to dig into the other economic impacts of the virus, and also how local governments have fared with federal and state aide.
In September of 2020 the unemployment rates for the State of Michigan and for the City of Detroit declined from recent record highs as a result of COVID-19. However, unemployment rates remain higher now than at this time last year. The State of Michigan reported an unemployment rate of 8.2 in September, a lower rate than what was reported in August, which was 8.9. The State unemployment rate for September of 2019 was 3.5. In September of 2008, when the Great Recession was just getting underway, the unemployment rate was 8.4 percent.

For the City of Detroit, the unemployment rate for September of 2020 was 20.4, which is only slightly lower than the August rate of 20.9. In September of 2019 the unemployment rate was 8.1.

The data above shows a story that we are all familiar with now, the pandemic has had a direct affect on our economy locally and statewide. Another image the data highlights though is that the unemployment gap between the State and Detroit has grown wider since the pandemic hit. Federal Reserve Chairman Jerome Powell was recently quoted in the Detroit Free Press saying women, minorities and low-income workers are suffering the most in this downturn. Detroit is home to the largest black population in the state and also has among the highest percentage of residents who live at or below the poverty level.

The chart below displays the unemployment rates for each of the seven counties in Southeastern Michigan for September of 2019 and 2020. In September of 2020 Wayne County had the highest unemployment rate at 12.5. Washtenaw County had the lowest unemployment rate at 5. Each county though had a higher unemployment rate in September of this year compared to September of 2019. Just as Wayne County had the highest unemployment rate it also had the largest increase between 2019 and 2020; in that year it increased 7.1 points. Washtenaw County had the lowest increase at 1.7 points.

In addition to COVID impact employment rates, it has also impacted the housing stock and sale and rental rates. According to a recent Detroit Free Press article, housing prices continue to increase due a high demand but low stock of homes, low mortgage rates and also the fact that the early shutdown of the economy pushed the spring home selling season farther out into summer and now fall.

The chart below shows the Standard and Poor’s Case-Shiller Home Price Index for the Detroit Metropolitan Statistical Area. The index includes the price for homes that have sold but does not include the price of new home construction, condos, or homes that have been remodeled. While it does show an increase in average home prices, it has yet to reflect those of late summer and early fall.

According to the index, the average price of single-family dwellings sold in Metro Detroit was $132,460 in July of 2020; this was $131 higher than the average family dwelling price in June. The July 2020 price was an increase of $3,240 from July of 2019.

Economic Indicators: Unemployment Drops in Detroit

  • In November unemployment rates remain stagnant at the state level, decrease in Detroit;
  • Majority of Southeastern Michigan counties have higher average weekly wages than the national average;
  • Housing prices continue to rise in Metro-Detroit.

In November of 2018 the unemployment rate for the State of Michigan was 3.9, a rate that did not change from the previous month, according to the most recent data provided by the Michigan Department of Technology, Management and Budget. The State unemployment rate for November of 2017 was 0.7 points above what it was in November of 2018.

The Detroit rate was 1.3 points lower in November of 2018 from the previous month. Also, the November 2018 unemployment rate for Detroit was 0.2 points higher than what it was in November of 2017.

The chart above displays the unemployment rates for each of the seven counties in Southeastern Michigan for November of 2017 and 2018. All declined except for Livingston, which stayed the same. In November of 2018 Wayne County had the highest unemployment rate at 4.6, with St. Clair County having the second highest regional unemployment rate 4.1. Livingston, Oakland and Washtenaw counties were the only three in the region with unemployment rates at or below 3 in November of 2018. The unemployment rate for Livingston County was 2.9, the unemployment rate for Oakland County was 3 and the unemployment rate for Washtenaw County was 2.6.

Washtenaw County experienced the largest decline, with the November 2017 unemployment rate being 3.3 and the November 2018 unemployment rate being 2.6.

Regionally, according to the Bureau for Labor Statistics, Oakland County has the highest average weekly wages for all industries at $1,168, with Washtenaw County following closely at $1,134 and Wayne County just behind that at $1,125. The U.S. average weekly earnings were $887; St. Clair and Livingston counties are the only two in the region with average weekly earnings below the national average.

The above chart shows the Standard and Poor’s Case-Shiller Home Price Index for the Detroit Metropolitan Statistical Area. The index includes the price for homes that have sold but does not include the price of new home construction, condos, or homes that have been remodeled.

According to the index, the average price of single-family dwellings sold in Metro Detroit was $124,840 in November 2018; this was $30 lower than the average family dwelling price in October. The November 2018 price was an increase of $6,990 from November of 2017 and an increase of $15,050 from November of 2016, an increase of $21,570 from November of 2015 and increase of $26,620 from November of 2014. Note that the amount of annual increase is declining steadily.
Detroit Housing Prices Continue to Rise

  • The State and City of Detroit’s unemployment rate increased at the monthly and annual levels;
  • Regionally, June 2018 unemployment rates are higher than the prior year, with the exception of Monroe and Washtenaw counties;
  • Housing prices continue to rise in Metro-Detroit.

In June of 2018 the unemployment rate for the State of Michigan was 4.3, an increase from the May unemployment rate of 3.8, according to the most recent data provided by the Michigan Department of Technology, Management and Budget. The State unemployment rate for June of 2017 was 0.3 points above what it was in June of 2018.

The Detroit rate was 1.4 points higher in June of 2018 than in May. Also, the June 2018 unemployment rate for Detroit was 1.5 points higher than what it was in June of 2017.

The chart above displays the unemployment rates for each of the seven counties in Southeastern Michigan for June of 2017 and 2018. In June of 2018 Wayne County had the highest unemployment rate at 5.4, with St. Clair County having the second highest regional unemployment rate 4.6. These two counties were the only two in the region to have unemployment rates above 4.5 in June of 2018. Conversely, Oakland, Washtenaw and Livingston counties all had unemployment rates at or below 3.5 in June of 2018.

Oakland County and Livingston County were the only other two counties in the region with an unemployment rate below 3.5. Regionally, Livingston County had the lowest unemployment rate in June of 2018 at 3.3. Livingston County also had the lowest unemployment rate in June of 2017 at 3 while Wayne County had the highest unemployment rate in June of 2017 at 5.

When comparing 2017 and 2018, Monroe and Washtenaw counties are the only two where the unemployment rate was higher in 2017 than in 2018. For Monroe County, in June of 2017 the unemployment rate was 4.9 and for 2018 it was 4.4. For Washtenaw County there was also a 0.4 difference, from 3.9 in 2017 down to 3.5 in 2018.

The above chart shows the Standard and Poor’s Case-Shiller Home Price Index for the Detroit Metropolitan Statistical Area. The index includes the price for homes that have sold but does not include the price of new home construction, condos, or homes that have been remodeled.

According to the index, the average price of single-family dwellings sold in Metro Detroit was $122,600 in May 2018; this was $920 higher than the average family dwelling price in April. The May 2018 price was an increase of $7,740 from May of 2017 and an increase of $16,060 from May of 2016, an increase of $21,030 from May of 2015 and increase of $26,430 from May of 2014.

Poverty, Unemployment Rates Higher for Young Adults in Detroit than City’s Overall Rates

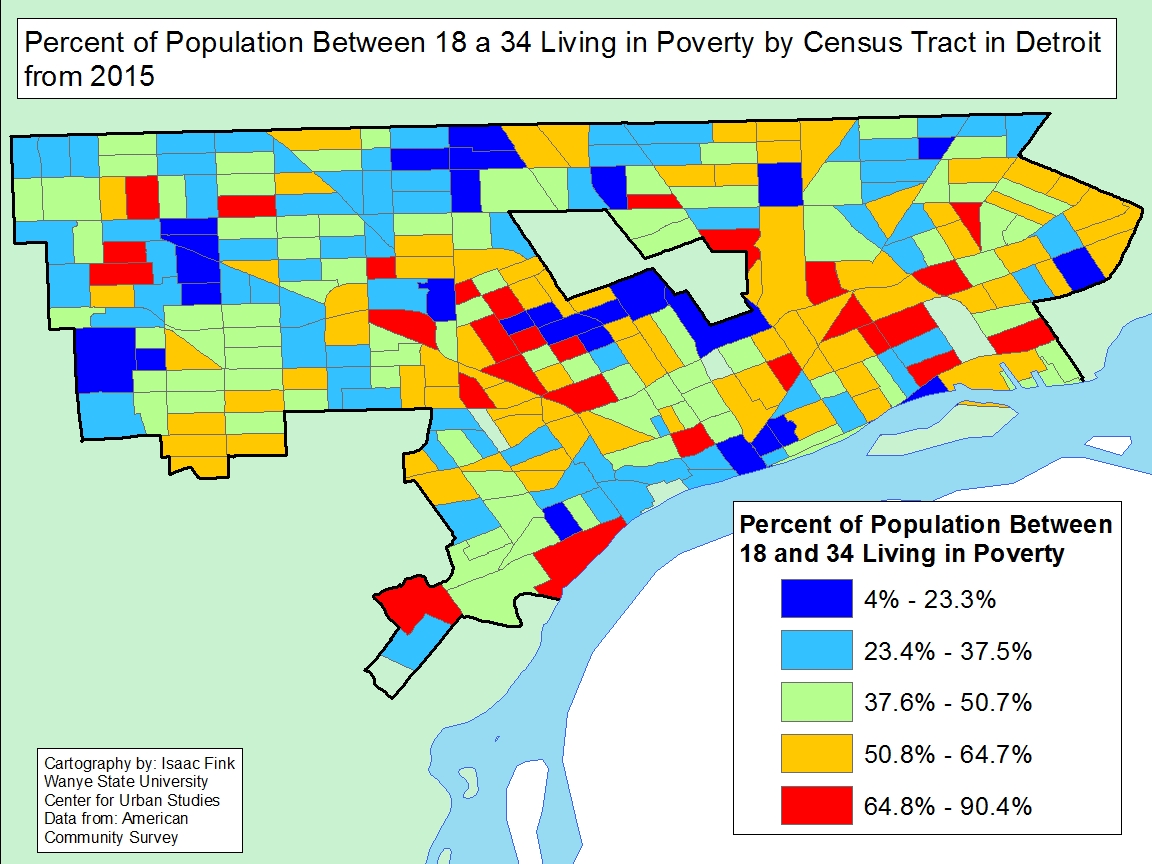
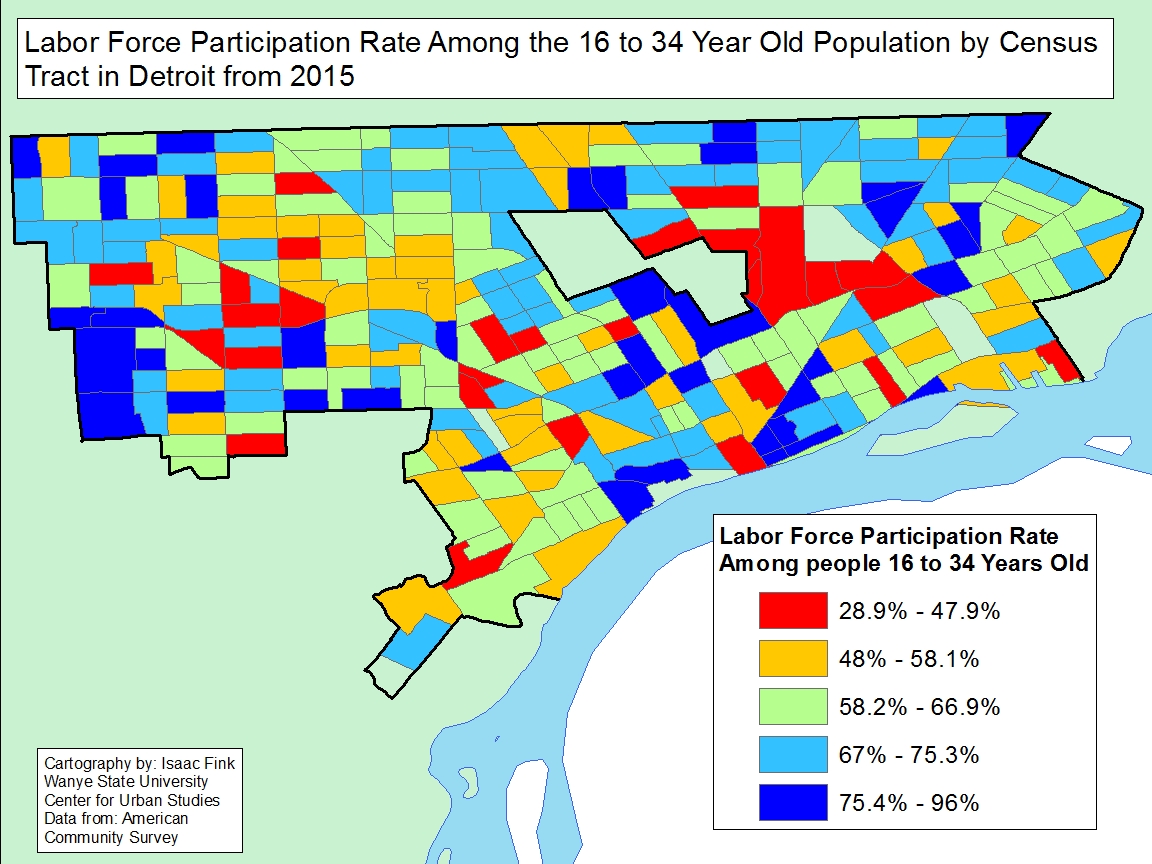
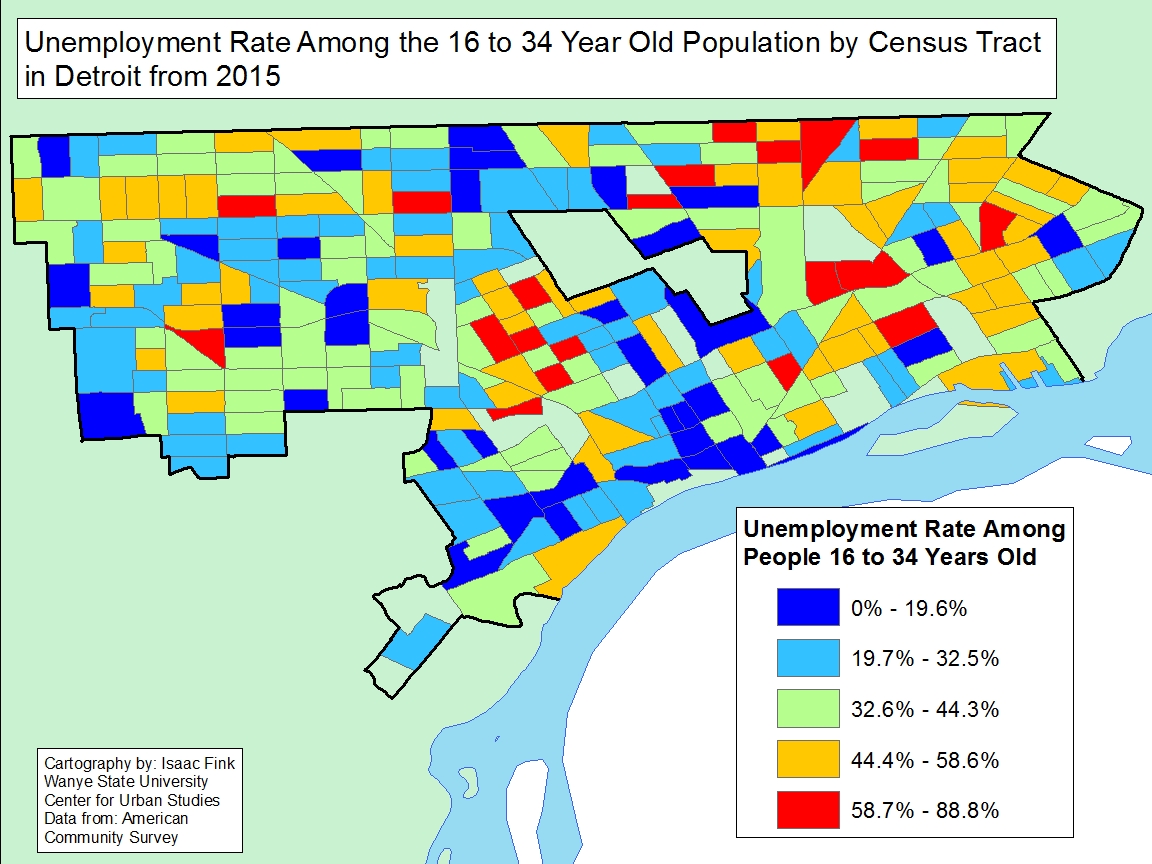
In the City of Detroit the percentage of young adults (categorized as 16 to 34-year-olds in this post) living at or below the poverty level in 2015 was 42 percent, with the labor force participation rate for that same age group being 64 percent and the unemployment rate being 35 percent. Two out of three of these rates were above those for the City of Detroit overall. In 2015 the percent of all Detroit residents (including children) living below the poverty level was 40 percent, the labor force participation rate was 63 percent and the unemployment rate was 13.2 percent.

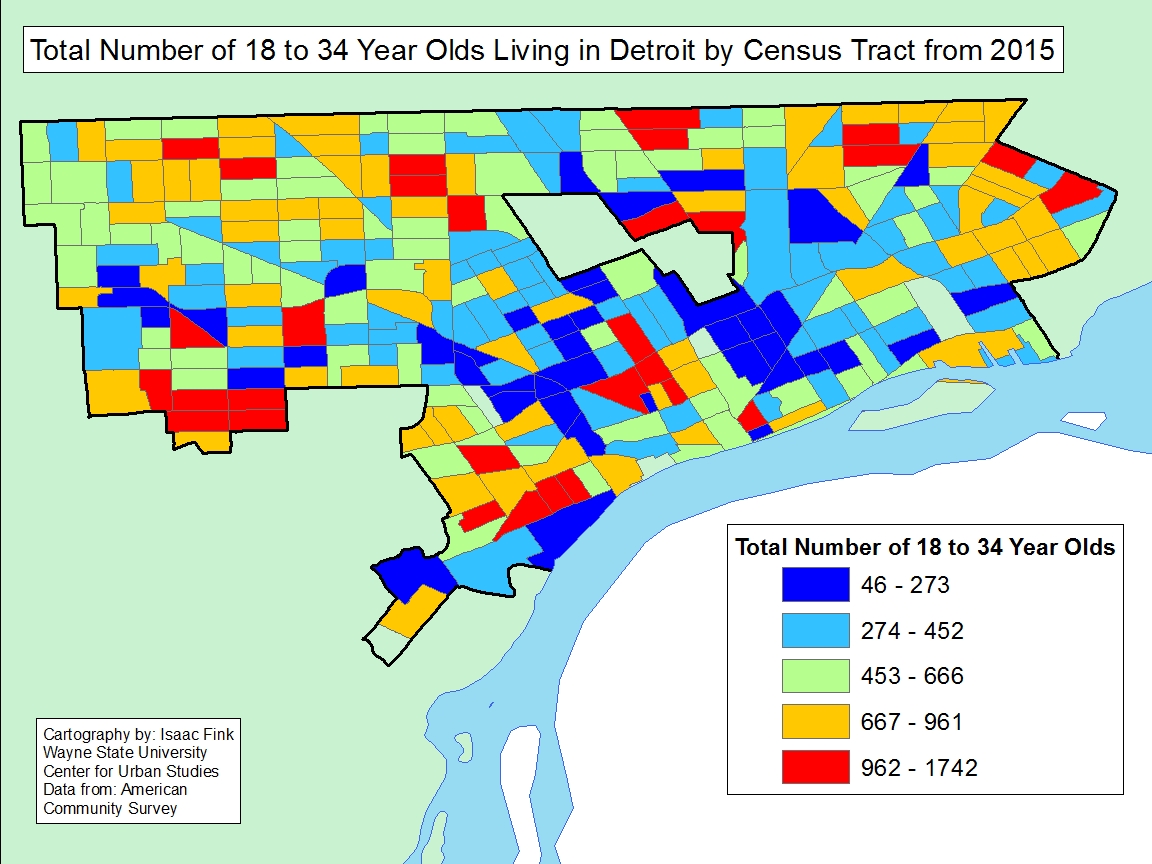
While the trend for these above mentioned rates for the young adult population was to be above the overall rates for the City, a deeper look at the rates showed they varied across Census Tracts in the City. For example, Census Tracts with the highest percentage of young adults living in poverty were along Grand River on the West Side and along Gratiot on the east side of the City. On the east side of the City, majority of the Census Tracts had between 50 and 90 percent of young adults living at or below the poverty level. Fortunately some of these same Census Tracts had among the lowest populations of young adults living there, with several having between 46 and 452 young adult residents residing in each Census Tract.

In the northeastern portion of the City, there were about a dozen Census Tracts with among the highest number of young adults living there, with numbers ranging between 667 and 1,742. These Census Tracts also had some of the highest labor force participation rates, as did a pocket in the western portion of the City of Detroit, along with several other pockets throughout the City. The tracts with the low labor force participation rates (29-48 percent) were frequently the same ones that had the highest percentage of young adults living at or below the poverty level; these Census Tracts are just east of Hamtramck. An individual is considered part of the labor force if they have a job or are actively seeking one. The labor force participation rate is the percentage of adults who are members of the labor force.

Two of these Census Tracts just east of Hamtramck also had among the highest unemployment rates for young adults, ranging between 59 and 89 percent. Overall in the City there were only 20 Census Tracts where between 59 and 89 percent of young adults were unemployed. Again, some of the tracts arrayed along Grand River on the west and Gratiot on the east had very high unemployment rates.

There are some tracts where high poverty, labor participation and unemployment rates overlap, but this is not the case for a majority of the Census tracts. At the same time the data tend to indicate a larger percentage of young adults are unemployed and, thus, living in poverty than the overall Detroit population. Clearly, getting more young adults employed must be a very high priority, and given that the national rate of unemployment is approaching 4 percent, there should be opportunities to connect these young adults to the labor market. Clearly it should be a priority to target job development and training programs to areas near Central High School along Grand River, as well as along Gratiot and in the Osborn and Demby areas.

Housing Prices Continue to Increase in Metro-Detroit

  • From March to April 2016, the unemployment rate across the state and within the city of Detroit declined (monthly);
  • The number of employed Detroit residents increased (monthly);
  • The Purchasing Manager’s Index for Southeastern Michigan increased from March to April 2016 (monthly);
  • Commodity Price Index remained stabled for Southeastern Michigan (monthly)
  • Standard and Poor’s Case-Shiller Home Price Index for the Detroit Metropolitan Statistical Area shows home prices have increased by about $10,000 since February of 2014.

Detroit Unemployment

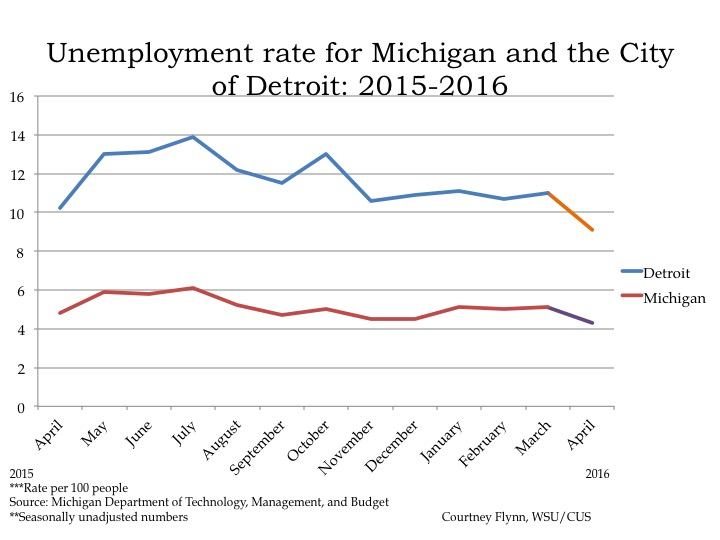
According to the most recent data provided by the Michigan Department of Technology, Management and Budget, the unemployment rate for the State of Michigan decreased to 4.3 percent in April 2016; the unemployment rate was 5.1 percent in March. During this same period, unemployment in the City of Detroit marginally increased from 11 percent in March to 9.1 percent in April.\Detroit Employment

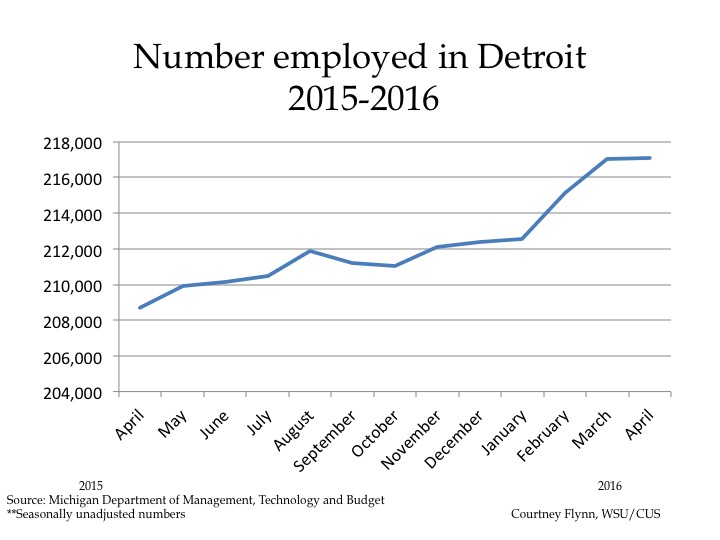
In Spring of 2016 the number of employed Detroit residents began to stabilize. In March of 2016 the number employed was 217,027 and in April of 2016 that number slightly increased to 217,078. In April of 2015 employment numbers for Detroit residents began to rise, and have since peaked.

Although the sheer number of Detroit residents employed has increased, data also shows that the Detroit labor force decreased to 238,790 in April 2016; it was 243,813 the month prior.

Auto Employment

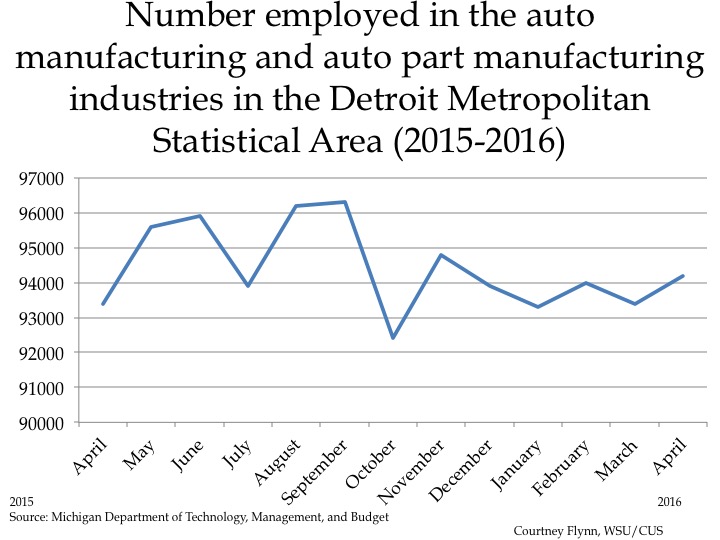
The above chart shows the number of people employed in the auto manufacturing industry in the Detroit Metropolitan Statistical Area (MSA) (Detroit-Warren-Livonia) from April 2015 to April 2016. In that time frame the number of people employed in this industry has increased by 800, from 93,400 to 94,200.

PMI

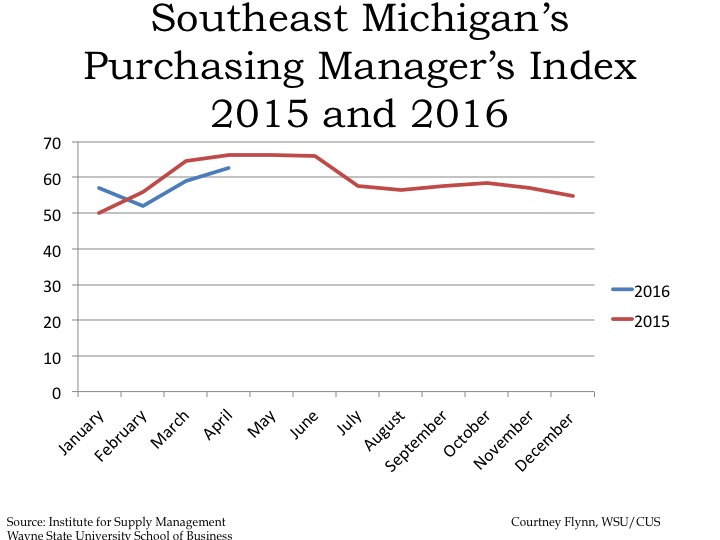
The Purchasing Manger’s Index (PMI) is a composite index derived from five indicators of economic activity: new orders, production, employment, supplier deliveries, and inventories. A PMI above 50 indicates the economy is expanding.

According to the most recent data released on Southeast Michigan’s Manager’s Index, the PMI for April 2016 was 62.7, an increase of 3.6 points from the prior month. The April 2016 PMI was a decrease of 3.7 from April of 2015.  Despite the decrease from April 2015 to April 2016, the current PMI represents a growing economy that is currently being pushed forward because of improvements in new orders, employment and production.

Commodity Price Index

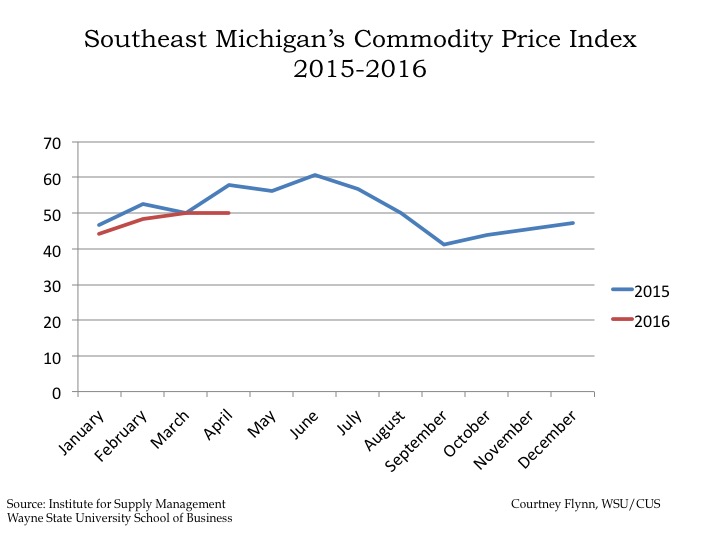
The Commodity Price Index, which is a weighted average of selected commodity prices, was recorded at 50 points in both March and April of 2016. The April 2016 Commodity Price Index is a decrease of 7.9 points from the prior year.

Detroit Home Prices

The Commodity Price Index, which is a weighted average of selected commodity prices, was recorded at 50 points in both March and April of 2016. The April 2016 Commodity Price Index is a decrease of 7.9 points from the prior year.

Employment in Detroit Growing, While Unemployment also Increased

  • From December 2015 to March 2016, the unemployment rate across the state remained stable while the city of Detroit’s experienced a slight increase (monthly);
  • Employment in the city of Detroit increased by 8,407 from March 2015 to March 2016 (monthly);
  • The Purchasing Manager’s Index for Southeastern Michigan increased from February 2016 to March 2016 (monthly);
  • Commodity Price Index increased from February 2016 to March 2016 for Southeastern Michigan (monthly)
  • Standard and Poor’s Case-Shiller Home Price Index for the Detroit Metropolitan Statistical Area shows home prices are about $6,900 higher than in January of 2015.

Detroit Unemployment

According to the most recent data provided by the Michigan Department of Technology, Management and Budget, the unemployment rate for the State of Michigan increased to 5.1 percent between December of 2015 and March of 2016. During this same period, unemployment in the City of Detroit marginally increased from 10.9 percent in December to 11 percent in March.

Detroit Employed

Since March of 2015 the number of employed Detroit residents in the labor force increased by 8,407, to a total of 217,137 in March of 2016. While the month of March in 2015 had the lowest number of Detroit residents employed in the labor force in the last year, March in 2016 has had the highest number of people employed for 2016.

The conundrum of increasing employment and increasing unemployment likely is a result of more people entering the labor market in the city, creating a situation in which more are employed, but more are also looking for work.

Detroit Manufacturing

The above chart shows the number of people employed in the auto manufacturing industry in the Detroit Metropolitan Statistical Area (MSA) (Detroit-Warren-Livonia) from March 2015 to March 2016. In that time frame the number of people employed in this industry has increased by 300, from 93,100 to 93,400.

PMI

The Purchasing Manger’s Index (PMI) is a composite index derived from five indicators of economic activity: new orders, production, employment, supplier deliveries, and inventories. A PMI above 50 indicates the economy is expanding.

According to the most recent data released on Southeast Michigan’s Manager’s Index, the PMI for March 2016 was 59.1, an increase of 7.1 point from the prior month. This increase is largely representative of the region’s employment, new order and production indexes increasing.

The March PMI was also a decrease of 5.4 from March of 2015.

Commodity Price

The Commodity Price Index, which is a weighted average of selected commodity prices, was recorded at 50 points in March 2016, which was 1.6 points higher than the previous month and exactly the same as what it was in March of 2015.

Detroit Home Price

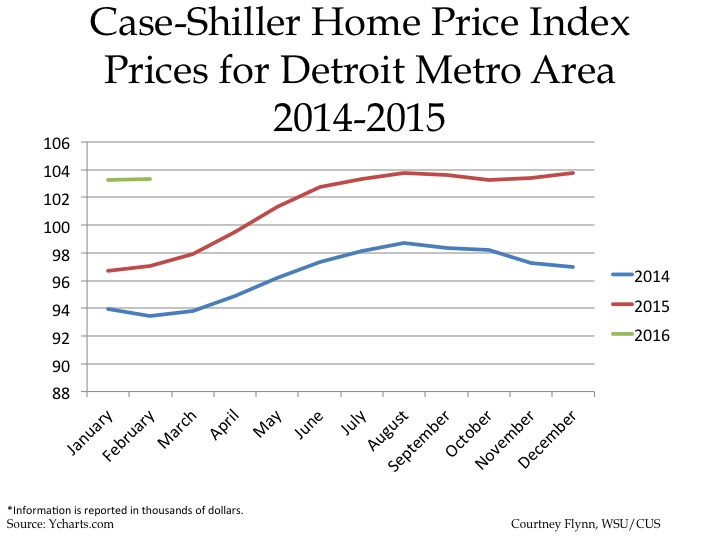
The above charts show the Standard and Poor’s Case-Shiller Home Price Index for the Detroit Metropolitan Statistical Area. The index includes the price for homes that have sold but does not include the price of new home construction, condos, or homes that have been remodeled.

According to the index, the average price of single-family dwellings sold in Metro Detroit was $103,590 in January 2016. This was an increase of $6,890 from January of 2015 and increase of $9,670 from January of 2014.

Detroit’s unemployment rate on the decline

  • From March 2015 to April 2015, the unemployment rate across the state and in the City of Detroit’s decreased (monthly);
  • The Purchasing Manager’s Index for Southeast Michigan increased from April 2015 to May 2015 (monthly);
  • Commodity Price Index decreased from April 2015 to May 2015 for Southeast Michigan (monthly);
  • Standard and Poor’s Case-Shiller Home Price Index for the Detroit Metropolitan Statistical Area continue to increase.

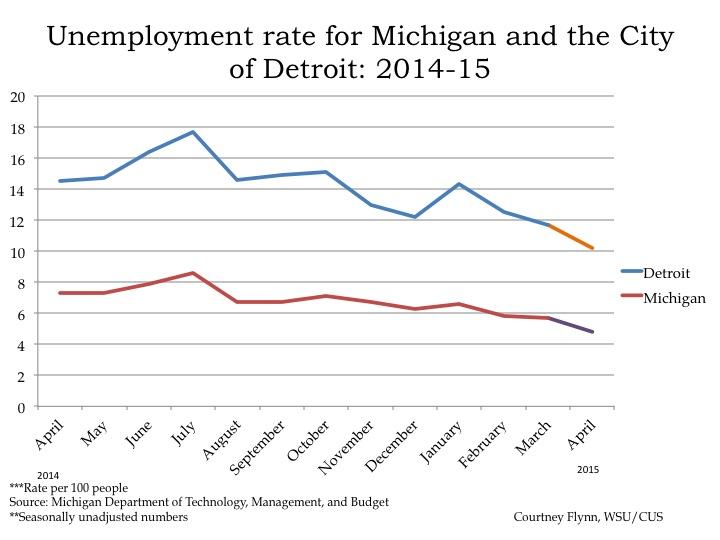
According to the most recent data provided by the Michigan Department of Technology, Management, and Budget, the unemployment rate for the state of Michigan decreased from 5.7 percent in March to 4.8 percent in April. During this same period, unemployment in the city of Detroit also decreased from 11.7 percent in March to 10.2 percent in April.

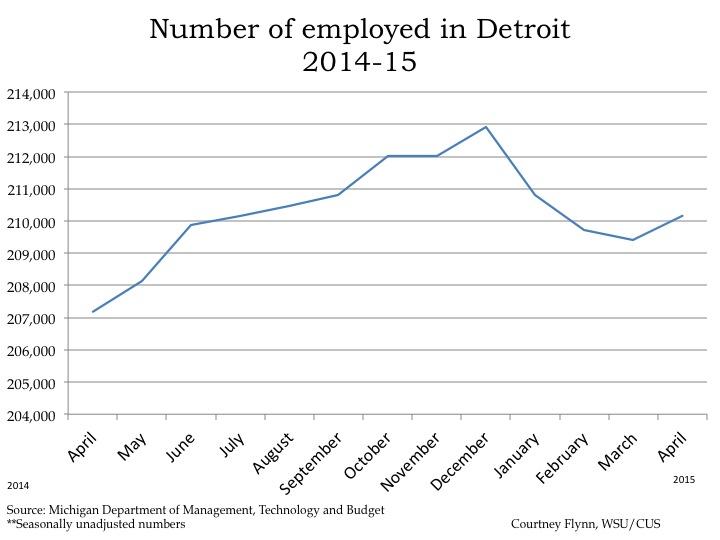
From March to April, the number of people employed in the city of Detroit increased by 744, leading to a total of 210,161 people employed in April.

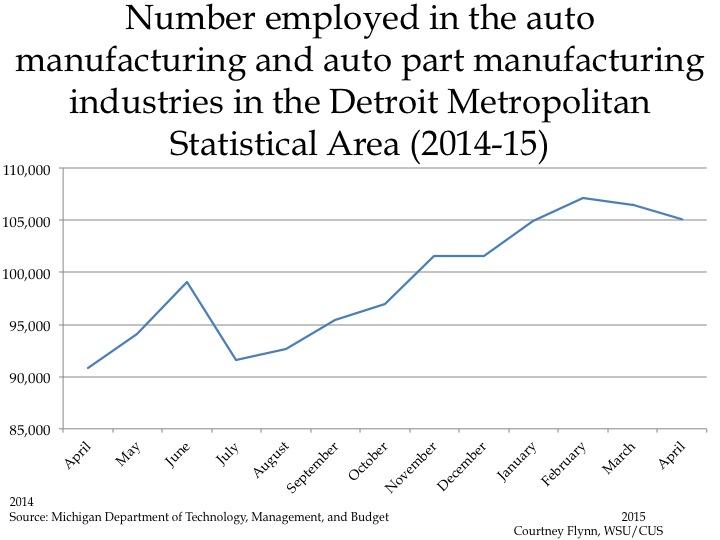
The above chart shows the number of people employed in the auto manufacturing industry in the Detroit Metropolitan Statistical Area (MSA) (Detroit-Warren-Livonia) from April 2014 to April 2015. From March to April the number of people employed in this industry declined by 1,400, to a total of 105,100. Employment in this industry in the Detroit Metropolitan Statistical Area has been decreasing since February.

The Purchasing Manger’s Index (PMI) is a composite index derived from five indicators of economic activity: new orders, production, employment, supplier deliveries, and inventories. A PMI above 50 indicates the economy is expanding.

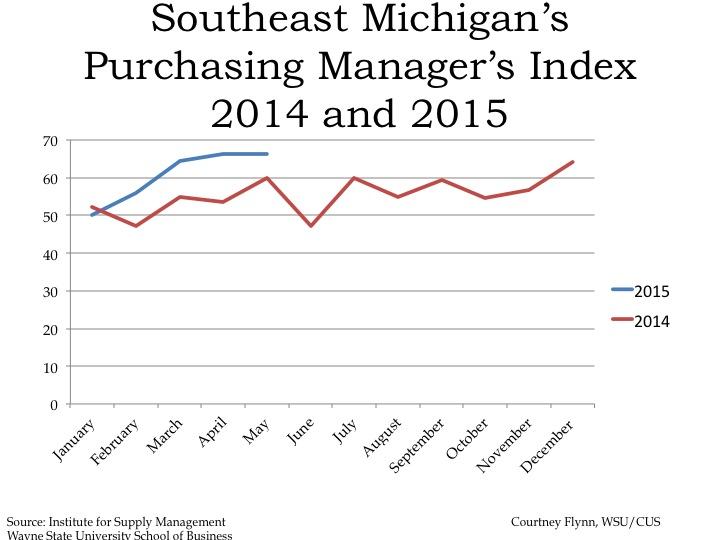
According to the most recent data released on Southeast Michigan’s Purchasing Manager’s Index, the PMI for May 2015 was 66.4, an increase of 0.1 points from the prior month. It was also an increase of 6.4 from May of 2014.

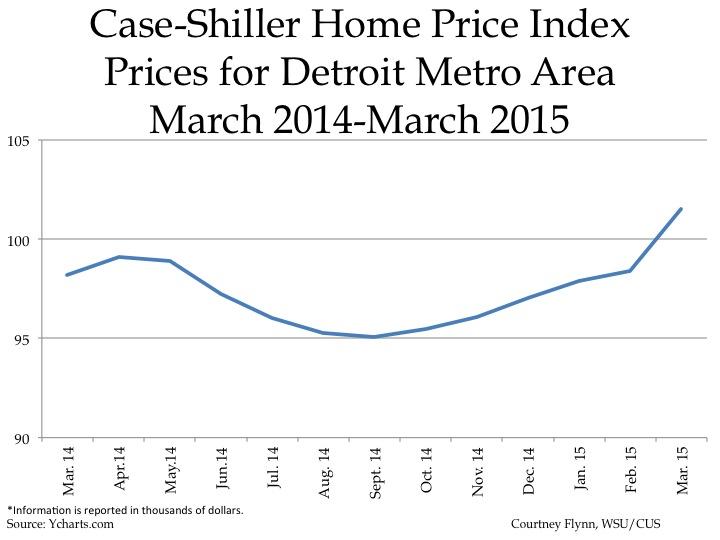
The above charts show the Standard and Poor’s Case-Shiller Home Price Index for the Detroit Metropolitan Statistical Area. The index includes the price for homes that have sold but does not include the price of new home construction, condos, or homes that have been remodeled.

According to the index, the average price of single-family dwellings sold in Metro Detroit was $101,530 in March 2015. This was an increase of approximately $3,130 from the average price in February 2015. Since March of 2014, prices have increased by $3,330.


Unemployment numbers decreased with the holiday season

  • From October 2014 to December 2014, the unemployment rate across the state and in the City of Detroit’s decreased (monthly);
  • The Purchasing Manager’s Index for Southeast Michigan increased from November 2014 to December 2014 (monthly);
  • Commodity Price Index decreased from November 2014 to December 2014 for Southeast Michigan (monthly);
  • Wayne, Macomb and Oakland counties experienced decreases in the number of monthly building permits pulled.

Slide02According to the most recent data provided by the Michigan Department of Technology, Management, and Budget, the unemployment rate for the state of Michigan decreased from 7.1 percent in October to 6.3 percent in December. During this same period, unemployment in the city of Detroit also decreased from 15.1 in October percent to 12.2 percent.

Slide04

From November to December of 2014, the number of people employed in the city of Detroit increased by 1,775, leading to a total of 287,228 people employed in December.

Slide06

The above chart shows the number of people employed in the auto manufacturing industry in the Detroit Metropolitan Statistical Area (MSA) (Detroit-Warren-Livonia) from December 2013 to December 2014. From July 2014 to November 2014 employment in this industry has increased by 9,000 from 91,600 to 100,600. However, from November to December, that number stagnated, remaining at 100,600. This was still the highest it had been over the last year.

Slide08

The Purchasing Manger’s Index (PMI) is a composite index derived from five indicators of economic activity: new orders, production, employment, supplier deliveries, and inventories. A PMI above 50 means the economy is expanding.

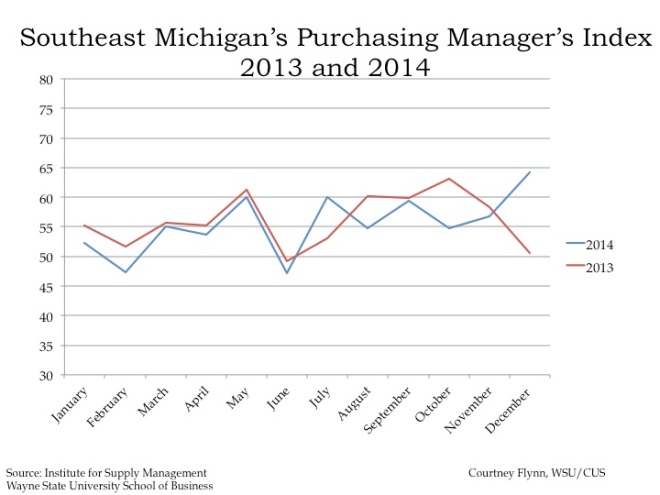
According to the most recent data released on Southeast Michigan’s Purchasing Manager’s Index, the PMI for December 2014 was 64.2, an increase of 7.4 points from the prior month. As compared to December 2013, there has been an increase of 13.6 points.

Slide10

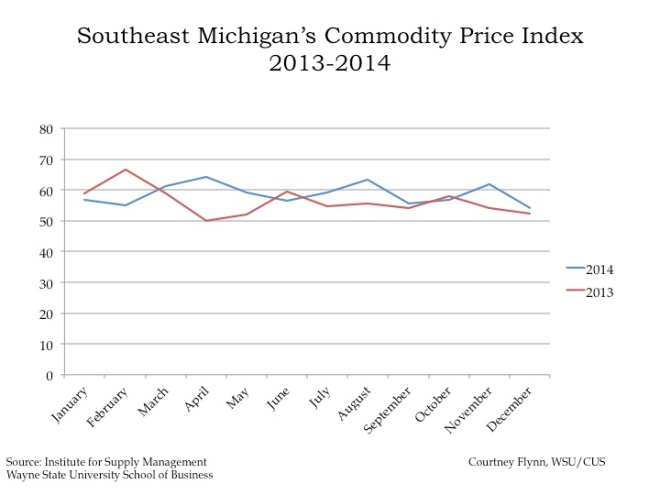
The Commodity Price Index, which is a weighted average of selected commodity prices, was recorded at 54.2 points in December 2014, which was 7.6 points lower than the previous month and 1.9 points higher than December 2013.

Slide12Slide13Slide14

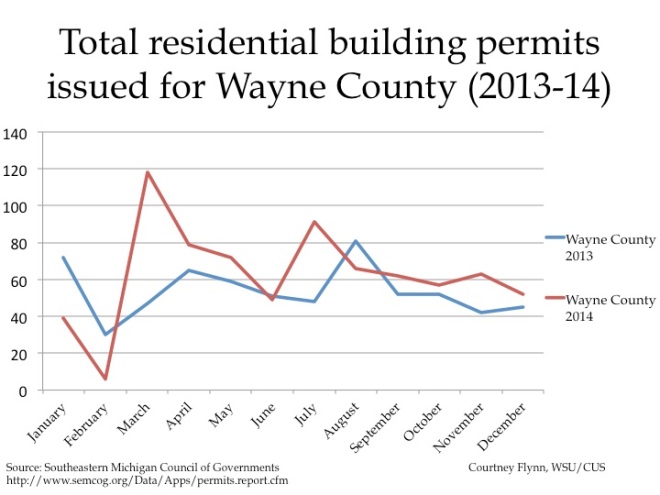
The above charts show the number of residential building permits obtained each month in Oakland, Macomb, and Wayne counties from January 2013 until December 2014. These numbers are reported by local municipalities to the Southeastern Michigan Council of Governments and include single-family units, two-family units, attached condos, and multi-family units.


Oakland, Wayne, and Macomb counties all experienced a decrease in the number of building permits pulled from November 2014 to December 2014. These declines are largely seasonal, due to weather. Only Wayne County issued more permits in December 2014 than it did in December 2013. Oakland County issued 131 permits in December of 2014, a decrease of 10 compared to November 2014 and a decrease of 18 compared to December 2013. Macomb County issued 31 permits in December 2014, 47 fewer than in November 2014 and 52 fewer than in December 2013.

Wayne County issued nine fewer building permits in December than November of this year; in total 52 permits were pulled. This is seven more than the number pulled for the county in December 2013.